
Understanding how to find a percentage of two numbers is more than just a basic mathematical requirement; it is the fundamental language of finance. Whether you are calculating the return on an investment, determining a business’s profit margin, or managing a household budget, percentages provide the context necessary to make informed decisions. In the world of money, absolute numbers often fail to tell the whole story. Knowing that a company made $1 million in profit is meaningless without knowing the revenue required to generate it. By converting these figures into percentages, we gain a standardized metric to evaluate performance, risk, and opportunity.
The Core Formula: Building a Foundation for Financial Literacy
To find what percentage one number is of another, the formula is straightforward: divide the “part” (the specific value you are interested in) by the “whole” (the total value) and then multiply the result by 100.
Formula: (Part / Whole) × 100 = Percentage
In a financial context, this formula allows us to understand the weight of specific expenses or the efficiency of savings. For example, if your monthly take-home pay is $5,000 and you save $750, you are looking to find what percentage $750 is of $5,000. Dividing 750 by 5,000 gives you 0.15. Multiplying by 100 results in a 15% savings rate.
Understanding the Role of “The Whole”
In personal finance, identifying the correct “whole” is critical. Are you calculating a percentage based on gross income (before taxes) or net income (after taxes)? Most financial advisors suggest using net income for budgeting purposes because it represents the actual liquidity available to you. However, when calculating tax brackets or retirement contributions like a 401(k), the “whole” is typically your gross income. Distinguishing between these two totals is the first step in accurate financial modeling.
The Power of Proportions in Wealth Building
Percentages allow for “apples-to-apples” comparisons across different scales. A person earning $50,000 who saves 20% of their income is often in a more secure long-term position than someone earning $200,000 who saves only 2%. By focusing on the percentage rather than the dollar amount, investors can develop habits that scale as their income grows. This proportional thinking is the bedrock of the “Pay Yourself First” mentality, where a fixed percentage of every dollar earned is diverted to assets before any discretionary spending occurs.
Measuring Investment Performance and Growth
One of the most common applications of finding a percentage between two numbers is calculating the Return on Investment (ROI) or the percentage change in an asset’s value. In this scenario, you are comparing the initial value of an investment to its current or final value.
Calculating Percentage Increase and Decrease
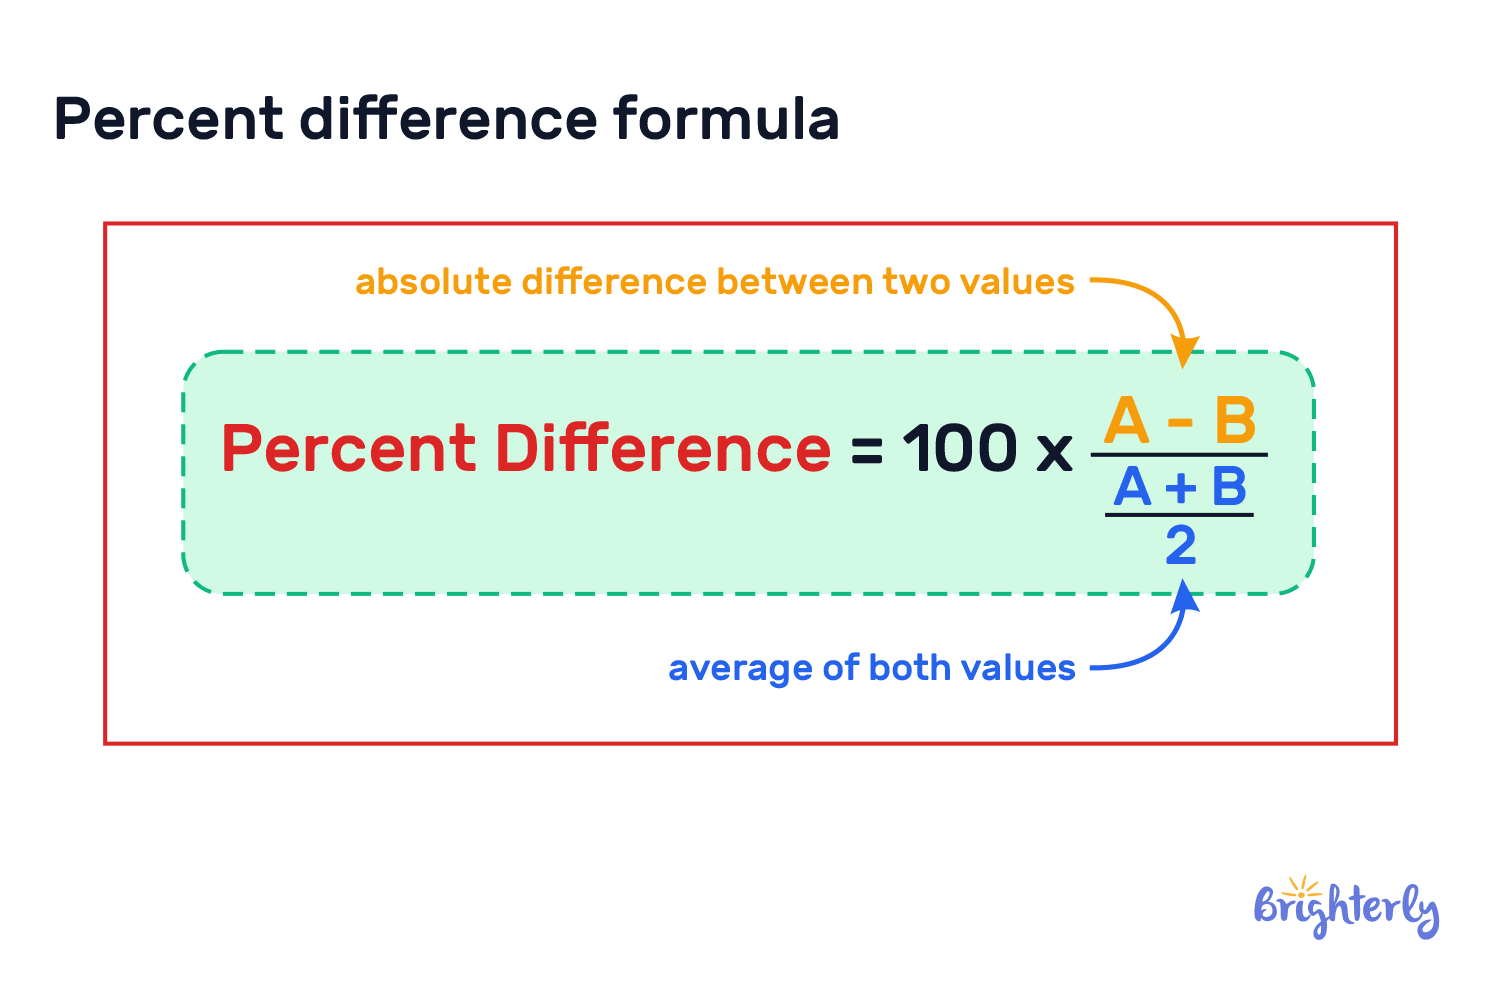
To find the percentage change between two numbers—such as the price of a stock at the beginning of the year versus the end—you use the following formula:
Formula: ((New Value – Old Value) / Old Value) × 100
If you purchased a share for $150 and it is now worth $180, the difference is $30. Dividing $30 by the original $150 gives you 0.20, or a 20% gain. Conversely, if the stock dropped to $120, the $30 loss divided by $150 results in a 20% decrease. This metric is vital because it helps investors compare the performance of different asset classes, such as real estate versus equities, regardless of their nominal price points.
The Nuance of Portfolio Allocation
Finding the percentage of two numbers is also essential for portfolio rebalancing. If you aim for a portfolio of 60% stocks and 40% bonds, you must constantly calculate the current value of each asset class against the total value of the portfolio. If a bull market pushes your stock value to $70,000 in a $100,000 portfolio, your stock percentage is now 70%. By identifying this percentage, you recognize the need to sell stocks and buy bonds to return to your target risk profile.
Yield and Dividend Calculations
For income-focused investors, the dividend yield is a critical percentage. It is found by dividing the annual dividend payment by the current share price. If a company pays $2.00 per share annually and the stock trades at $50.00, the yield is 4%. This allows the investor to compare the cash flow generated by the stock against the interest rates offered by savings accounts or government bonds.
Business Finance: Profit Margins and Operational Efficiency
For entrepreneurs and business owners, finding percentages is the primary method for auditing the health of a company. Revenue figures are “vanity metrics,” while percentages—specifically margins—are “sanity metrics.”
Gross vs. Net Profit Margin
A business produces two primary numbers: revenue (total sales) and profit (what remains after expenses). To find the profit margin, you divide profit by revenue.

-
Gross Profit Margin: This is calculated by taking Gross Profit (Revenue minus Cost of Goods Sold) and dividing it by Revenue. It reveals how efficiently a company produces its core products.
-
Net Profit Margin: This is the “bottom line.” It is calculated by taking Net Income (Total Revenue minus all expenses, taxes, and interest) and dividing it by Revenue.
If a business generates $1,000,000 in sales but only keeps $50,000 after all costs, its net profit margin is a slim 5%. By finding this percentage, the owner can see that despite high sales, the business is at risk if expenses rise even slightly.
Markup vs. Margin: Avoiding Common Errors
A frequent mistake in business finance is confusing markup with margin. Markup is the percentage added to the cost to reach a selling price, while margin is the percentage of the selling price that is profit. If an item costs $80 and you sell it for $100, the markup is 25% ($20 / $80), but the profit margin is only 20% ($20 / $100). Miscalculating this relationship can lead to underpricing products and eroding business capital.
Operating Expense Ratio
Finding the percentage of operating expenses relative to total revenue helps businesses identify “bloat.” By comparing the two numbers, management can set benchmarks. For instance, if marketing expenses traditionally account for 10% of revenue but suddenly jump to 18% without a corresponding increase in sales, the percentage calculation highlights an inefficiency that a raw dollar figure might obscure.
Budgeting and Personal Debt Management
In personal finance, the ability to find a percentage between two numbers is the key to debt liberation and sustainable budgeting. Financial institutions use these percentages to determine creditworthiness, and individuals should use them to track financial health.
The Debt-to-Income Ratio (DTI)
Lenders look at your DTI to decide if you qualify for a mortgage or loan. To find this percentage, you divide your total monthly debt payments by your gross monthly income. If your debts (car loan, student loans, credit cards) total $2,000 and your gross income is $6,000, your DTI is 33.3%. Keeping this percentage below 36% is generally considered the threshold for financial stability in the eyes of creditors.
The 50/30/20 Rule
Effective budgeting often relies on the 50/30/20 rule, which dictates that:
-
50% of income goes to Needs.
-
30% goes to Wants.
-
20% goes to Savings and Debt Repayment.
To apply this, you must constantly find the percentage of your spending categories relative to your total net income. If your “Needs” (rent, utilities, groceries) are consuming 65% of your income, finding that percentage tells you immediately that you must either increase your income or downsize your lifestyle to meet your long-term financial goals.
The Impact of Interest Rates (APR)
When you carry a balance on a credit card, the interest is a percentage of the principal. Understanding how this percentage works over time—specifically the difference between simple interest and compound interest—is vital. Finding the percentage of your monthly payment that goes toward interest versus the principal can be a sobering experience. In the early stages of a mortgage or high-interest credit card debt, the percentage of the payment applied to the principal may be shockingly low, highlighting the importance of extra payments to reduce the “whole” number.
Advanced Financial Applications and Economic Indicators
Beyond personal and business use, finding the percentage of two numbers is essential for understanding the broader economic environment, which ultimately impacts individual purchasing power.
Inflation and Purchasing Power
Inflation is measured as the percentage increase in the Price Index over a specific period. If the Consumer Price Index (CPI) moves from 300 to 324, that is an 8% increase. This percentage tells you that your money has lost 8% of its purchasing power. To maintain your standard of living, your income must grow by at least that same percentage. Comparing your annual raise (a percentage of your salary) to the inflation rate is the only way to know if you actually received a “real” raise or a “nominal” one.
Effective Tax Rate vs. Tax Bracket
Many people mistakenly believe that if they are in a 22% tax bracket, they pay 22% of their total income in taxes. However, by finding the percentage of your total tax paid divided by your total taxable income, you discover your “Effective Tax Rate.” Because of the progressive nature of tax systems and various deductions, the effective rate is almost always lower than the top bracket. Knowing this percentage is crucial for accurate tax planning and year-end forecasting.
The Rule of 72: A Shortcut for Percentages
While not a direct calculation of two numbers, the Rule of 72 is a mental model that utilizes percentages to understand the time value of money. By dividing 72 by your expected annual percentage return, you can estimate how many years it will take for your money to double. If you earn a 6% return on an investment, 72 divided by 6 equals 12 years. This illustrates why even a 1% or 2% difference in a management fee or an interest rate can have a massive impact on wealth over several decades.

Conclusion: The Strategic Advantage of Percentages
Mastering the ability to find a percentage of two numbers transforms raw data into actionable intelligence. In the realm of money, numbers are rarely static. They are constantly in motion—growing through interest, shrinking through inflation, or being diverted through taxes and expenses.
By consistently applying the “Part / Whole” formula, you move from a reactive state of simply watching your bank balance to a proactive state of managing your financial trajectory. Percentages strip away the noise of large, intimidating figures and reveal the underlying efficiency of your financial decisions. Whether you are a CEO looking at a corporate balance sheet or an individual building a retirement fund, the percentage remains the most powerful tool in your financial arsenal.
aViewFromTheCave is a participant in the Amazon Services LLC Associates Program, an affiliate advertising program designed to provide a means for sites to earn advertising fees by advertising and linking to Amazon.com. Amazon, the Amazon logo, AmazonSupply, and the AmazonSupply logo are trademarks of Amazon.com, Inc. or its affiliates. As an Amazon Associate we earn affiliate commissions from qualifying purchases.