
In the intricate world of personal finance, business operations, and investment strategies, percentages are not just mathematical curiosities; they are indispensable tools that quantify change, measure performance, and guide critical decisions. From deciphering a discount on a new purchase to understanding the annual percentage yield (APY) on your savings account, or evaluating the profit margins of a venture, a firm grasp of percentages empowers individuals and businesses to navigate their financial landscapes with confidence and precision. This article aims to demystify percentages, providing a comprehensive guide to understanding, calculating, and applying them effectively in various monetary contexts.

The Foundation: Understanding What a Percentage Is
At its core, a percentage is simply a way of expressing a number or a ratio as a fraction of 100. The term “percent” literally means “per one hundred.” It offers a standardized method to compare parts to a whole, making complex financial data more digestible and relatable. Whether you’re comparing investment returns over different periods or analyzing the proportion of your income allocated to various expenses, percentages provide a universal language for comparison and analysis.
Defining the Basics: Part, Whole, and the Symbol
To truly understand percentages, we must first identify its fundamental components:
- The Whole (or Total): This is the entire quantity or value you are considering. In financial terms, this could be your total income, the original price of an item, the full amount of a loan, or the total value of your investment portfolio.
- The Part: This is the specific portion or amount of the whole that you are interested in. This might be the discount amount, the interest paid, a specific expense category, or the gain from a particular stock.
- The Percentage Symbol (%): This universally recognized symbol denotes “out of one hundred.” When you see 25%, it means 25 out of 100, or 25/100.
Grasping these definitions is the first step toward accurately calculating and interpreting financial data expressed in percentages. It grounds the abstract concept in tangible financial realities.
The Core Formula: Bridging Fractions and Decimals
The beauty of percentages lies in their simplicity once you understand the underlying formula. The most common way to find what percentage one number is of another, or to express a part as a fraction of a whole, is given by:
Percentage = (Part / Whole) × 100
Let’s break this down:
- Divide the Part by the Whole: This step converts the ratio into a decimal. For example, if you spent $50 on dining out from your $2000 monthly income, you’d divide 50 by 2000, which gives you 0.025.
- Multiply by 100: To express this decimal as a percentage, you multiply the result by 100. So, 0.025 × 100 = 2.5%. This means 2.5% of your income went to dining.
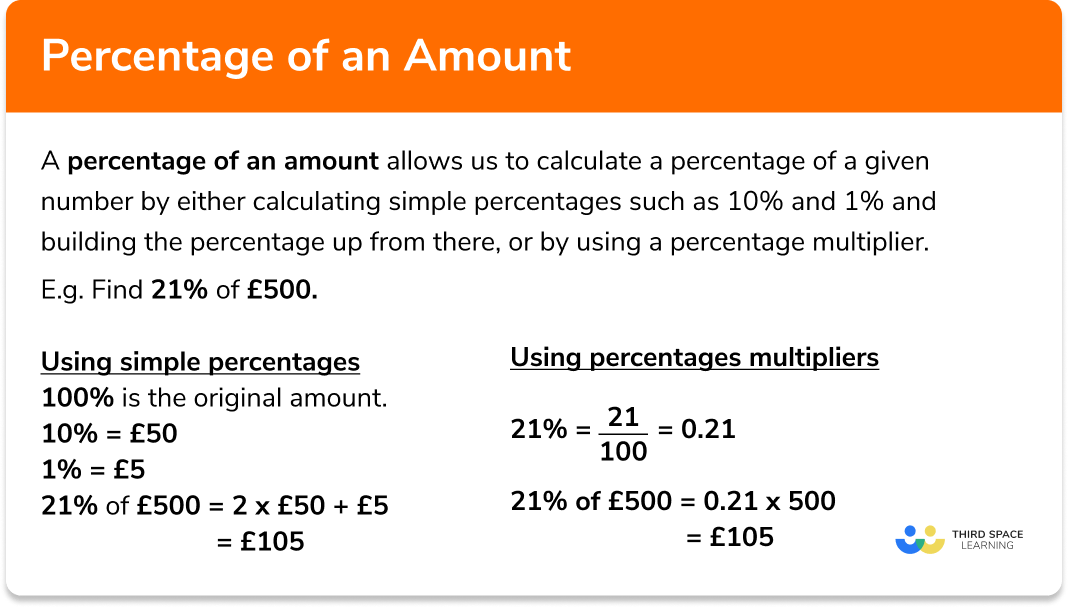
Conversely, if you need to find a specific percentage of a whole number (e.g., what is 15% of $300?), the formula slightly rearranges:
Part = (Percentage / 100) × Whole
Using the example: (15 / 100) × 300 = 0.15 × 300 = $45. This calculation is crucial for finding discounts, calculating tax, or determining a commission.
Practical Applications in Personal Finance
Percentages are the bedrock of sound personal financial management. From day-to-day spending to long-term savings goals, they offer a clear lens through which to view your financial health and make informed decisions.
Calculating Discounts and Sales Tax
One of the most frequent encounters with percentages in daily life involves shopping. When you see an item advertised at “20% off,” knowing how to quickly calculate that percentage can save you money and prevent overspending.
- Discount Calculation: If a jacket costs $150 and is 20% off, you first calculate 20% of $150: (20 / 100) × 150 = 0.20 × 150 = $30. The discount amount is $30, so the new price is $150 – $30 = $120. Alternatively, you can calculate the remaining percentage (100% – 20% = 80%) and find 80% of the original price: 0.80 × 150 = $120.
- Sales Tax: Similarly, sales tax is applied as a percentage of the purchase price. If your new $120 jacket has a 7% sales tax, you calculate 7% of $120: (7 / 100) × 120 = 0.07 × 120 = $8.40. Your total cost would be $120 + $8.40 = $128.40.
Mastering these simple calculations ensures you always know the true cost of your purchases.
Understanding Tips, Commissions, and Interest Rates
Beyond shopping, percentages govern how we reward service, how professionals earn income, and how our money grows or costs us more.
- Tips: Tipping 15-20% for good service is common. For a $60 restaurant bill, a 18% tip would be (18 / 100) × 60 = $10.80.
- Commissions: Many salespeople earn a commission, which is a percentage of their sales. If a real estate agent earns a 2.5% commission on a $300,000 home sale, their commission would be (2.5 / 100) × 300,000 = $7,500.
- Interest Rates: Perhaps one of the most significant financial applications, interest rates are almost always expressed as percentages.
- Simple Interest: If you borrow $1,000 at a 5% simple annual interest rate, you’d owe $50 in interest after one year (5% of $1,000).
- Compound Interest (APY/APR): Savings accounts, loans, and credit cards often use compound interest, where interest is calculated not only on the initial principal but also on the accumulated interest from previous periods. Understanding Annual Percentage Yield (APY) for savings and Annual Percentage Rate (APR) for loans is crucial for long-term financial planning, as even small percentage differences can amount to significant sums over time.
Budgeting and Tracking Spending Habits
Creating and sticking to a budget is a cornerstone of financial health, and percentages are your best allies here. Many budgeting methodologies suggest allocating specific percentages of your income to different categories (e.g., the 50/30/20 rule: 50% for needs, 30% for wants, 20% for savings/debt repayment).
- Allocating Income: If your net monthly income is $4,000:
- 50% for needs = 0.50 × 4000 = $2,000
- 30% for wants = 0.30 × 4000 = $1,200
- 20% for savings/debt = 0.20 × 4000 = $800
- Analyzing Spending: By tracking your expenses, you can determine what percentage of your income goes to specific areas. If your total monthly expenses are $3,500 and you spend $700 on housing, then housing accounts for ($700 / $3,500) × 100 = 20% of your total expenses. This allows for easy identification of areas where you might be overspending.
Percentages in Business and Investing
Moving beyond personal finances, percentages are the language of business analytics, financial reporting, and investment performance. They allow for consistent comparisons across companies of different sizes or investments with varying capitalizations.
Analyzing Profit Margins and Business Growth
Businesses rely heavily on percentages to gauge their efficiency and growth trajectory.
- Profit Margins: Gross profit margin, operating profit margin, and net profit margin are all expressed as percentages.
- Gross Profit Margin = (Gross Profit / Revenue) × 100. This tells a business how much profit it makes from its sales after accounting for the cost of goods sold. A higher percentage indicates greater efficiency in production.
- Net Profit Margin = (Net Profit / Revenue) × 100. This shows the percentage of revenue that translates into actual profit for the company after all expenses, including taxes, have been paid.
- Revenue Growth: Businesses often track their year-over-year revenue growth as a percentage. If a company’s revenue grew from $1 million to $1.2 million, the percentage growth is (($1.2 million – $1 million) / $1 million) × 100 = 20%. This metric is crucial for investors and stakeholders.
Interpreting Investment Returns and Portfolio Allocation
For investors, percentages are the primary way to understand performance and manage risk.
- Return on Investment (ROI): This is a key metric for evaluating the profitability of an investment. If you invest $10,000 and it grows to $12,000, your ROI is (($12,000 – $10,000) / $10,000) × 100 = 20%.
- Portfolio Allocation: Investors strategically divide their capital among different asset classes (stocks, bonds, real estate) based on percentages. A common strategy might be 60% stocks, 30% bonds, and 10% cash, tailored to an individual’s risk tolerance and financial goals. Rebalancing a portfolio means adjusting these percentages back to the desired allocation.
- Dividend Yield: This is the annual dividend paid out by a company, expressed as a percentage of its current stock price. It helps investors assess the income-generating potential of a stock.
Decoding Economic Indicators and Market Trends
On a macroeconomic level, percentages are used to report and interpret crucial economic data that influences markets and policy decisions.
- Inflation Rate: The percentage increase in the general price level of goods and services over a period. A 3% inflation rate means prices have, on average, risen by 3%.
- Unemployment Rate: The percentage of the total labor force that is unemployed and actively seeking employment.
- GDP Growth Rate: The percentage increase in a country’s Gross Domestic Product, indicating economic expansion or contraction.
- Interest Rate Changes: Central banks use percentage points to announce changes in benchmark interest rates, which profoundly impact lending, borrowing, and investment across the economy.
Mastering Percentage Change: Growth and Decline
Beyond finding a percentage of a number, understanding percentage change is vital for evaluating financial progress or setbacks over time. This applies equally to personal savings, business revenues, and market values.
Calculating Percentage Increase: From Savings to Stock Gains
When a value grows, we calculate the percentage increase.
Percentage Increase = ((New Value – Original Value) / Original Value) × 100
- Example: Savings Growth: If your savings account grew from $5,000 to $5,300 in a year, the percentage increase is (($5,300 – $5,000) / $5,000) × 100 = ($300 / $5,000) × 100 = 0.06 × 100 = 6%.
- Example: Stock Price Appreciation: A stock that rises from $100 to $115 has seen a percentage increase of (($115 – $100) / $100) × 100 = ($15 / $100) × 100 = 15%.
Calculating Percentage Decrease: Understanding Losses and Depreciation
Conversely, when a value shrinks, we calculate the percentage decrease.
Percentage Decrease = ((Original Value – New Value) / Original Value) × 100
- Example: Depreciation: A car purchased for $30,000 is valued at $24,000 after one year. The percentage decrease (depreciation) is (($30,000 – $24,000) / $30,000) × 100 = ($6,000 / $30,000) × 100 = 0.20 × 100 = 20%.
- Example: Inventory Reduction: If a store reduces its inventory from 500 units to 425 units, the percentage decrease is ((500 – 425) / 500) × 100 = (75 / 500) × 100 = 0.15 × 100 = 15%.
It’s important to note that the original value is always in the denominator when calculating percentage change.
Tools and Tips for Accurate Percentage Calculations
While the underlying math is straightforward, accuracy is paramount in financial calculations.
Leveraging Calculators and Spreadsheets
For complex calculations or when dealing with large numbers, modern tools are invaluable.
- Standard Calculators: Most scientific and even basic calculators have a “%” button, which can simplify steps, though understanding the manual calculation ensures you never misuse it.
- Spreadsheets (Excel, Google Sheets): These are perhaps the most powerful tools for financial percentage calculations. They allow you to input formulas once and apply them across vast datasets. For instance, to calculate a percentage in Excel, if your part is in cell A1 and your whole is in cell B1, you would simply type
= (A1/B1)*100into another cell. You can also format cells directly as percentages.
Mental Math Shortcuts for Quick Estimates
While precision is key for formal reports, quick mental estimates using percentages can be incredibly useful in everyday financial scenarios, like estimating a tip or a discount.
- Finding 10%: To find 10% of any number, just move the decimal point one place to the left. (e.g., 10% of $250 is $25).
- Finding 5%: Find 10% and then halve it (e.g., 5% of $250 is $25/2 = $12.50).
- Finding 1%: Move the decimal two places to the left (e.g., 1% of $250 is $2.50).
- Combining for larger percentages: To find 25%, find 10% twice, then add 5% (10%+10%+5% = 25%). Or, simply divide by 4.
These shortcuts can help you quickly verify calculations or make on-the-spot financial judgments.

Conclusion
Percentages are more than just mathematical expressions; they are a critical language for financial literacy. Whether you’re managing personal budgets, analyzing business performance, or making informed investment decisions, the ability to find and interpret percentages is an indispensable skill. By understanding the core formulas, recognizing their widespread applications in monetary contexts, and leveraging the right tools, you empower yourself to gain deeper insights into your financial world, making smarter, more strategic choices that lead to greater financial well-being and success. Embrace the power of the percentage – it’s a small number that makes a huge difference.
aViewFromTheCave is a participant in the Amazon Services LLC Associates Program, an affiliate advertising program designed to provide a means for sites to earn advertising fees by advertising and linking to Amazon.com. Amazon, the Amazon logo, AmazonSupply, and the AmazonSupply logo are trademarks of Amazon.com, Inc. or its affiliates. As an Amazon Associate we earn affiliate commissions from qualifying purchases.