
In an increasingly data-driven world, understanding and interpreting percentages is a fundamental skill. From tracking project progress and analyzing market shares to evaluating performance metrics and comparing financial data, percentages provide a standardized and easily digestible way to express proportions and changes. While the underlying mathematical concept is straightforward, the “how-to” in a modern context often involves leveraging an array of digital tools and technologies. This article delves into the various tech-driven approaches to converting raw numbers into meaningful percentages, ensuring accuracy, efficiency, and insightful interpretation.
The Foundational Concept: What is a Percentage?
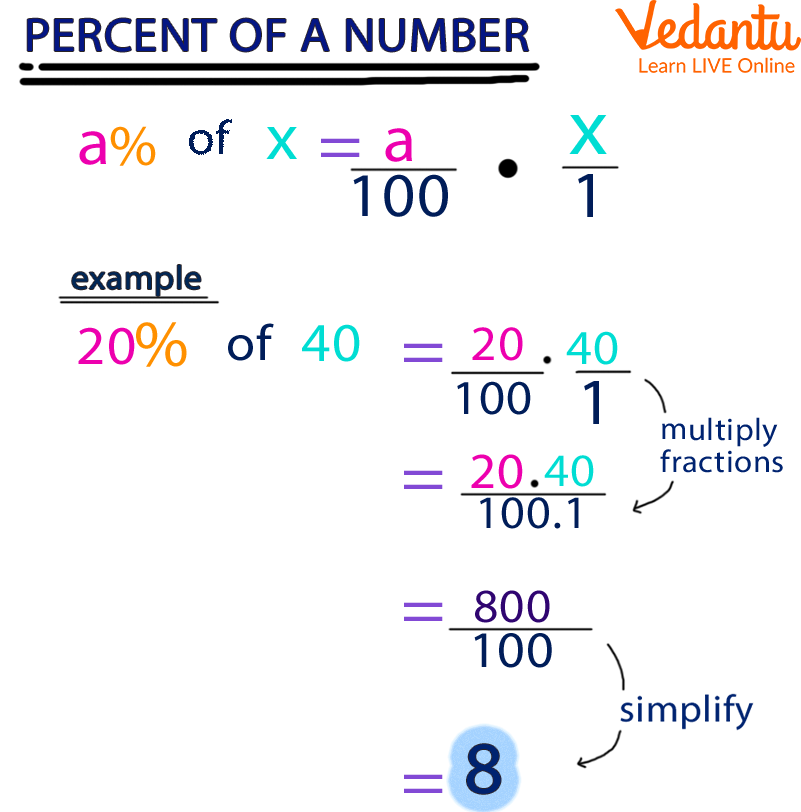
Before diving into the digital methodologies, it’s crucial to firmly grasp the core concept of a percentage. At its heart, a percentage is a way of expressing a number as a fraction of 100. The word “percent” literally means “per hundred.” It allows us to standardize comparisons, making it easier to understand relationships between different quantities regardless of their absolute values.
Demystifying the “Per Hundred”
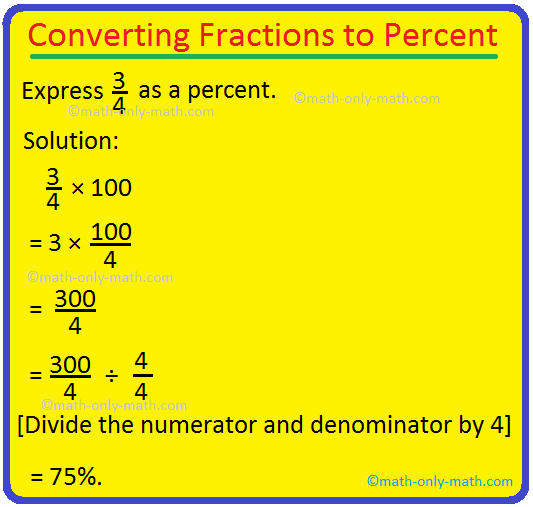
The basic formula for converting any fraction or decimal into a percentage is:
(Part / Whole) × 100 = Percentage (%)
- Part: This is the specific quantity or amount you are interested in.
- Whole: This is the total quantity or the reference amount against which the “part” is being measured.
For example, if 15 out of 50 tasks are completed, the “part” is 15, and the “whole” is 50.
(15 / 50) × 100 = 0.3 × 100 = 30%. This means 30% of the tasks are completed.
Understanding this fundamental relationship is the bedrock upon which all digital conversion methods are built. Whether you’re inputting data into a spreadsheet, writing a script, or configuring an AI model, the logic remains the same.
Why Percentages are Crucial in Data Analysis
In the realm of technology and data, percentages offer several key advantages:
- Standardization: They normalize data, allowing for apples-to-apples comparisons across different datasets, scales, and timeframes.
- Clarity and Simplicity: They provide an intuitive way to communicate proportions and changes, making complex data accessible to a wider audience, including non-technical stakeholders.
- Impact Assessment: They are indispensable for measuring growth, decline, efficiency, market penetration, conversion rates, and deviation from targets.
- Decision Making: From A/B testing conversion rates in a web application to analyzing resource allocation, percentages inform strategic choices across all tech domains.
Software Tools for Seamless Percentage Conversion
The most common and accessible tools for converting to percentages are widely available software applications. These platforms not only perform the arithmetic but also offer robust features for data organization, visualization, and automation.
Unleashing the Power of Spreadsheets (Excel, Google Sheets)
Spreadsheets like Microsoft Excel and Google Sheets are the workhorses of data management and calculation for millions. Their intuitive grid-based interface and powerful formula capabilities make percentage conversion straightforward for both simple and complex datasets.
Basic Formula: (Part/Whole)*100
To convert to percentage in a spreadsheet, you simply enter the formula that reflects the “Part / Whole” logic:
- Input Data: Enter your ‘Part’ value in one cell (e.g., A2) and your ‘Whole’ value in another (e.g., B2).
- Apply Formula: In a third cell (e.g., C2), type
=(A2/B2)*100. Press Enter. This will give you the decimal percentage.
Formatting Cells for Percentage Display
While the (Part/Whole)*100 formula works, spreadsheets offer an even more elegant way to display percentages. If you simply use =(A2/B2) and then apply the “Percentage” format to cell C2, the spreadsheet automatically multiplies the result by 100 and adds the percentage symbol. You can also specify the number of decimal places. This method is generally preferred as it separates the calculation from the presentation.
Practical Examples: Growth Rates, Proportions
- Growth Rate: To calculate percentage growth from a previous period (e.g., last month’s sales vs. this month’s):
((Current Sales - Previous Sales) / Previous Sales) * 100. - Proportion of Total: If you have several categories (e.g., product sales by region) and want to know each region’s percentage contribution to total sales:
(Regional Sales / SUM(All Regional Sales)). Apply percentage formatting. - Discount Calculation: To find the percentage discount:
((Original Price - Sale Price) / Original Price) * 100.
Spreadsheets excel in handling dynamic data, allowing you to quickly update values and see percentage changes reflected instantly, which is invaluable for real-time analysis in tech projects.
Leveraging Programming Languages for Automation (Python, JavaScript)
For more complex data processing, automation, or integration into larger applications, programming languages offer unparalleled flexibility and power for percentage conversion. Python and JavaScript are excellent examples due to their widespread use in data science, web development, and backend systems.
Basic Arithmetic Operations in Code
In any programming language, the core mathematical operation (Part / Whole) * 100 is directly translated.
Python Example:
part = 15
whole = 50
percentage = (part / whole) * 100
print(f"{percentage:.2f}%") # Output: 30.00%
JavaScript Example:
let part = 15;
let whole = 50;
let percentage = (part / whole) * 100;
console.log(`${percentage.toFixed(2)}%`); // Output: 30.00%
Functions for Reusability
Encapsulating percentage conversion logic within functions makes your code modular and reusable.
Python Function:
def calculate_percentage(part, whole):
    if whole == 0:
        return 0 # Handle division by zero
    return (part / whole) * 100

completion_rate = calculate_percentage(15, 50)
print(f"Completion rate: {completion_rate:.2f}%")
JavaScript Function:
function calculatePercentage(part, whole) {
    if (whole === 0) {
        return 0; // Handle division by zero
    }
    return (part / whole) * 100;
}


<p style="text-align:center;"><img class="center-image" src="https://www.wikihow.com/images/thumb/b/b1/Convert-to-Percentage-Step-15-Version-2.jpg/aid676526-v4-1200px-Convert-to-Percentage-Step-15-Version-2.jpg" alt=""></p>


let conversionRate = calculatePercentage(75, 1000);
console.log(`Conversion rate: ${conversionRate.toFixed(2)}%`);
Integrating into Larger Data Pipelines
In data science or web analytics, percentage calculations are often steps within a larger process. For instance, you might use Python’s Pandas library to calculate conversion rates across thousands of user sessions, or JavaScript to dynamically update a progress bar based on task completion percentages in a web application. The ability to programmatically handle large datasets and integrate percentage logic into automated workflows is a key advantage of using programming languages.
Specialized Apps and Digital Calculators
Beyond general-purpose software and programming, a host of specialized tools are designed to facilitate percentage calculations, often within specific domains or for quick, on-the-go computations.
Dedicated Percentage Calculators and Mobile Apps
The simplest form of digital percentage conversion comes from dedicated calculators. Many operating systems (Windows, macOS, iOS, Android) include built-in calculators that can perform percentage operations directly (e.g., calculating a tip percentage, finding a percentage increase/decrease). Additionally, numerous mobile apps are solely focused on percentage calculations, offering user-friendly interfaces for common tasks like discounts, interest, or tax calculations. These are ideal for quick, practical applications without needing to open a spreadsheet or write code.
Integrating Percentage Calculations into Business Software (BI Tools, ERPs)
Modern business software heavily relies on percentage metrics.
- Business Intelligence (BI) Tools: Platforms like Tableau, Power BI, and Looker are designed to ingest vast amounts of data and present it through interactive dashboards. They inherently support percentage calculations for visualizing market share, sales growth, customer retention rates, and more. Users can often drag-and-drop fields to create calculations that automatically convert to percentages and display them graphically.
- Enterprise Resource Planning (ERP) Systems: ERPs like SAP, Oracle, and Microsoft Dynamics often include modules for financial reporting, inventory management, and sales tracking. Within these systems, performance indicators such as profit margins, stock depletion rates, and order fulfillment percentages are calculated and presented as standard metrics, typically configured through the system’s reporting functionalities.
- Customer Relationship Management (CRM) Systems: CRMs like Salesforce track sales pipelines, customer engagement, and marketing campaigns. Percentage metrics such as lead conversion rates, customer churn rates, and campaign response rates are integral to evaluating the effectiveness of sales and marketing efforts. The system’s reporting features allow users to define and display these percentages effortlessly.
These integrated solutions abstract the underlying calculation, presenting users with ready-made percentage insights, often with the ability to drill down into the raw data.
Advanced Applications: AI and Data Science in Percentage Analysis
As data volumes grow and analysis becomes more sophisticated, AI and data science techniques are increasingly employed to derive and interpret percentages, moving beyond simple calculations to predictive and prescriptive insights.
AI-Driven Insights and Anomaly Detection
Artificial Intelligence, particularly machine learning, can process massive datasets to identify patterns and anomalies that might be expressed as percentages. For example:
- Fraud Detection: AI algorithms can flag transactions that deviate by a suspicious percentage from typical user spending patterns.
- System Monitoring: In IT operations, AI monitors system performance, detecting unusual percentage drops in server uptime or increases in error rates, signaling potential issues before they become critical.
- Customer Behavior Analysis: AI can identify groups of customers with specific purchase patterns, calculating the percentage of customers likely to churn or respond to a particular marketing offer.
While AI doesn’t “convert to percentage” in the fundamental arithmetic sense, it utilizes these calculations extensively within its models to generate actionable insights and alerts based on percentage thresholds.
Machine Learning for Predictive Percentage Modeling
Machine learning models can be trained to predict future percentage outcomes.
- Predictive Analytics: Forecasting future sales growth percentages, market share percentages for new products, or the percentage likelihood of project success based on historical data.
- Risk Assessment: Calculating the percentage probability of loan defaults, equipment failure, or cybersecurity breaches.
- Personalized Recommendations: Predicting the percentage chance a user will click on an ad or purchase a product, leading to highly tailored recommendations.
These models output probabilities (which are essentially percentages) that help businesses make proactive, data-informed decisions.
Visualizing Percentage Data for Impact
Data visualization is a critical aspect of communicating percentage insights effectively. Tools ranging from spreadsheet charts to advanced BI dashboards and specialized visualization libraries (like D3.js, Matplotlib, Seaborn) allow for compelling visual representations:
- Pie Charts and Donut Charts: Excellent for showing parts of a whole (e.g., market share, budget allocation).
- Bar Charts: Useful for comparing percentages across different categories or over time (e.g., conversion rates by campaign, growth percentages by quarter).
- Line Graphs: Ideal for tracking percentage changes over a continuous period (e.g., website bounce rate trends, stock price percentage changes).
- Heatmaps: Can show percentage intensity across a grid (e.g., click-through rates on different areas of a webpage).
Effective visualization makes complex percentage data immediately understandable, facilitating quicker comprehension and better decision-making.
Best Practices for Accuracy and Interpretation
While digital tools make percentage conversion easy, responsible data handling requires adherence to best practices to ensure accuracy, context, and ethical presentation.
Understanding Context and Base Values
A percentage is only meaningful in the context of its “whole” or base value. Misinterpreting the base is a common error:
- Absolute vs. Relative: A “10% increase” means very different things if the base was 100 versus 1,000,000. Always clarify what the percentage is of.
- Consistent Base: When comparing percentages, ensure they are derived from the same or comparable base values. Comparing a percentage of profit from a small startup to a percentage of profit from a multinational corporation without considering the vast difference in revenue can be misleading.
- Percentage Points vs. Percent Change: A common pitfall is confusing an increase in “percentage points” with a “percent increase.” If a market share goes from 20% to 25%, that’s a 5 percentage point increase, but a 25% percent increase ( (25-20)/20 * 100).
Avoiding Common Calculation Errors
Digital tools reduce arithmetic errors but cannot prevent logical errors:
- Division by Zero: Always implement checks (as shown in programming examples) to handle cases where the ‘whole’ or denominator is zero, which would otherwise cause an error.
- Rounding Errors: Be mindful of how percentages are rounded, especially when dealing with critical financial or scientific data. Excessive rounding can accumulate and lead to inaccuracies.
- Data Integrity: Ensure the input data (‘part’ and ‘whole’) is accurate, clean, and consistent. Garbage in, garbage out.
Presenting Percentage Data Clearly and Ethically
The way percentage data is presented can significantly influence its interpretation:
- Transparency: Always disclose the raw numbers or the base from which percentages were derived, especially in formal reports or public statements.
- Clear Labeling: Ensure all charts, graphs, and tables are clearly labeled, indicating what the percentages represent and their units.
- Avoid Misleading Visualizations: Be cautious with chart scaling and axes to avoid exaggerating or downplaying percentage changes. A truncated Y-axis, for instance, can make small percentage shifts appear dramatic.
- Focus on Actionable Insights: Present percentages not just as numbers, but as drivers for understanding trends, making decisions, or highlighting performance.
In conclusion, converting to percentages is a fundamental skill amplified by technology. From the ubiquitous spreadsheet to advanced AI, digital tools empower us to perform these conversions with unprecedented speed and accuracy. By understanding the underlying mathematical principles, mastering the available software and programming techniques, and adhering to best practices for interpretation and presentation, you can harness the power of percentages to unlock profound insights and drive informed decisions in any tech-driven endeavor.
aViewFromTheCave is a participant in the Amazon Services LLC Associates Program, an affiliate advertising program designed to provide a means for sites to earn advertising fees by advertising and linking to Amazon.com. Amazon, the Amazon logo, AmazonSupply, and the AmazonSupply logo are trademarks of Amazon.com, Inc. or its affiliates. As an Amazon Associate we earn affiliate commissions from qualifying purchases.