
Graphing a function is more than just plotting points on a coordinate plane; it’s about unlocking a visual language that reveals the behavior, patterns, and critical characteristics of mathematical relationships. In an increasingly data-driven world, the ability to visualize functions is not merely an academic exercise but a foundational skill across science, engineering, economics, and data analysis. While the manual method of plotting points has its place in teaching fundamental concepts, the advent of technology has revolutionized how we approach function graphing, making it faster, more accurate, and profoundly more insightful. This article will guide you through the digital landscape of function graphing, exploring the tools and techniques that transform complex equations into accessible visual narratives.
The Enduring Value of Visualizing Functions
Before diving into the “how,” it’s crucial to understand the “why.” A function, at its core, describes a relationship where every input has exactly one output. While its algebraic form provides a precise definition, its graph offers an intuitive understanding that often eludes symbolic manipulation alone.
Understanding the Language of Graphs
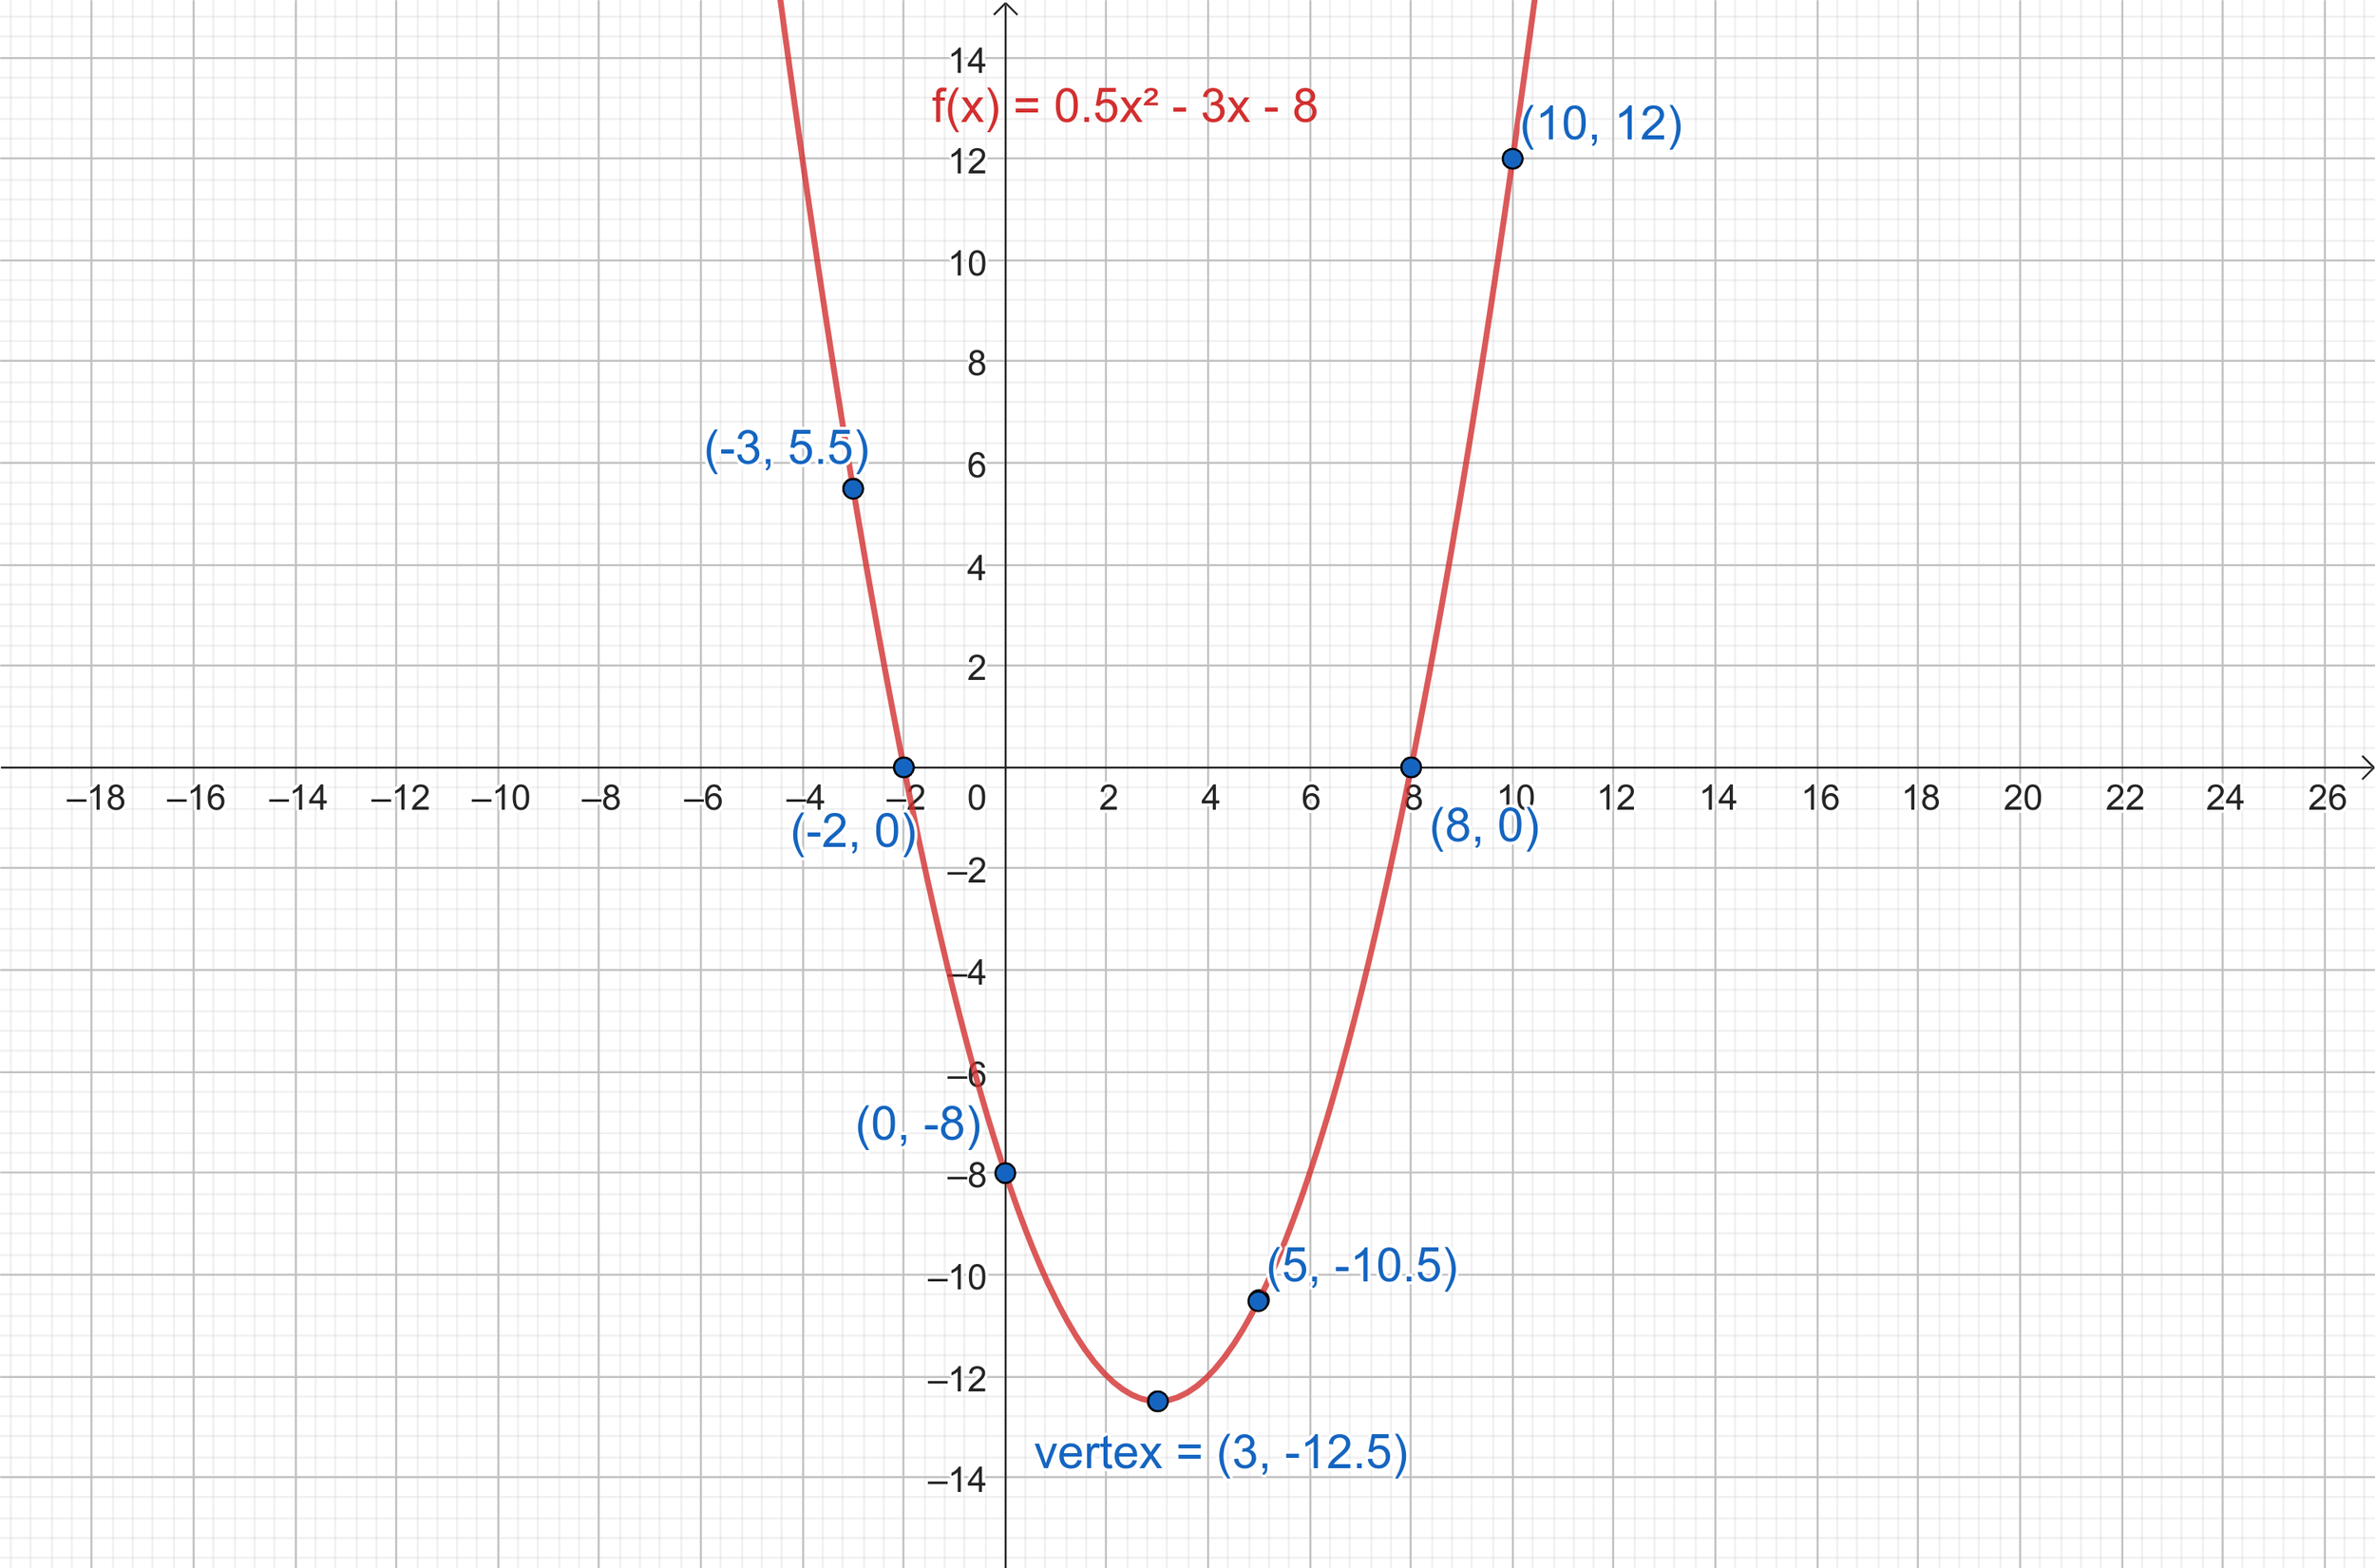
A graph serves as a visual fingerprint of a function. It allows us to immediately grasp key attributes such as intercepts (where the graph crosses the x and y axes), turning points (local maxima and minima), asymptotes (lines that the graph approaches but never touches), and overall trends like increasing or decreasing intervals. For instance, the simple upward curve of a quadratic function or the oscillating wave of a sine function immediately conveys their inherent properties in a way that y = x² or y = sin(x) might not to the untrained eye. This visual intuition is invaluable for problem-solving and making predictions.
Bridging Theory and Application
In fields like physics, a graph might depict the trajectory of a projectile; in economics, it could show the relationship between supply and demand; and in computer science, it might illustrate algorithm efficiency. Each of these applications relies heavily on the ability to interpret the visual information presented by a function’s graph. Technology has amplified this capacity, allowing professionals and students alike to move beyond tedious manual calculations to focus on the interpretation and implications of these visual models. This shift empowers users to rapidly test hypotheses, explore variations, and gain deeper insights, thus bridging the gap between abstract mathematical theory and its concrete real-world applications.
Modern Tech Tools for Seamless Function Graphing
The days of painstakingly plotting dozens of points by hand are largely behind us, thanks to a rich ecosystem of technological tools designed specifically for graphing functions. These tools range from handheld calculators to sophisticated software applications and web-based platforms, each offering unique advantages depending on the user’s needs and technical proficiency.
Dedicated Graphing Software and Online Platforms
Leading the charge in accessible and powerful graphing are specialized software and online platforms. Tools like Desmos, GeoGebra, and Wolfram Alpha have become indispensable for students and professionals alike.
- Desmos: Renowned for its intuitive interface, Desmos is a free online graphing calculator that allows users to type in functions directly, instantly visualizing their graphs. It supports a vast array of functions, from basic linear equations to complex parametric and polar curves, and even offers interactive sliders to explore variable changes in real-time. Its collaborative features also allow for easy sharing of graphs.
- GeoGebra: A dynamic mathematics software for all levels of education, GeoGebra combines geometry, algebra, spreadsheets, graphing, statistics, and calculus into one easy-to-use package. It’s particularly powerful for visualizing not just functions but also geometric constructions and calculus concepts interactively.
- Wolfram Alpha: While not solely a graphing tool, Wolfram Alpha is a computational knowledge engine that can graph virtually any function entered, providing not only the visual representation but also a wealth of analytical information, including roots, derivatives, integrals, and series expansions.
Scientific and Graphing Calculators
For those who prefer a more portable and offline solution, physical graphing calculators remain a staple in many educational and professional settings. Devices like the TI-84 Plus and Casio fx-CG50 are powerful mini-computers capable of plotting multiple functions simultaneously, analyzing data, and even running simple programs. While they might have a steeper learning curve than online platforms, their robust capabilities and exam-approved status make them invaluable for specific contexts. Modern graphing calculators often come with color screens and enhanced user interfaces, making function visualization clearer and more engaging than ever before.
Spreadsheet Programs and Programming Libraries
Beyond dedicated graphing tools, general-purpose software like Microsoft Excel or Google Sheets can also be surprisingly effective for graphing functions, especially when dealing with discrete data points generated from a function. By creating columns for input (x) and output (y) values and then using the charting features, users can generate scatter plots and line graphs.
For those with programming experience, libraries in languages like Python (e.g., Matplotlib, Seaborn) or R (e.g., ggplot2) offer unparalleled flexibility and control over graph customization. These tools are particularly favored in data science and research for generating publication-quality visualizations and for integrating graphing into larger analytical workflows. They allow for intricate control over every aspect of a plot, from line styles and colors to complex annotations and subplots.
A Step-by-Step Guide to Digital Function Graphing
Regardless of the tool you choose, the fundamental process of graphing a function digitally follows a consistent pattern. Understanding these steps will empower you to efficiently visualize any mathematical relationship.
1. Selecting Your Tool and Understanding Its Interface
The first step is to choose the technology that best fits your needs and comfort level. If you’re new to graphing, start with user-friendly web platforms like Desmos. Familiarize yourself with the interface: locate the input field for functions, the zoom and pan controls, and any settings for axes or grid lines. Most digital graphing tools are designed to be intuitive, often requiring minimal instruction to get started. Many also offer helpful tutorials or quick-start guides within the application itself.
2. Inputting Your Function
This is where the magic happens. In most digital tools, you simply type your function directly into an input bar. For example, to graph y = 2x + 1, you would type y = 2x + 1 or just 2x + 1. Pay attention to syntax:
- Use
*for multiplication (e.g.,2*xnot2x). - Use
^for exponents (e.g.,x^2for x-squared). - Be mindful of parentheses for order of operations (e.g.,
(x+1)^2is different fromx+1^2). - Common mathematical functions like
sin(x),cos(x),sqrt(x),log(x),abs(x)are typically supported with standard notation.
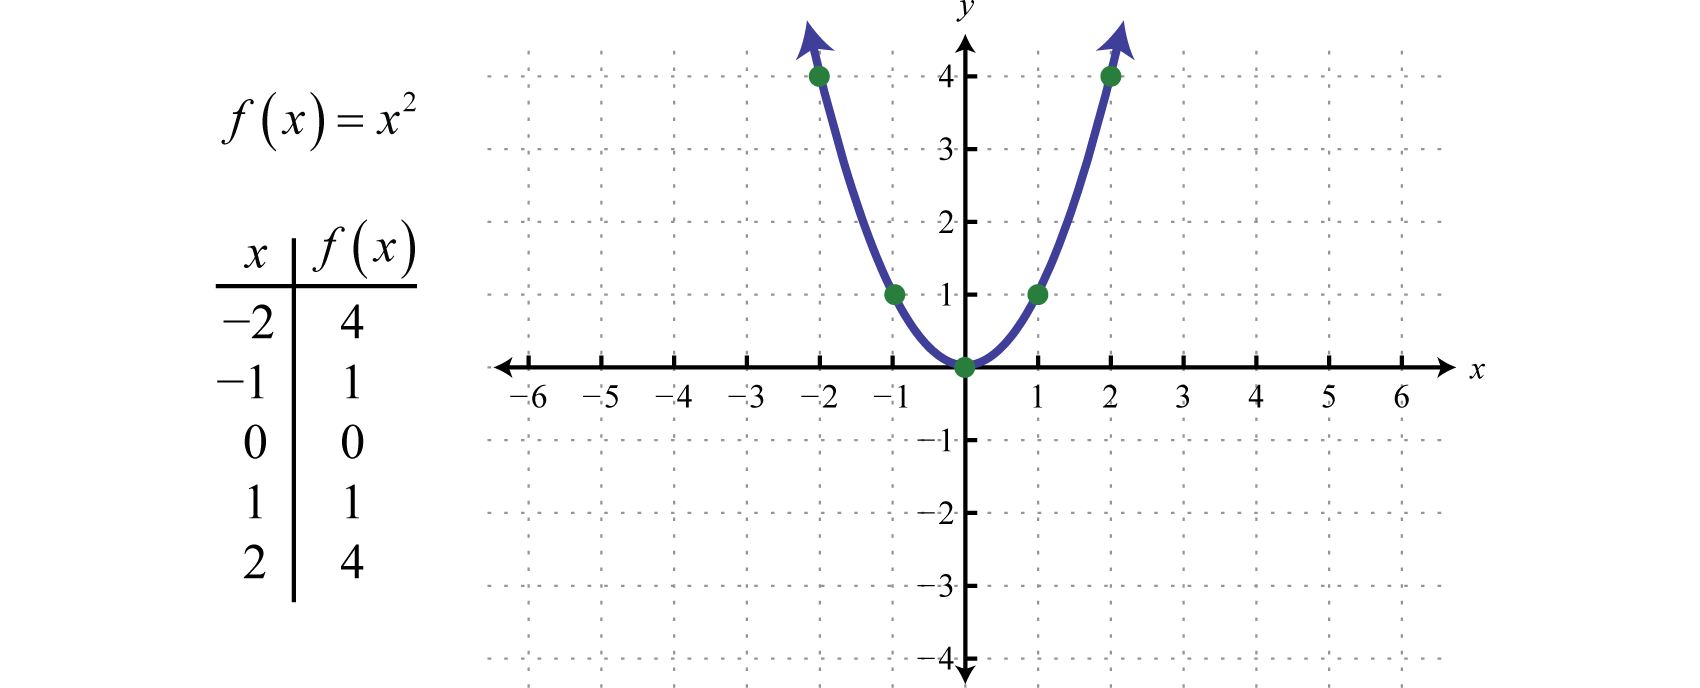
As you type, many tools will instantly render the graph, allowing for immediate feedback and correction of syntax errors.
3. Adjusting the View and Exploring Characteristics
Once your function is graphed, the default view might not always be optimal. You’ll often need to adjust the viewing window (also known as the “domain” and “range” of the graph display) to see the most relevant parts of the function.
- Zoom In/Out: Use mouse scrolls, pinch gestures, or dedicated buttons to magnify or shrink the view.
- Pan: Click and drag the graph to move it around the screen.
- Set Axes Ranges: Most tools allow you to manually set the minimum and maximum values for the x and y axes. This is crucial for focusing on specific intervals or ensuring all critical points are visible.
- Trace Features: Many graphing tools offer a “trace” function, allowing you to move a cursor along the graph and see the exact (x, y) coordinates at various points. This is excellent for finding specific values or verifying intercepts and turning points.
4. Leveraging Advanced Features for Deeper Analysis
Modern graphing tools offer much more than just plotting lines. Explore features that can enhance your understanding:
- Multiple Functions: Graph several functions on the same axes to compare their behaviors, find points of intersection, or analyze systems of equations.
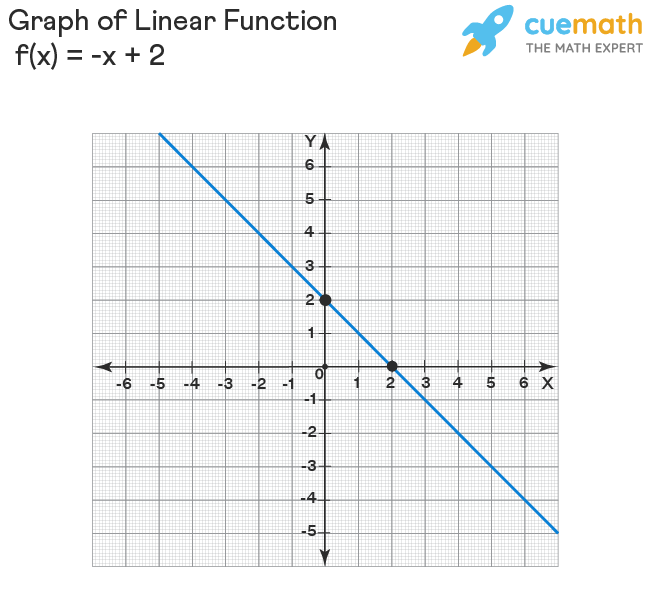
- Sliders and Parameters: Use sliders to dynamically change constants within your function (e.g., graphing
y = mx + band adjustingmandbwith sliders). This is incredibly powerful for understanding the impact of different parameters on the function’s shape and position. - Derivatives and Integrals: Some advanced tools can graph the derivative or integral of a function directly, providing a visual representation of rates of change or accumulated values.
- Regressions: For data sets, many tools can perform regression analysis to find the function that best fits the data, then graph both the data points and the regression curve.
By mastering these steps, you transform function graphing from a tedious task into an interactive exploration, unlocking deeper insights into mathematical relationships.
Best Practices and Benefits of Tech-Enhanced Graphing
Embracing technology for function graphing brings a host of benefits that extend beyond mere convenience. It fosters a more dynamic learning environment and enhances analytical capabilities across various disciplines.
Accuracy, Speed, and Efficiency
The most immediate benefits are unparalleled accuracy and speed. Manual graphing is prone to human error, from miscalculating points to imprecise plotting. Digital tools eliminate these errors, ensuring the graph is a faithful representation of the function. Furthermore, generating a complex graph that might take an hour manually can be done in seconds with a few keystrokes, freeing up valuable time for analysis and interpretation rather than laborious computation. This efficiency is critical in fast-paced professional environments and for students juggling multiple assignments.
Enhanced Understanding and Exploration
Perhaps the most profound benefit is the ability to interact with and explore functions in ways impossible with paper and pencil. The dynamic nature of digital graphs, particularly with features like sliders, allows users to instantly visualize how changing a single parameter alters the entire function. This interactive experimentation fosters a deeper, intuitive understanding of mathematical concepts, moving beyond rote memorization to genuine insight. It encourages “what-if” scenarios, enabling users to test hypotheses and observe consequences in real-time.
Collaboration and Presentation
Many online graphing platforms facilitate easy sharing and collaboration. Users can generate a graph and share a direct link, allowing others to view, manipulate, and even modify the same graph. This is invaluable for group projects, remote learning, or presenting findings to colleagues. The ability to quickly produce high-quality, professional-looking graphs for reports, presentations, or publications also significantly elevates the standard of visual communication in academic and professional settings. Clear, well-labeled digital graphs are far more impactful than hand-drawn sketches.
Future-Proofing Skills
Proficiency with digital graphing tools is a crucial skill in the modern world. As data visualization becomes increasingly central to almost every field, understanding how to leverage technology to represent and interpret mathematical relationships is not just an advantage—it’s a necessity. From machine learning engineers analyzing cost functions to financial analysts charting market trends, the principles of function graphing through technology remain constant and universally applicable. By developing these skills, individuals future-proof their analytical capabilities and prepare for roles that demand sophisticated data literacy.
The Future of Function Visualization
The evolution of function graphing tools is far from over. As technology continues to advance, we can anticipate even more sophisticated and immersive ways to visualize mathematical functions.
AI and Machine Learning Integration
Future graphing tools may incorporate more advanced AI and machine learning capabilities. Imagine a tool that not only graphs your function but also suggests optimal viewing windows based on critical points, automatically highlights interesting features (like inflection points or regions of rapid change), or even provides natural language explanations of the graph’s behavior. AI could also assist in identifying the function given a set of data points with greater precision and offering multiple potential models.
Interactive and Augmented Reality Graphing
The potential for augmented reality (AR) and virtual reality (VR) to transform function graphing is immense. Imagine projecting a 3D graph of a multivariable function into your physical space, allowing you to walk around it, explore its contours, and interact with it using gestures. Such immersive experiences could revolutionize how complex mathematical concepts are taught and understood, making abstract ideas tangible and intuitive. Interactive dashboards that update in real-time, pulling data from various sources and graphing functions on the fly, are also likely to become more commonplace.
Cloud-Based Collaborative Ecosystems
The trend towards cloud-based platforms will likely deepen, fostering even more seamless collaboration and integration with other digital tools. Graphing platforms could become integral components of larger scientific computing environments, allowing researchers to share not just graphs, but entire interactive mathematical models that update dynamically with new data or theoretical refinements. This integrated approach would streamline workflows and accelerate discovery across scientific and engineering disciplines.
In conclusion, graphing a function has transcended its traditional manual origins to become a powerful, technology-driven process. From user-friendly online calculators to advanced programming libraries, the tools available today empower users to visualize, analyze, and communicate mathematical relationships with unprecedented clarity and efficiency. Embracing these technologies not only simplifies the task but also unlocks deeper insights and prepares individuals for the analytical demands of the future.
aViewFromTheCave is a participant in the Amazon Services LLC Associates Program, an affiliate advertising program designed to provide a means for sites to earn advertising fees by advertising and linking to Amazon.com. Amazon, the Amazon logo, AmazonSupply, and the AmazonSupply logo are trademarks of Amazon.com, Inc. or its affiliates. As an Amazon Associate we earn affiliate commissions from qualifying purchases.