Understanding how to calculate the percentage increase between two numbers is a fundamental skill in personal finance, investing, and business management. It provides a clear, standardized way to measure growth, change, and performance over time, allowing for more insightful comparisons and informed decision-making. Whether you’re tracking your investment portfolio’s returns, evaluating a salary offer, or analyzing a business’s revenue growth, mastering this simple calculation is indispensable for effective financial literacy.
The Financial Significance of Percentage Increase
In the world of money, absolute numbers can often be misleading. A $100 increase in your savings account means something very different if your initial balance was $1,000 versus $10,000. Percentage increase provides context by expressing the change relative to the starting value. This relative measure allows for objective comparisons across different scales and timeframes, making it a cornerstone for financial analysis.
For individuals, percentage increase helps in:
- Evaluating Investment Performance: Understanding the percentage return on stocks, bonds, or mutual funds allows you to compare different investment opportunities and assess their effectiveness regardless of the initial capital invested.
- Budgeting and Expense Tracking: Monitoring percentage increases in living costs, utilities, or discretionary spending can highlight trends and inform adjustments to your budget, ensuring financial stability.
- Salary and Wage Negotiations: Knowing your percentage increase year-over-year helps you assess the real growth of your income and benchmark it against inflation or industry standards.
For businesses, it’s critical for:
- Revenue and Profit Growth: Tracking percentage increases in sales, gross profit, or net income reveals the company’s financial health and growth trajectory.
- Marketing Effectiveness: Measuring the percentage increase in customer acquisition, conversion rates, or average transaction value provides insights into the success of marketing campaigns.
- Cost Management: Analyzing percentage changes in operational expenses helps identify areas for optimization and efficiency improvements.
Without the ability to calculate and interpret percentage increases, financial analysis remains superficial, making it difficult to set meaningful goals or react strategically to market changes.
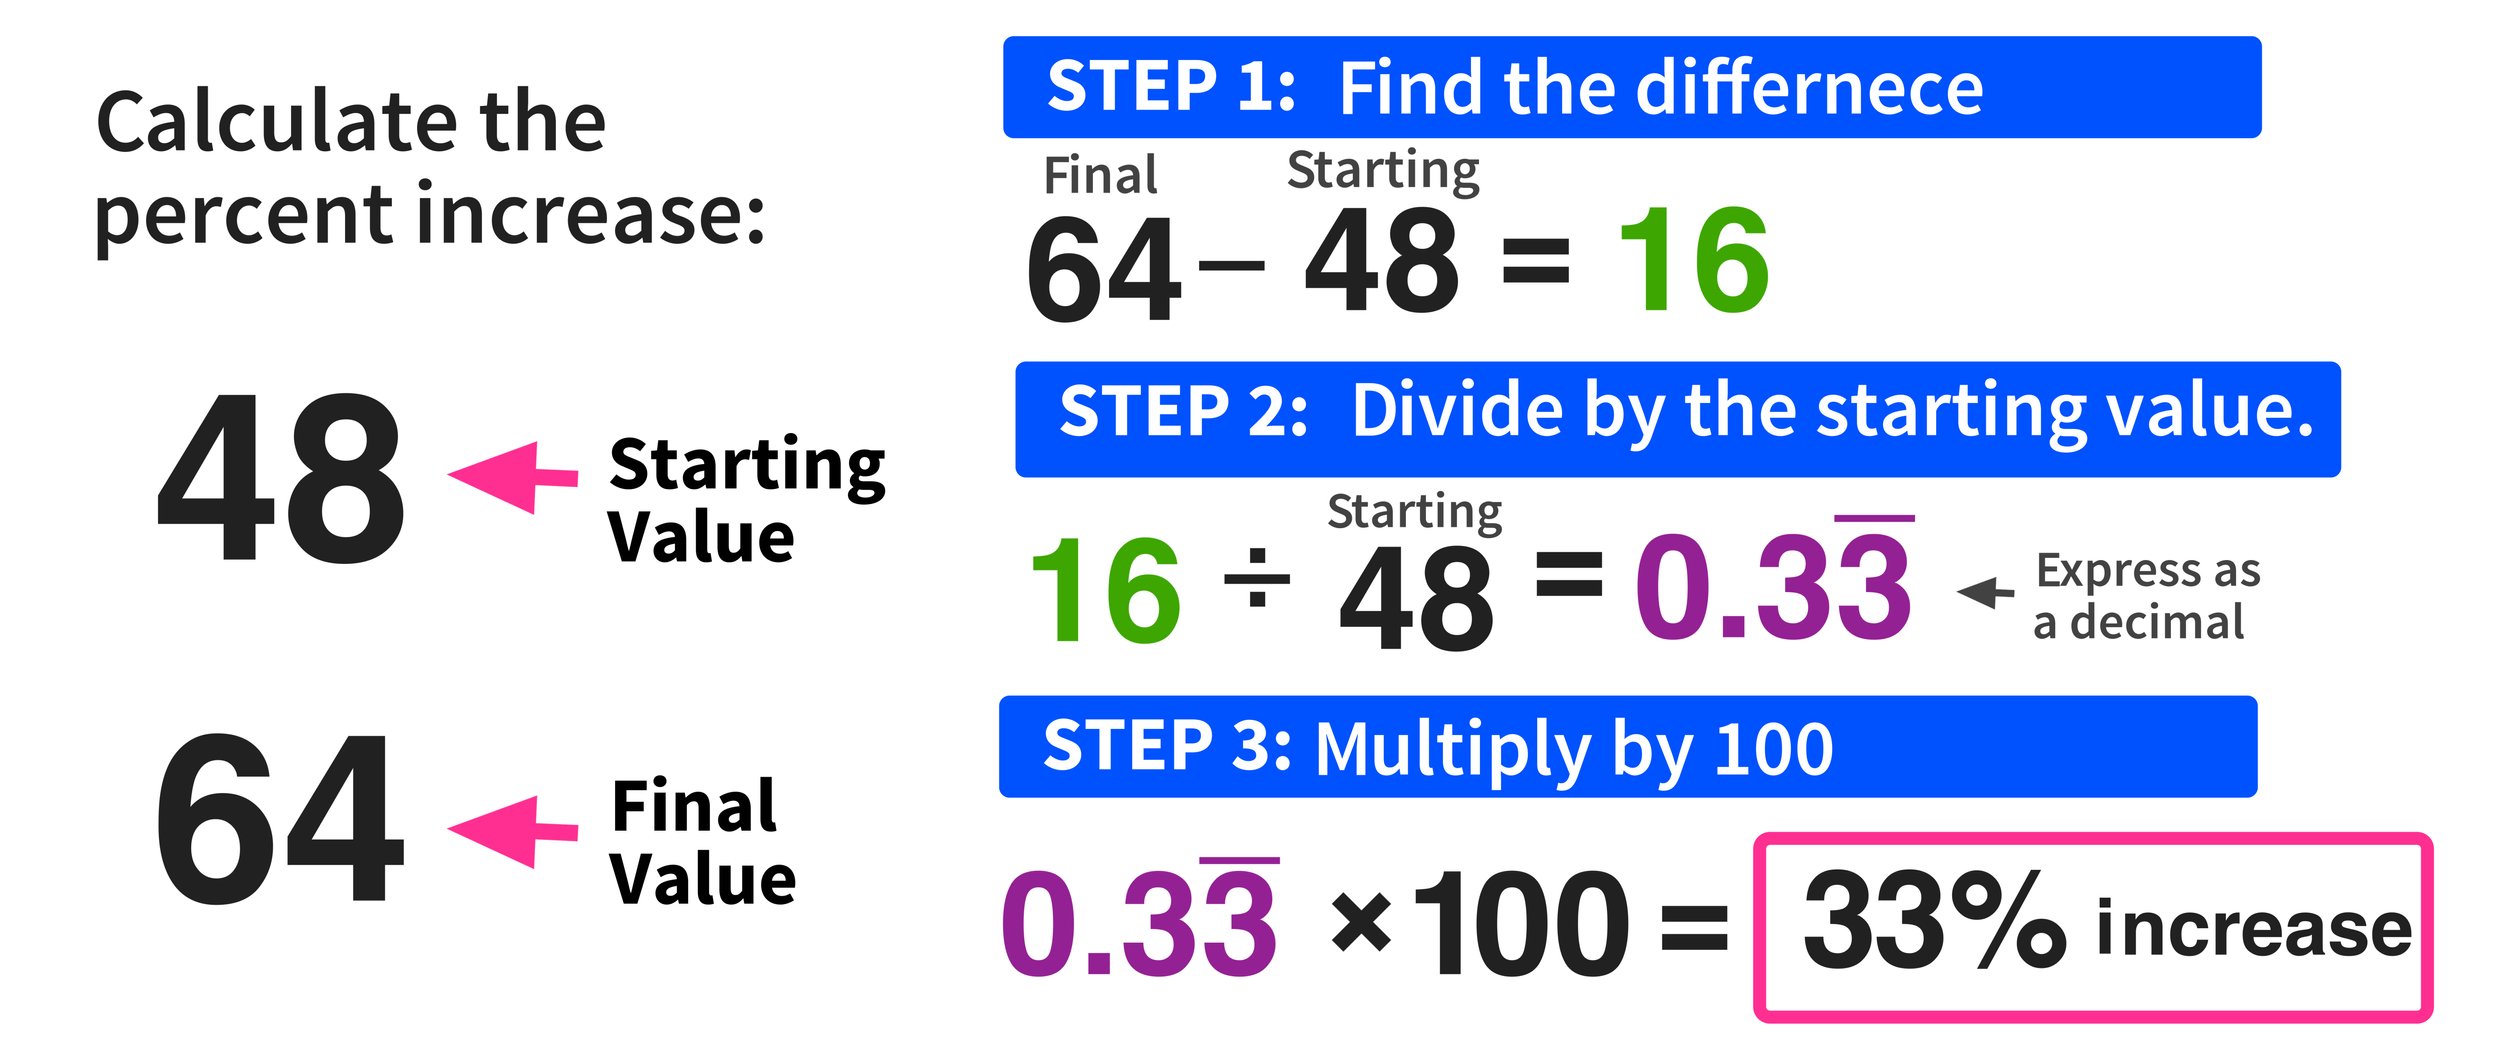
The Core Formula and Its Breakdown
Calculating percentage increase is straightforward. It involves three key steps: finding the absolute difference between the two numbers, dividing that difference by the original number, and then multiplying the result by 100 to express it as a percentage.
The formula is as follows:
$$ text{Percentage Increase} = left( frac{text{New Value} – text{Original Value}}{text{Original Value}} right) times 100 $$
Let’s break down each component:
- Original Value: This is the starting point, the baseline number from which the change is being measured. In financial terms, it could be your initial investment, last year’s revenue, or your previous salary.
- New Value: This is the ending point, the number after the change has occurred. It might be your current investment value, this year’s revenue, or your updated salary.
- Difference ($text{New Value} – text{Original Value}$): This first step calculates the absolute amount of increase. If the New Value is greater than the Original Value, this difference will be positive, indicating an increase. If the New Value is less, the result would be negative, indicating a decrease (which would then be a percentage decrease calculation).
- Dividing by Original Value: By dividing the absolute difference by the Original Value, you determine the change as a proportion or ratio relative to the starting point. This fractional value represents the “growth factor.”
- Multiplying by 100: This final step converts the decimal or fractional growth factor into a percentage, making it easier to read and compare.
It’s crucial to always divide by the original value. Dividing by the new value or an average of the two numbers would lead to an incorrect result and misrepresent the actual growth from the starting point.
Practical Financial Applications and Examples
Understanding the formula is one thing; applying it to real-world financial scenarios is where its true value lies. Here are several examples demonstrating its use in personal and business finance.
Investment Growth
Imagine you invested $5,000 in a particular stock. After one year, the value of your investment grew to $5,750. You want to know the percentage return on your investment.
- Original Value = $5,000
- New Value = $5,750
First, calculate the absolute increase:
Increase = $5,750 – $5,000 = $750
Next, divide by the original value:
Ratio = $750 / $5,000 = 0.15
Finally, multiply by 100 to get the percentage:
Percentage Increase = 0.15 × 100 = 15%
Your investment saw a 15% increase. This metric allows you to compare this performance with other investment opportunities or market benchmarks.
Salary Increases and Budgeting
Suppose your annual salary last year was $60,000, and this year, after a performance review, it has increased to $63,000. You want to know the percentage raise you received.
- Original Value = $60,000
- New Value = $63,000
Absolute Increase = $63,000 – $60,000 = $3,000
Percentage Increase = ($3,000 / $60,000) × 100
Percentage Increase = 0.05 × 100 = 5%
You received a 5% raise. Knowing this helps you assess if your income growth is keeping pace with inflation or your rising cost of living. Similarly, if your monthly utility bill increased from $120 to $135, you’d calculate a (135-120)/120 * 100 = 12.5% increase, signaling a need to adjust your budget or investigate the cause.
Business Revenue and Profit Analysis
A small business reported revenues of $250,000 last fiscal year. This year, aggressive marketing and new product lines boosted revenues to $312,500. The owner wants to calculate the percentage growth in revenue.
- Original Value = $250,000
- New Value = $312,500
Absolute Increase = $312,500 – $250,000 = $62,500
Percentage Increase = ($62,500 / $250,000) × 100
Percentage Increase = 0.25 × 100 = 25%
The business achieved a impressive 25% revenue growth. This figure is crucial for investor relations, internal goal setting, and strategic planning. Businesses also use this for profit margins. If net profit went from $50,000 to $65,000, that’s a (65,000-50,000)/50,000 * 100 = 30% increase in profitability.
Beyond the Basics: Related Financial Concepts and Tools
While the basic percentage increase formula is powerful, financial analysis often requires looking at growth over multiple periods or in specific contexts.
Annualized Growth Rate
When dealing with growth over periods shorter or longer than a year, financial analysts often “annualize” the growth rate to make it comparable to annual benchmarks. If an investment grew by 3% in a single quarter, the simplified annualized growth rate might be 3% x 4 quarters = 12% (though more complex compounding formulas exist). This allows for apples-to-apples comparisons of performance across different timeframes.
Compound Annual Growth Rate (CAGR)
For investments or businesses that grow over several years, the Compound Annual Growth Rate (CAGR) provides a smoothed, annualized rate of return, assuming profits are reinvested. It’s particularly useful for understanding the average growth rate of an investment over a specified period longer than one year, even if there were fluctuations year-to-year. The formula for CAGR is:
$$ text{CAGR} = left[ left( frac{text{Ending Value}}{text{Beginning Value}} right)^{frac{1}{text{Number of Years}}} – 1 right] times 100 $$
This allows investors to compare the performance of different assets over different holding periods accurately.
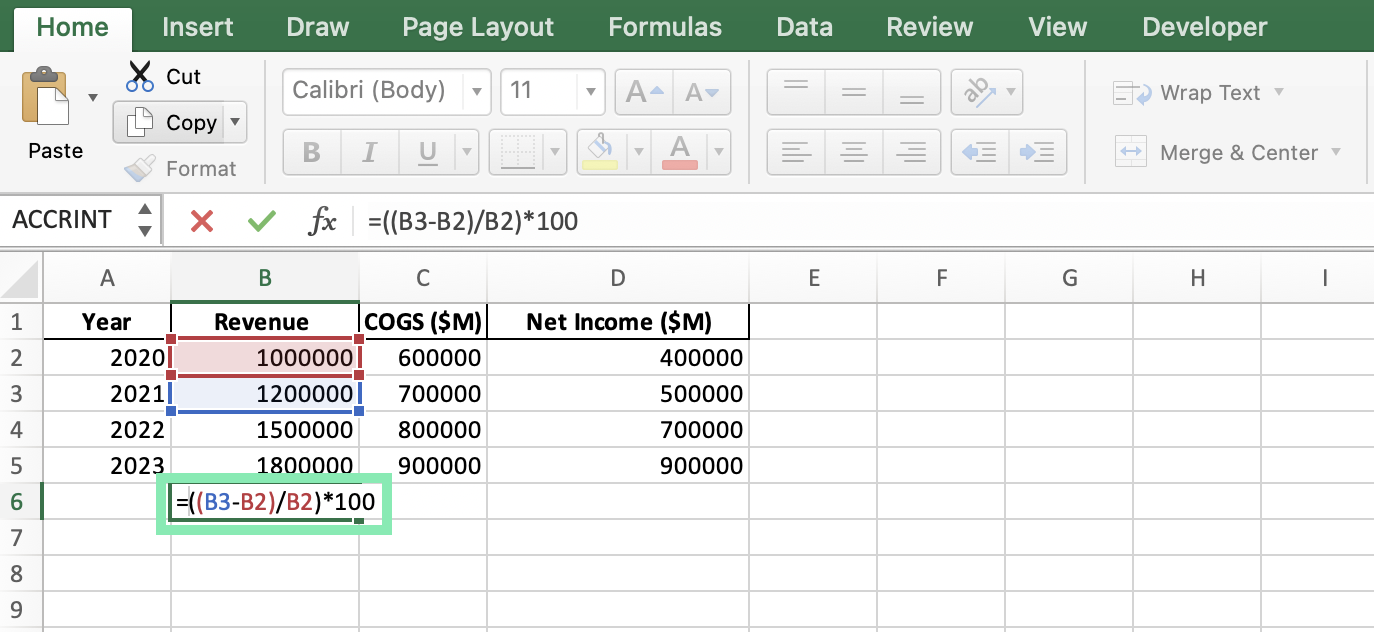
Using Spreadsheets and Financial Software
For more complex calculations or when dealing with large datasets, leveraging tools like Microsoft Excel, Google Sheets, or specialized financial software is highly efficient. These programs have built-in functions that can automate percentage calculations.
In Excel or Google Sheets, you can simply:
- Enter your Original Value in cell A1.
- Enter your New Value in cell B1.
- In cell C1, type the formula:
=(B1-A1)/A1 - Format cell C1 as a percentage to display the result correctly.
For example, if A1 is 5000 and B1 is 5750, the formula =(B1-A1)/A1 will yield 0.15. Formatting this cell as a percentage will display 15.00%. This eliminates manual errors and speeds up analysis, especially when tracking many financial metrics.

Common Pitfalls and Considerations
While calculating percentage increase is straightforward, there are a few common mistakes and considerations to keep in mind to ensure accuracy and proper interpretation:
- Incorrect Original Value: Always ensure you are dividing by the initial or starting value. Using the ending value, or an average, will yield an incorrect result. This is the most common error.
- Negative Original Values: The percentage increase formula doesn’t work intuitively with negative original values. For instance, calculating the percentage increase from -$100 to -$50 is problematic because it implies a “decrease” in debt, but the mathematical outcome can be confusing. In such cases, it’s often better to discuss the absolute change or reframe the problem (e.g., “debt reduced by 50%”).
- Small Original Values: When the original value is very small, even a small absolute increase can result in a very large, sometimes misleading, percentage increase. For example, going from $1 to $10 is a 900% increase, which sounds dramatic, but the absolute change is only $9. Context is always key.
- Inflation: A nominal percentage increase (e.g., a 5% salary raise) might feel substantial, but its real value can be eroded by inflation. If inflation was 3%, your “real” percentage increase in purchasing power was only 2% (approximately). Financial decisions should often consider inflation-adjusted figures.
- Timeframes: Always be explicit about the timeframe over which the percentage increase is measured (e.g., daily, monthly, quarterly, annually, over five years). A 10% increase over a month is far more significant than a 10% increase over a year.
By being mindful of these considerations, you can ensure that your percentage increase calculations are not only mathematically correct but also financially meaningful and accurately interpreted. Mastering this simple yet powerful tool empowers you to make smarter financial decisions, track progress effectively, and gain a deeper understanding of the dynamics of your money.
aViewFromTheCave is a participant in the Amazon Services LLC Associates Program, an affiliate advertising program designed to provide a means for sites to earn advertising fees by advertising and linking to Amazon.com. Amazon, the Amazon logo, AmazonSupply, and the AmazonSupply logo are trademarks of Amazon.com, Inc. or its affiliates. As an Amazon Associate we earn affiliate commissions from qualifying purchases.