
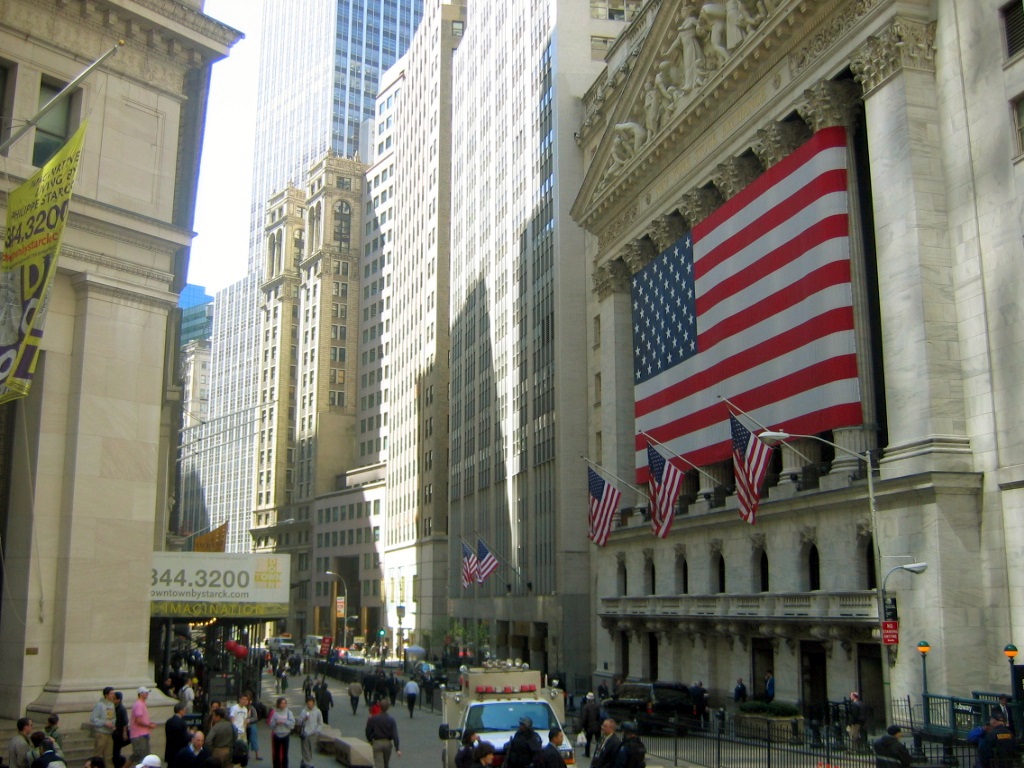
The question “how did Wall Street do today?” is a daily ritual for millions of investors, ranging from casual retail participants to high-frequency institutional traders. While the answer is often distilled into a simple number—a percentage gain or loss for a major index—the reality behind those figures is a complex tapestry of economic data, corporate earnings, geopolitical shifts, and psychological triggers. Understanding a day’s performance requires looking past the surface-level green and red tickers to identify the underlying drivers that dictate the flow of capital across the global financial landscape.
Decoding the Performance of Major Market Indices
When we evaluate how Wall Street performed, we are usually looking at the three primary benchmarks: the S&P 500, the Dow Jones Industrial Average, and the Nasdaq Composite. Each provides a different lens through which to view the health of the American economy and the appetite for risk.
The S&P 500: The Standard-Bearer
The S&P 500 is arguably the most important metric for general market health. Comprising 500 of the largest publicly traded companies in the United States, it represents approximately 80% of the total market capitalization of the U.S. stock market. Because it is market-cap weighted, a day where the “Magnificent Seven” (the largest tech giants) perform well can push the entire index higher, even if the majority of the other 493 stocks are stagnant. When the S&P 500 moves significantly, it signals a broad shift in institutional sentiment.
The Dow Jones Industrial Average: A Legacy Metric
The Dow consists of only 30 “blue-chip” companies. Unlike the S&P 500, it is price-weighted, meaning stocks with a higher share price have a greater influence on the index’s movement regardless of their total company size. While some modern analysts find it less comprehensive, it remains a vital indicator of “old economy” health—industrial, financial, and consumer stable giants that reflect the steady-state pulse of American commerce.
The Nasdaq Composite: The Growth Engine
The Nasdaq is heavily weighted toward technology and growth-oriented sectors. It serves as the primary barometer for investor optimism regarding innovation and future earnings potential. On days when interest rate expectations fall, the Nasdaq often outperforms, as lower rates increase the present value of future cash flows, which is the cornerstone of growth stock valuation. Conversely, when the Nasdaq lags, it often suggests a “risk-off” environment where investors are seeking safety in more traditional assets.
The Influence of Macroeconomic Data and the Federal Reserve
A day on Wall Street rarely happens in a vacuum. The movement of stocks is frequently a reaction to macroeconomic “catalysts”—scheduled data releases that provide clues about the trajectory of the economy.
Inflation and the Consumer Price Index (CPI)
In the current economic climate, inflation remains the most scrutinized variable. When CPI data is released, it can cause immediate and violent swings in stock prices. If inflation comes in “hotter” (higher) than expected, Wall Street typically reacts negatively. This is because higher inflation signals that the Federal Reserve may need to keep interest rates elevated for longer to cool the economy. For an investor, higher rates mean higher borrowing costs for companies and a more attractive yield on bonds, which can pull money out of the stock market.
The Role of the Federal Open Market Committee (FOMC)
The Federal Reserve, led by its chair, is the most powerful entity in the financial markets. Investors hang on every word of the FOMC policy statements. A “hawkish” stance (signaling rate hikes or a tightening of the money supply) usually causes a market retreat. A “dovish” stance (signaling rate cuts or a pause) often sparks a rally. Understanding today’s market movement often requires looking at the “Fed funds futures” to see how traders are betting on the next interest rate move.
Employment Reports and GDP
The strength of the American consumer is the backbone of the stock market. Non-farm payroll data and unemployment rates tell Wall Street if the economy is expanding or contracting. Interestingly, Wall Street sometimes views “bad news as good news.” If employment data is slightly weak, investors might bet that the Fed will lower interest rates to stimulate the economy, causing stocks to rise despite the poor economic signal.
Analyzing Sector Rotation and Breadth

To truly understand how Wall Street did today, one must look under the hood at sector performance. The market is divided into eleven sectors, including Technology, Healthcare, Energy, Financials, and Utilities.
Defensive vs. Cyclical Posturing
On a day when the market is “flat,” there may be intense activity beneath the surface. If defensive sectors like Utilities and Consumer Staples are rising while Tech and Consumer Discretionary are falling, it indicates that investors are “rotating” into safety. This is a defensive posture, suggesting a lack of confidence in near-term growth. On the other hand, a rally led by Industrials and Materials suggests a “cyclical” upswing, where investors are betting on a robust physical economy.
The Impact of Interest-Sensitive Sectors
Financials (banks and insurance companies) and Real Estate are highly sensitive to the bond market. If the “yield curve” shifts—the difference between short-term and long-term interest rates—these sectors will react immediately. Banks generally prefer a steeper yield curve where they can borrow cheap and lend at higher rates, while Real Estate (REITs) typically suffers when rates rise due to the increased cost of financing property acquisitions.
Market Breadth: The Advance-Decline Line
Sometimes the indices are up, but the “breadth” is poor. This happens when a few massive companies drive the index higher while the majority of individual stocks are actually declining. Analysts use the Advance-Decline (A/D) line to see if a rally is participation-heavy or top-heavy. A healthy day on Wall Street is one where the majority of stocks participate in the gains, indicating a stable and broad-based consensus among buyers.
Beyond the Ticker: Bonds, Yields, and the VIX
The stock market is only one part of the Wall Street ecosystem. To understand why stocks moved a certain way, one must often look at the fixed-income and volatility markets.
The Treasury Yield Curve
The 10-year Treasury note is the benchmark for global borrowing. When the 10-year yield rises rapidly, it often puts downward pressure on stocks. Why? Because a higher yield on a “risk-free” government bond makes the risky prospect of owning stocks less attractive. Today’s equity performance is often just a mirror image of the movement in the bond market.
The VIX and Volatility
Known as the “fear gauge,” the CBOE Volatility Index (VIX) measures the market’s expectation of 30-day forward volatility based on S&P 500 index options. If the VIX is spiking, it means investors are buying “insurance” (put options) against a market crash. A rising VIX usually correlates with falling stock prices. Understanding “how Wall Street did” requires checking if the day was orderly or if it was characterized by panic, which the VIX quantifies.
Strategy and Mindset for the Modern Investor
For the individual investor, the daily fluctuations of Wall Street can be a source of significant anxiety or unwarranted exuberance. However, the most successful market participants use daily data not as a reason to trade, but as a series of data points to inform a long-term strategy.
Resisting the Urge of Market Timing
While it is tempting to try and “beat” the market based on today’s news, empirical evidence suggests that time in the market is far more important than timing the market. Missing just a few of the market’s best days—which often occur immediately after the worst days—can drastically reduce long-term returns. Understanding the daily “why” helps an investor stay calm, recognizing that volatility is the price of admission for long-term equity returns.
The Power of Perspective
A “bad day” on Wall Street might be a 1% or 2% drop, which feels significant in the moment. However, when viewed on a five-year or ten-year chart, these daily blips become almost invisible. Professional investors use down days to “rebalance”—selling assets that have performed well to buy those that are temporarily undervalued.
Wall Street’s daily performance is a reflection of the collective intelligence (and sometimes the collective emotion) of millions of participants. By analyzing the indices, the macroeconomic catalysts, the sector rotations, and the bond market, we gain a clearer picture of the financial world’s direction. Whether the day ended in green or red, the most important takeaway is what the movement says about the broader economic cycle and how that aligns with your personal financial goals. Staying informed allows an investor to transition from a passive observer of the numbers to a strategic manager of their own financial future.
aViewFromTheCave is a participant in the Amazon Services LLC Associates Program, an affiliate advertising program designed to provide a means for sites to earn advertising fees by advertising and linking to Amazon.com. Amazon, the Amazon logo, AmazonSupply, and the AmazonSupply logo are trademarks of Amazon.com, Inc. or its affiliates. As an Amazon Associate we earn affiliate commissions from qualifying purchases.