
For the modern investor, the question “how did the market close today?” is more than a simple inquiry into numerical data; it is a vital ritual in the management of personal wealth and institutional strategy. The closing bell of the New York Stock Exchange (NYSE) and the Nasdaq at 4:00 PM Eastern Time signals the end of a high-stakes daily narrative. Whether the indices finished in the green or the red, the closing figures provide a snapshot of global sentiment, economic health, and the collective expectations of millions of participants.
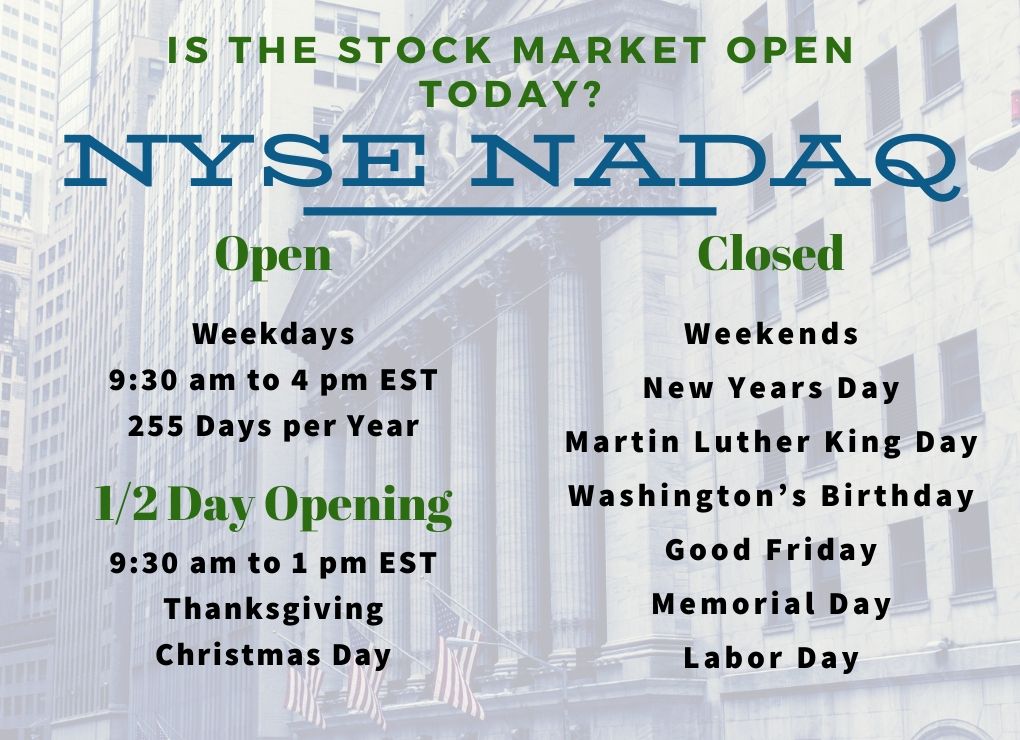
Understanding the closing results requires looking past the surface-level percentages. It involves analyzing the interplay between various sectors, interpreting the influence of macroeconomic indicators, and distinguishing between short-term volatility and long-term trends. This guide explores the mechanics of the market close, the significance of major indices, and how investors can use daily data to make informed financial decisions.
The Anatomy of the Closing Bell: Why the Final Price Matters
The final minutes of the trading day are often the most liquid and volatile. This period, frequently referred to as “the close,” is when institutional investors, mutual funds, and pension funds execute large-scale trades to align with their end-of-day valuation requirements.
The Mechanics of the Closing Auction
Unlike the continuous trading that happens throughout the day, the market close is often determined by a “closing auction.” This process aggregates all buy and sell orders to find a single price that clears the maximum volume of shares. For an investor, the closing price is the official “mark-to-market” value used to calculate the net asset value (NAV) of mutual funds and the performance of individual portfolios. It is the most reliable data point of the day because it represents the final consensus on a security’s value after all available information has been processed.
Volatility and the “Power Hour”
The final hour of trading, from 3:00 PM to 4:00 PM ET, is colloquially known as the “Power Hour.” During this time, trading volume spikes as day traders close out their positions and institutional “smart money” makes its final moves. High volume at the close can indicate strong conviction. For instance, if the market closes at its daily high on heavy volume, it suggests bullish momentum that may carry into the following session. Conversely, a “sell-off at the close” often signals that investors are nervous about holding positions overnight.
Deciphering the Major Indices: What the Numbers Actually Mean
When people ask how the market performed, they are usually referring to the “big three” indices. Each of these represents a different slice of the economy, and their closing prices tell different stories.
The S&P 500: The Institutional Benchmark
The Standard & Poor’s 500 is widely regarded as the best single gauge of large-cap U.S. equities. Because it is market-capitalization-weighted, the performance of the S&P 500 reflects the health of the largest corporations in the world. When the S&P 500 closes higher, it generally indicates a broad appetite for risk across the traditional economy. For the average personal investor, this index is the most critical to watch, as most 400(k) plans and index funds are anchored to its performance.
The Nasdaq Composite: The Growth and Innovation Engine
The Nasdaq is heavily weighted toward technology, biotechnology, and growth-oriented companies. If the Nasdaq outperforms the other indices, it typically means investors are optimistic about future earnings and are willing to pay a premium for innovation. However, the Nasdaq is also more sensitive to interest rate changes. A sharp decline in the Nasdaq at the close often suggests that rising bond yields are making high-growth stocks less attractive.
The Dow Jones Industrial Average: The Blue-Chip Pulse
The Dow is a price-weighted index of 30 prominent companies. While it is less diverse than the S&P 500, it provides a look at the “Old Economy”—industrial giants, major banks, and massive consumer staples. A strong close for the Dow while the Nasdaq lags often indicates a “rotation” in the market, where investors move money out of risky tech stocks and into stable, dividend-paying companies.
Macroeconomic Factors Influencing Today’s Results
The closing numbers do not exist in a vacuum. Every daily fluctuation is a reaction to specific catalysts, ranging from central bank policy to corporate earnings.
The Influence of Federal Reserve Policy
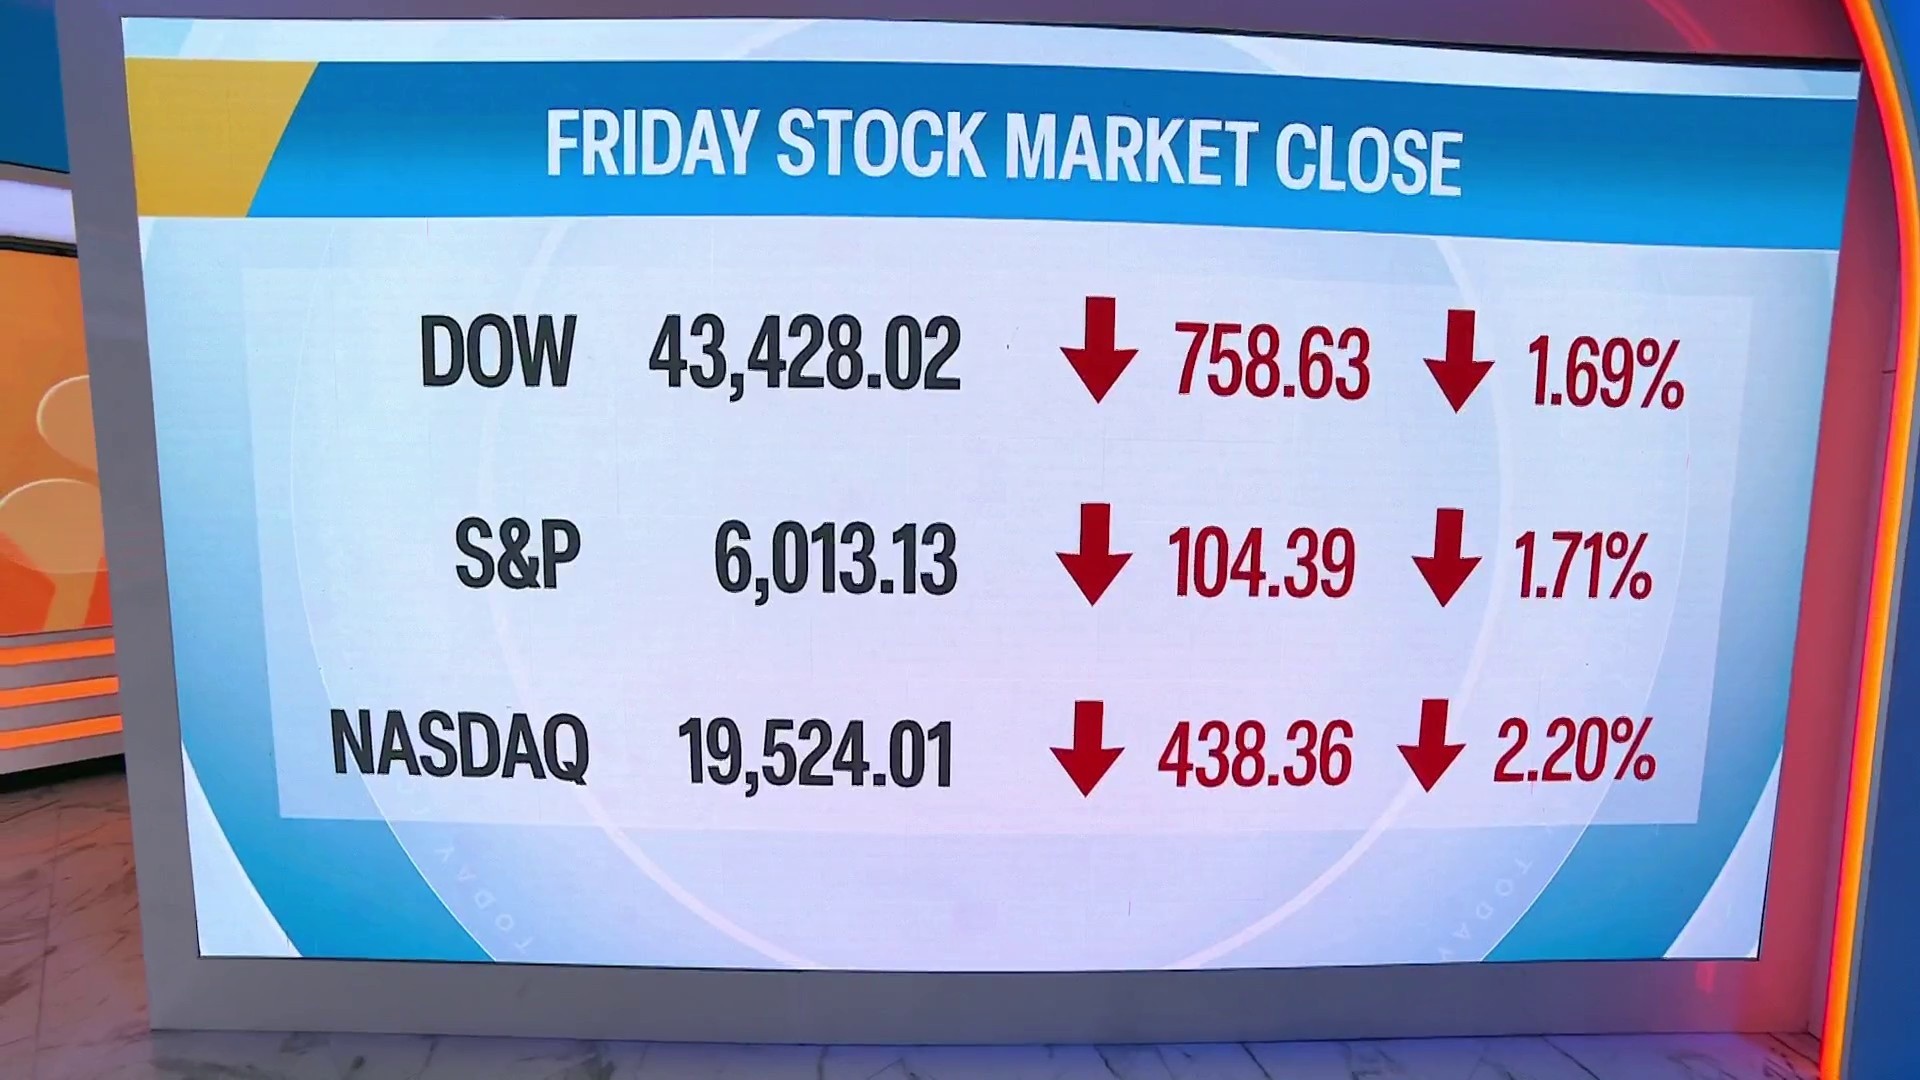
In the current financial landscape, no factor weighs heavier on the market than the Federal Reserve’s stance on interest rates. When the market closes lower today, it is often because of “hawkish” signals—indications that the Fed might raise rates or keep them elevated to fight inflation. High rates increase borrowing costs for businesses and consumers, which can dampen corporate profits. Investors scan the daily close to see if the market is “pricing in” these future economic conditions.
Corporate Earnings and Forward Guidance
During earnings season, the market’s close is dictated by the quarterly reports of influential companies. A company might report record profits, but if their “forward guidance” (their outlook for the next few months) is weak, their stock—and potentially their entire sector—will drag the market down at the close. Observing which sectors led the gains or losses helps an investor identify where the fundamental strength lies in the current economy.
Geopolitical Events and Bond Yields
The bond market often leads the stock market. The yield on the 10-year Treasury note is a crucial indicator; when yields spike, stocks often retreat. Furthermore, geopolitical tensions or unexpected economic data (like jobs reports or CPI inflation data) can cause “gap downs” or “gap ups” where the market opens significantly lower or higher than it closed the previous day.
Beyond the Bell: After-Hours Trading and Futures
The 4:00 PM close is not actually the end of the story. The financial world is now a 24-hour operation, and what happens after the bell can be just as significant as the day’s regular session.
Understanding After-Hours Volatility
After-hours trading occurs from 4:00 PM to 8:00 PM ET. This market is characterized by much lower volume and higher spreads, meaning prices can swing wildly. Many companies release their earnings reports precisely at 4:01 PM to avoid the volatility of the regular session. An investor who sees a positive close at 4:00 PM might be surprised to see the stock drop 10% by 4:15 PM due to an earnings miss. Monitoring this “post-market” activity provides a head start on understanding how the market will open the next day.
The Role of Futures Markets
Stock futures (such as S&P 500 E-minis) trade almost around the clock. If you wake up before the market opens and want to know “how the market is doing,” the futures market provides a roadmap. If futures are “pointing to a lower open,” it means international markets (like London or Tokyo) have reacted to news overnight that will likely depress U.S. prices when the opening bell rings at 9:30 AM.
Building a Disciplined Routine for Market Monitoring
For those focused on long-term wealth creation, the daily close should be viewed as a single data point in a much larger trend. Developing a professional approach to daily financial news helps prevent emotional decision-making.
Filtering the Noise
The financial media often uses hyperbolic language—words like “rout,” “surge,” or “collapse”—to describe daily movements of 1% or 2%. Part of a successful “Money” strategy is learning to filter this noise. A 1% drop in the S&P 500 today might be significant in the context of a week, but in the context of a decade, it is often irrelevant. Investors should focus on why the market closed the way it did rather than just the percentage change.
Identifying Patterns for Side Hustles and Active Trading
For those involved in active trading or seeking online income through stock options and swing trading, the daily close is a source of technical data. Traders look at “closing levels” to see if an index stayed above a “support” level or broke through a “resistance” level. Successfully identifying these patterns can lead to profitable short-term strategies, provided the investor has a robust risk management framework in place.

Conclusion: The Strategic Value of the Daily Wrap-Up
Asking “how did the market close today?” is the first step toward high-level financial literacy. It is a question that connects the individual investor to the pulse of the global economy. By understanding the mechanics of the closing auction, the weight of the major indices, and the macroeconomic forces at play, you can move from being a passive observer to an informed strategist.
Whether you are managing a personal retirement account, looking for the next big investment opportunity, or simply trying to understand the business world, the daily market close offers an education in real-time. The key is to maintain a balance: stay informed enough to understand the risks and opportunities, but remain disciplined enough not to let daily fluctuations derail your long-term financial goals. Tomorrow, the bell will ring again, and the cycle of price discovery will continue, offering new data and new opportunities for the prepared investor.
aViewFromTheCave is a participant in the Amazon Services LLC Associates Program, an affiliate advertising program designed to provide a means for sites to earn advertising fees by advertising and linking to Amazon.com. Amazon, the Amazon logo, AmazonSupply, and the AmazonSupply logo are trademarks of Amazon.com, Inc. or its affiliates. As an Amazon Associate we earn affiliate commissions from qualifying purchases.