
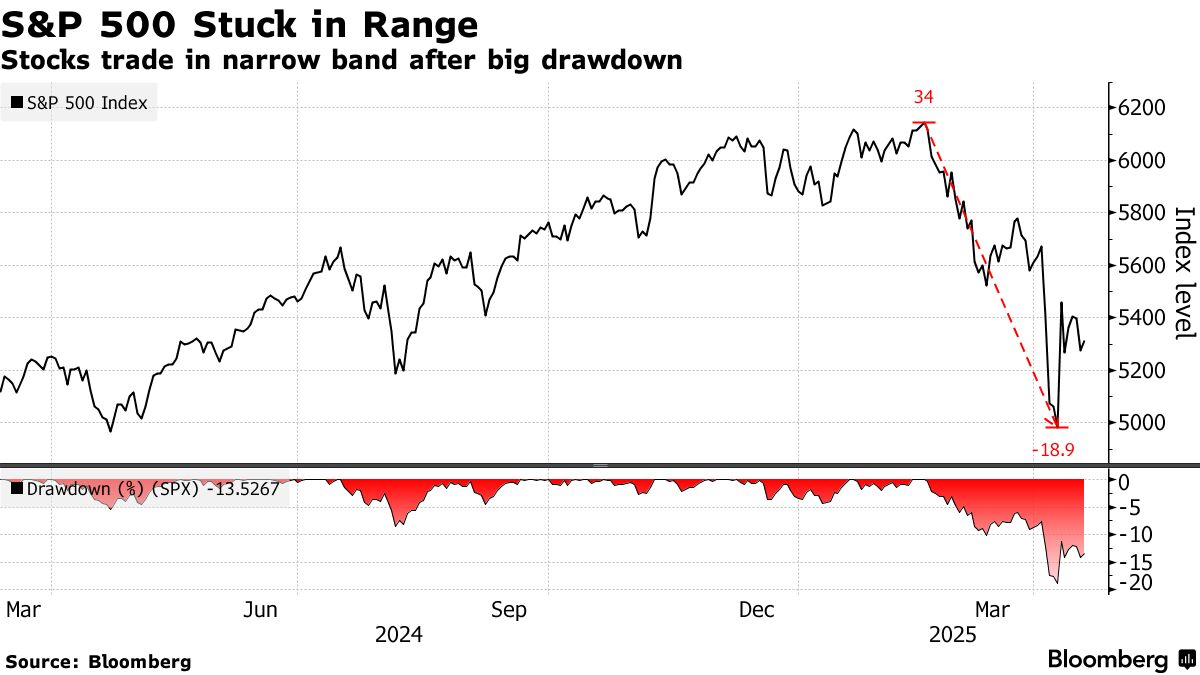
For the modern investor, the question “how did the stock market do today?” is more than a casual inquiry; it is a ritualistic check-in on the health of the global economy and one’s personal financial future. Whether the closing bell rings to the sound of a record-breaking rally or a sharp sell-off, the daily movement of the markets provides a snapshot of collective human sentiment, economic data, and corporate performance.
However, understanding the daily performance of the stock market requires looking beyond the simple green or red numbers on a smartphone screen. To truly grasp what happened today, an investor must be able to decode the major indices, identify the catalysts behind the volatility, and contextualize those movements within a long-term financial strategy.
Decoding the Closing Bell: Understanding Market Indicators
When people ask how the market performed, they are usually referring to the performance of a few key indices. These indices serve as barometers for different segments of the economy. Understanding the nuance between them is the first step in moving from a casual observer to an informed investor.
The Big Three: S&P 500, Dow Jones, and Nasdaq
The S&P 500 is widely considered the most accurate reflection of the U.S. stock market. Comprising 500 of the largest publicly traded companies, it is market-cap weighted, meaning larger companies like Microsoft or Amazon have a greater impact on its movement. If the S&P 500 is up, it generally signifies broad strength across the American corporate landscape.
The Dow Jones Industrial Average (DJIA), by contrast, is a price-weighted index of 30 “blue-chip” companies. While it is the most cited index in mainstream media, many professional investors view it as less representative because it ignores the relative size of companies and focuses only on a small handful of legacy giants. Finally, the Nasdaq Composite is heavily skewed toward the technology and growth sectors. On days when “the market” is down but the Nasdaq is up, it often indicates that investors are favoring high-growth tech stocks over traditional industrial or value stocks.
Market Breadth and Sector Performance
A single number rarely tells the whole story. To understand how the market actually did today, savvy investors look at “market breadth.” This refers to how many individual stocks participated in the move. If the S&P 500 rose by 1%, but only five massive tech stocks were responsible for that gain while the other 495 stocks fell, the market is “thin” and potentially fragile.
Furthermore, performance is often segmented into eleven different sectors, such as Energy, Healthcare, and Consumer Staples. If the market was down today because the Energy sector collapsed due to falling oil prices, but the Healthcare sector remained stable, an investor with a diversified portfolio might find their personal balance largely unaffected despite the scary headlines.
The Drivers of Daily Volatility: Why Prices Moved
Stock prices do not move in a vacuum. Every “tick” in price represents the digestion of new information. When the market moves significantly in a single day, it is usually responding to one of three primary catalysts: economic data, corporate earnings, or geopolitical shifts.
Economic Data Releases and Interest Rates
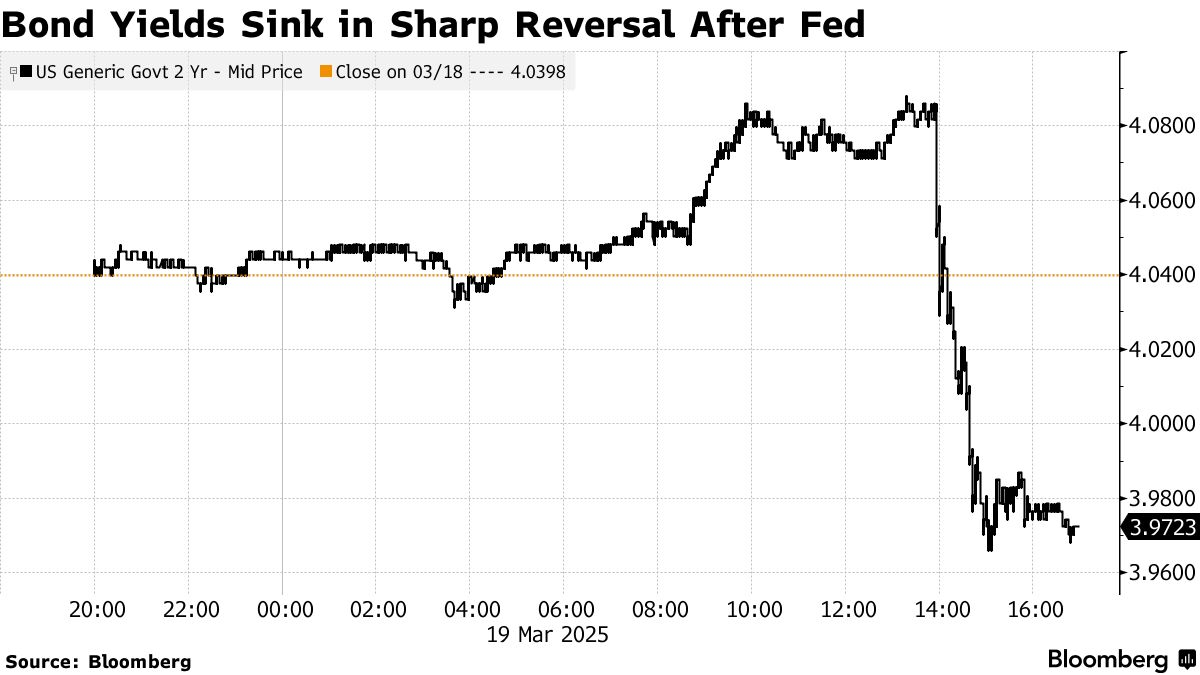
In the current financial climate, the Federal Reserve is often the primary driver of daily market action. Investors keep a microscopic watch on the Consumer Price Index (CPI) and other inflation gauges. If a report shows that inflation is cooling faster than expected, the market often rallies on the hope that interest rates will be cut. Conversely, a “hot” inflation report can send markets into a tailspin.
Labor market data, such as the monthly Non-Farm Payrolls report, also dictates the market’s mood. A strong jobs market is generally good for the economy but can paradoxically cause stocks to fall if investors fear it will force the central bank to keep interest rates high to prevent overheating.
Corporate Earnings and Forward Guidance
During “earnings season”—the weeks following the end of each fiscal quarter—the market’s performance is driven by the internal health of companies. When a titan like Apple or Nvidia reports its quarterly results, the impact can be felt across the entire index.
However, the market is a forward-looking mechanism. It is common to see a company report record-breaking profits only for its stock price to tumble. This happens because the “forward guidance”—the company’s prediction of future performance—failed to meet analyst expectations. Today’s market performance is often less about what happened in the past and more about what investors believe will happen in the next six months.
Geopolitical Events and Sentiment
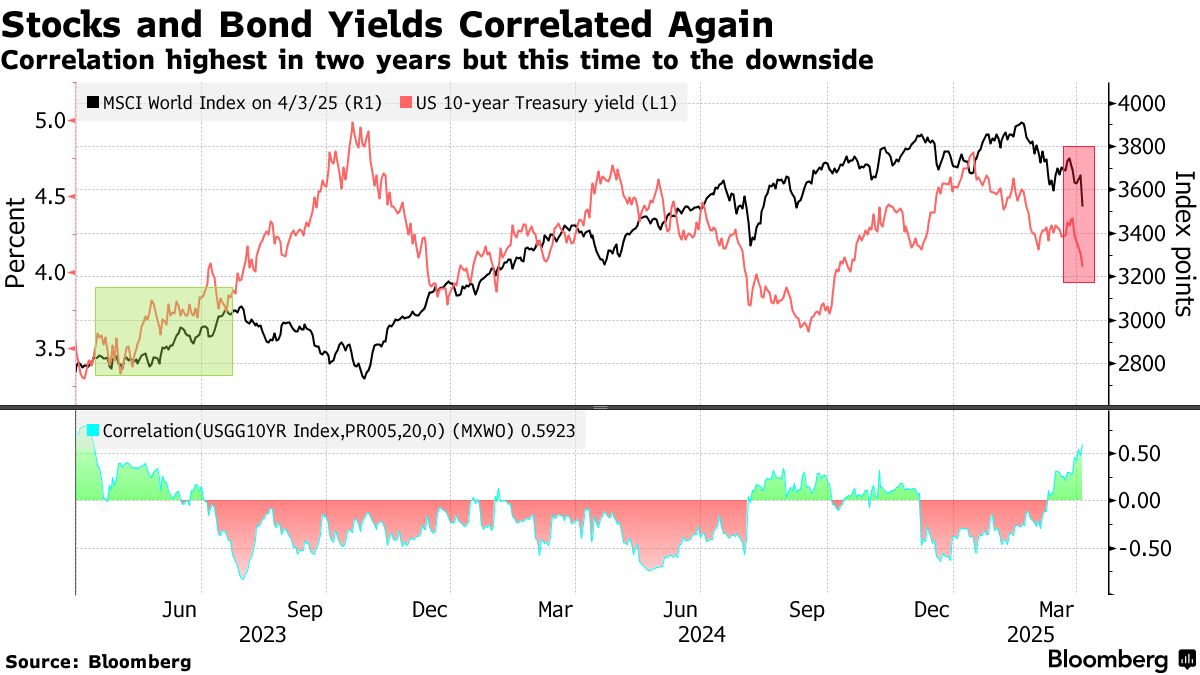
Sometimes, the market moves based on “headline risk.” This includes everything from domestic political shifts and election cycles to international conflicts or trade disputes. These events create uncertainty, and the market notoriously hates uncertainty. On days of high geopolitical tension, we often see a “flight to safety,” where investors sell stocks and move money into “safe-haven” assets like gold or U.S. Treasury bonds.
Tools for Tracking Real-Time Performance
To answer “how did the stock market do today” with precision, investors need access to reliable data. In the digital age, there is no shortage of financial tools, but the quality of insight varies significantly between platforms.
Top Financial Platforms for Retail Investors
For the average investor, platforms like Yahoo Finance, Bloomberg, and CNBC provide real-time updates and breaking news. These sites are excellent for a quick glance at the major indices. For those looking for deeper analysis, Morningstar and Seeking Alpha offer qualitative research that explains the why behind the numbers.
Mobile apps have democratized this data, allowing individuals to set alerts for specific price movements. However, there is a psychological cost to this accessibility. Being alerted to every 0.5% drop can trigger emotional responses that lead to poor financial decision-making.
Interpreting Technical Charts and Heatmaps
Professional traders often use “heatmaps” to visualize today’s market. A heatmap represents sectors and individual companies as blocks of color—usually green for gains and red for losses—where the size of the block corresponds to the company’s market capitalization. This allows an investor to see at a glance whether the “red” is concentrated in one area (like Financials) or spread across the entire economy.
Additionally, looking at “volume”—the number of shares traded—can help determine the conviction behind a move. A 2% gain on high volume is a much stronger signal of a sustained trend than a 2% gain on low volume, which might just be a temporary blip.
Strategy Over Reaction: Contextualizing Daily Fluctuations
The most important aspect of checking the market’s daily performance is what you do with that information. For the long-term builder of wealth, “today” is often just noise.
The Danger of Checking the Ticker Too Often
Behavioral finance studies have shown that the more frequently an investor checks their portfolio, the more likely they are to perceive “risk” where there is only “volatility.” Volatility is the price of admission for the higher returns of the stock market. If you check your accounts daily, you have a roughly 50/50 chance of seeing a loss. If you check once a year, the probability of seeing a gain increases significantly.
Frequent checking often leads to “panic selling” during a temporary dip or “FOMO” (fear of missing out) buying during a temporary peak. Both behaviors are detrimental to compounding wealth.
Aligning Daily Movements with Long-Term Goals
To maintain a professional mindset, one should view daily market performance as a data point rather than a call to action. Successful investors use daily fluctuations as opportunities to execute a pre-planned strategy. For example, a significant market drop today might be an opportunity to “rebalance” a portfolio—selling bonds that have held their value to buy stocks at a discount.
Instead of asking “How did the market do today?” with anxiety, ask “Does today’s movement change my long-term thesis on my investments?” In 99% of cases, the answer is no. Whether the market was up or down today, the principles of disciplined saving, diversification, and staying the course remain the most reliable paths to financial independence.
In conclusion, while the daily oscillations of the stock market are fascinating and provide a window into the world’s economic engine, they are merely small waves in a vast ocean. By understanding the indices, identifying the drivers of change, and using the right tools—all while maintaining a long-term perspective—you can transform from a reactive spectator into a proactive steward of your own financial destiny.
aViewFromTheCave is a participant in the Amazon Services LLC Associates Program, an affiliate advertising program designed to provide a means for sites to earn advertising fees by advertising and linking to Amazon.com. Amazon, the Amazon logo, AmazonSupply, and the AmazonSupply logo are trademarks of Amazon.com, Inc. or its affiliates. As an Amazon Associate we earn affiliate commissions from qualifying purchases.