
Understanding the trajectory of Tesla’s sales involves delving deep into a complex interplay of production capabilities, market demand, pricing strategies, and the evolving landscape of the global electric vehicle (EV) market. For investors and financial observers, Tesla’s sales figures are not merely unit counts; they are critical indicators of operational efficiency, market penetration, profitability, and future growth potential. These numbers directly influence revenue streams, gross margins, and ultimately, shareholder value, making them a central focus for anyone assessing the company’s financial health.
A Glimpse into Tesla’s Financial Performance
Tesla’s financial narrative is largely dictated by its ability to produce and deliver vehicles at scale, coupled with strategic pricing and cost management. The core of its sales performance is reflected in its quarterly production and delivery reports, which serve as direct precursors to revenue generation.
Quarterly Deliveries and Production Milestones
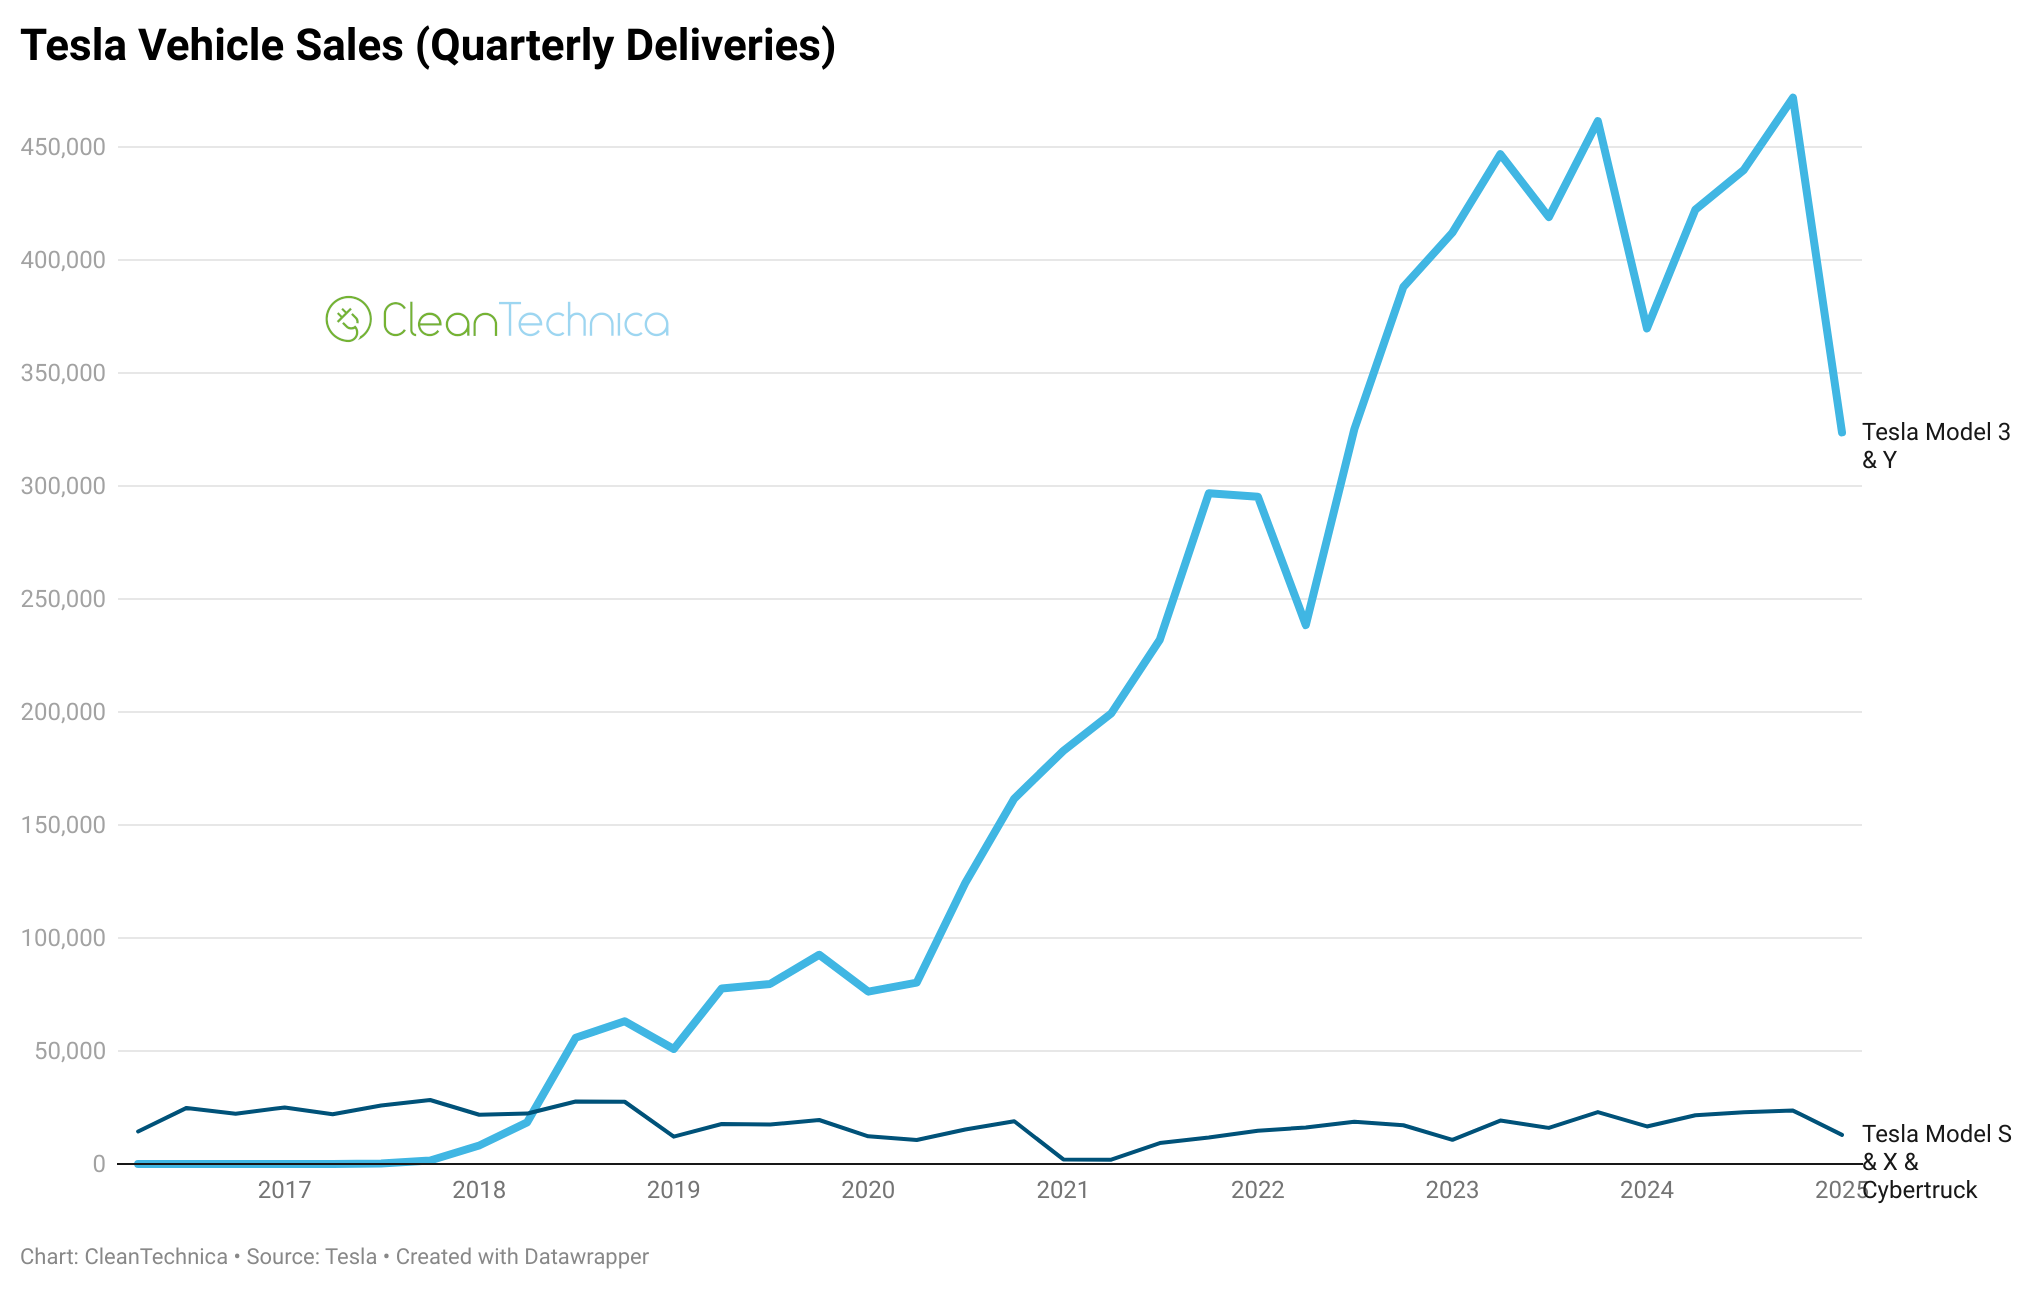
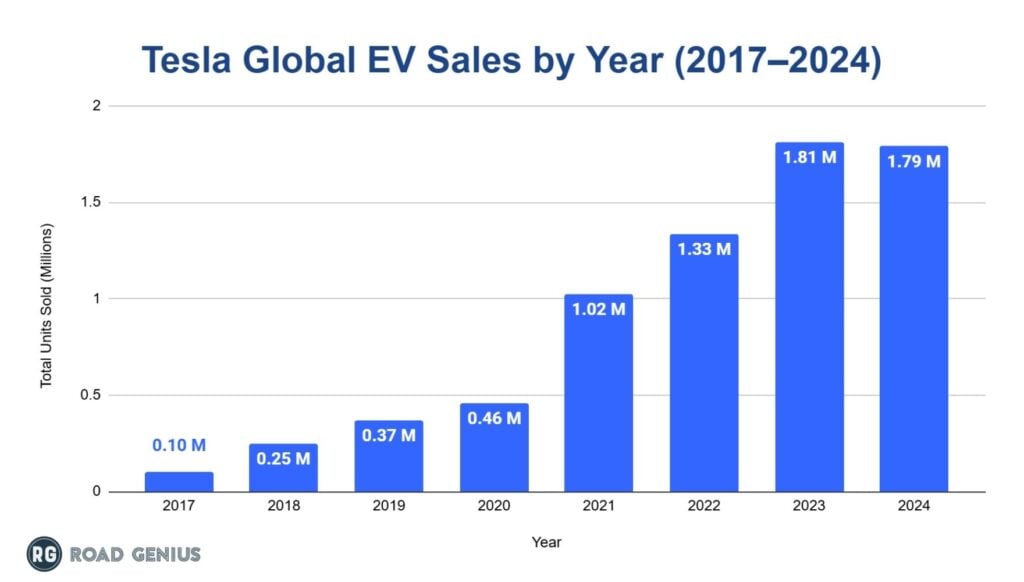
Tesla’s financial reporting heavily emphasizes vehicle deliveries as a primary metric of success. These numbers are a direct measure of demand fulfillment and operational output. Consistently increasing deliveries quarter-over-quarter and year-over-year has historically been a key driver for investor confidence and stock appreciation. The company has set ambitious production targets, and its ability to meet or exceed these goals directly impacts market sentiment and financial forecasts. For instance, strong delivery numbers often lead to positive analyst revisions and upward stock movement, while misses can trigger market corrections. The sheer volume of vehicles moved translates directly into top-line revenue, which is then dissected for profitability.
Revenue Growth and Profitability Drivers
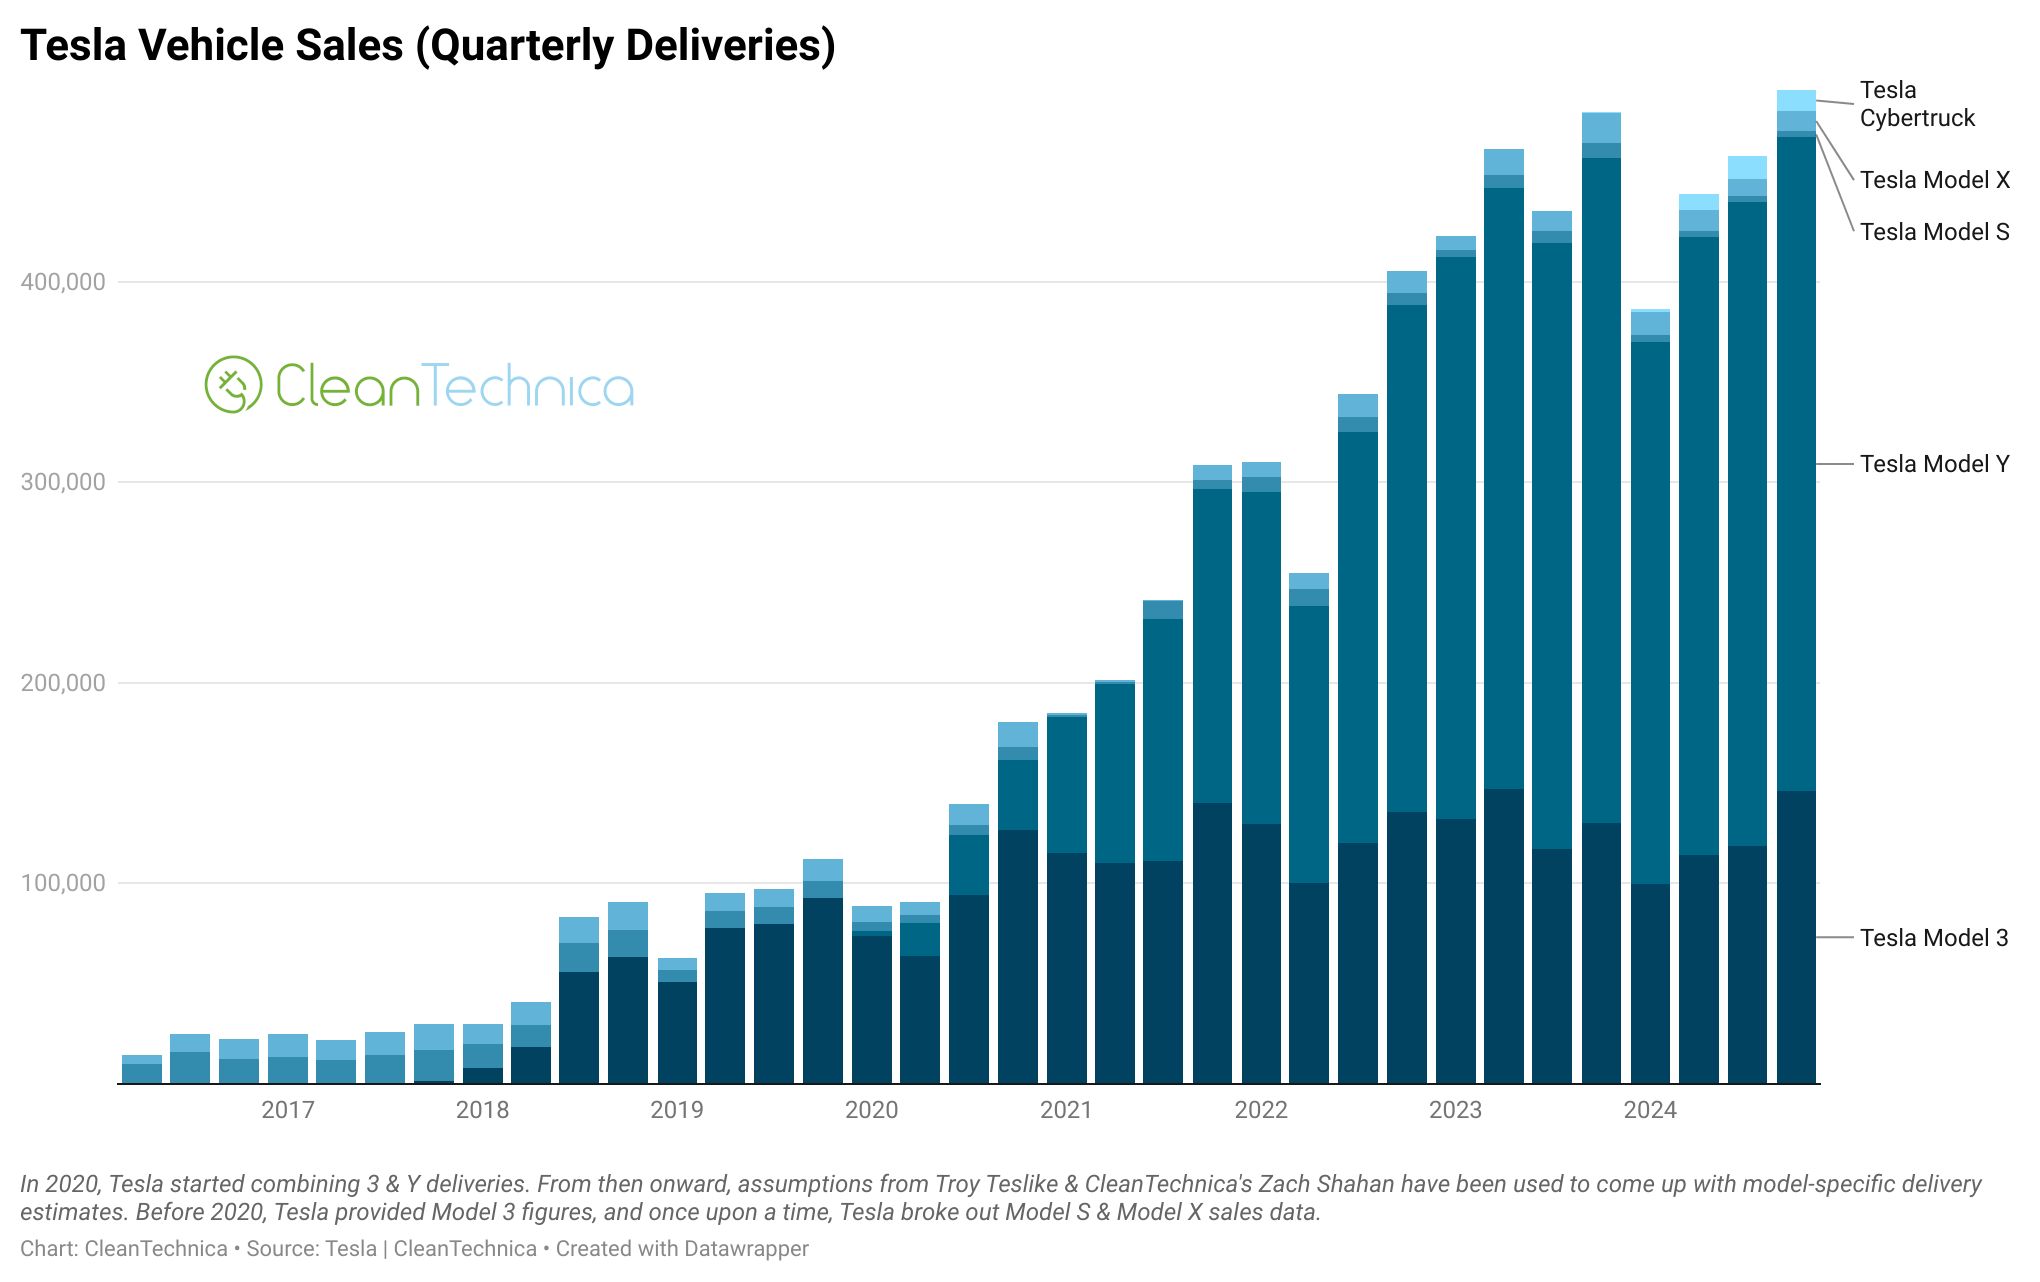
Sales, in their essence, are the lifeblood of revenue. Tesla’s revenue growth is not solely dependent on increasing vehicle unit sales, though that remains a significant factor. It’s also influenced by the average selling price (ASP) of its vehicles, which can fluctuate based on model mix (e.g., higher-margin Model S/X versus Model 3/Y), regional pricing adjustments, and the introduction of new variants. Beyond vehicle sales, Tesla’s revenue streams include energy generation and storage products (Powerwall, Megapack), services and other segments (Supercharging, service centers, merchandise), and perhaps most notably, regulatory credit sales. These credits, earned from selling zero-emission vehicles, can provide a substantial, albeit variable, boost to the company’s net income, directly impacting profitability. Monitoring the gross margins on automotive sales, excluding these credits, offers a clearer picture of the core vehicle business’s inherent profitability. Operating expenses, including research and development, sales, general, and administrative costs, are then deducted from gross profit to arrive at operating income, another critical financial metric derived directly from sales performance.
Market Dynamics and Competitive Landscape
Tesla operates within a dynamic and increasingly competitive global automotive market, where broader economic trends and specific EV adoption patterns significantly influence its sales volumes and financial standing.
EV Adoption Rates and Regional Variations
The pace of global EV adoption is a major external factor dicturing Tesla’s potential market size. Government incentives, charging infrastructure development, and consumer willingness to switch from internal combustion engine (ICE) vehicles all play crucial roles. Tesla’s sales performance often mirrors the health of the EV market in key regions like North America, Europe, and especially China, which is the world’s largest EV market. Strong EV sales growth in these regions provides a tailwind for Tesla, while slowing adoption or increased domestic competition can present headwinds. Regional economic conditions, such as interest rates impacting financing costs for consumers, also exert direct pressure on sales volumes across different geographies.
Pricing Strategies and Affordability Challenges
Tesla has frequently adjusted its pricing strategy, often implementing price cuts to stimulate demand, particularly in competitive markets like China. While lower prices can boost sales volumes and market share, they can also compress gross margins if not offset by significant production efficiencies or cost reductions. For investors, understanding the balance between sales volume growth and profitability per vehicle is paramount. The affordability of Tesla vehicles, especially relative to growing competition from traditional automakers and new EV entrants, becomes a critical factor in attracting a wider customer base. These pricing decisions are a direct lever influencing the company’s financial outcomes, impacting both revenue and profitability. The interplay between pricing, demand elasticity, and manufacturing costs is constantly under scrutiny when assessing Tesla’s sales financial performance.
Investor Sentiment and Future Outlook
Tesla’s sales figures are arguably among the most eagerly anticipated data points for the financial markets, directly shaping investor sentiment, stock valuation, and future expectations.
Impact of Sales Trends on Stock Valuation
The quarterly delivery numbers are a flashpoint for Tesla’s stock. Meeting or exceeding analyst consensus often results in a positive market reaction, reflecting confidence in the company’s growth trajectory and operational execution. Conversely, a miss can lead to significant stock price declines, as investors reassess future earnings potential and perceived demand. Long-term sales trends, demonstrating consistent growth, are vital for justifying Tesla’s premium valuation compared to traditional automakers. Investors closely analyze not just the headline delivery figures but also the growth rate, geographic breakdown, and model mix, as these nuances provide deeper insights into underlying market strength and the company’s financial health. Any guidance on future sales expectations from management during earnings calls also heavily influences analyst models and investor decisions.
Growth Catalysts and Potential Headwinds
Future sales growth for Tesla hinges on several catalysts. The introduction of new models, such as the Cybertruck or next-generation lower-cost vehicles, is expected to unlock new market segments and drive substantial delivery increases. Expansions in manufacturing capacity, particularly new gigafactories coming online, are crucial for supporting higher production volumes. Furthermore, continued innovation in battery technology, leading to improved range and lower costs, will enhance the attractiveness and affordability of Tesla vehicles, indirectly bolstering sales.
However, several headwinds could temper future sales performance. Increased competition from established automotive giants and aggressive new EV startups, particularly in key markets, could erode market share. Economic downturns, high interest rates, and geopolitical tensions can depress consumer spending on big-ticket items like cars. Supply chain disruptions, while less severe than during the pandemic, still pose a risk to production consistency. The sustainability of regulatory credit sales also remains a financial variable, as other automakers ramp up EV production and reduce their need to purchase credits. Each of these factors, both positive and negative, is weighed heavily by financial analysts and investors when projecting Tesla’s future sales and, consequently, its financial performance.
Understanding the Nuances of Tesla’s Business Model
While vehicle sales are the most visible component, Tesla’s financial model is increasingly diversified, with several other revenue streams playing a significant role in its overall sales performance and profitability.
The Role of FSD and Software Revenue
Beyond the physical sale of a vehicle, Tesla is aggressively pursuing a software-driven business model. Features like Full Self-Driving (FSD) capability, sold as an upfront option or a monthly subscription, represent a high-margin recurring revenue stream. As FSD matures and expands its capabilities, the attachment rate and subscription base can significantly boost Tesla’s financial results without the associated manufacturing costs of a physical vehicle. This transition towards a software-centric approach allows for higher revenue per vehicle over its lifetime, enhancing overall financial performance and diversifying away from purely hardware-dependent sales. Financial analysts closely monitor the growth of FSD subscriptions and the recognition of deferred FSD revenue as key indicators of this strategic shift.
Energy Storage and Services Contributions
Tesla’s energy division, encompassing Powerwall home batteries and Megapack utility-scale storage solutions, represents another growing sales segment. These products not only align with the company’s mission for sustainable energy but also contribute meaningfully to the top line. The sales of these energy products are influenced by renewable energy adoption trends, government incentives for storage, and grid stability needs. Additionally, the ‘Services & Other’ segment, which includes Supercharging revenue, maintenance, collision repair, and merchandise sales, provides a steady and increasingly important revenue stream. As Tesla’s fleet grows globally, the demand for charging and service increases, contributing to consistent financial inflows that further solidify the company’s overall sales picture and financial resilience. For investors, understanding the growth and profitability of these diverse segments offers a more comprehensive view of Tesla’s total sales and financial outlook beyond just automotive units.
aViewFromTheCave is a participant in the Amazon Services LLC Associates Program, an affiliate advertising program designed to provide a means for sites to earn advertising fees by advertising and linking to Amazon.com. Amazon, the Amazon logo, AmazonSupply, and the AmazonSupply logo are trademarks of Amazon.com, Inc. or its affiliates. As an Amazon Associate we earn affiliate commissions from qualifying purchases.