Tesla’s sales performance is a critical barometer for investors, financial analysts, and the broader automotive and technology sectors. Far beyond mere unit deliveries, sales figures underpin revenue generation, profitability, market share, and ultimately, shareholder value. Assessing how Tesla’s sales are doing requires a deep dive into quarterly and annual reports, understanding market dynamics, and analyzing the financial implications of its strategic decisions.
A Snapshot of Tesla’s Recent Sales Performance
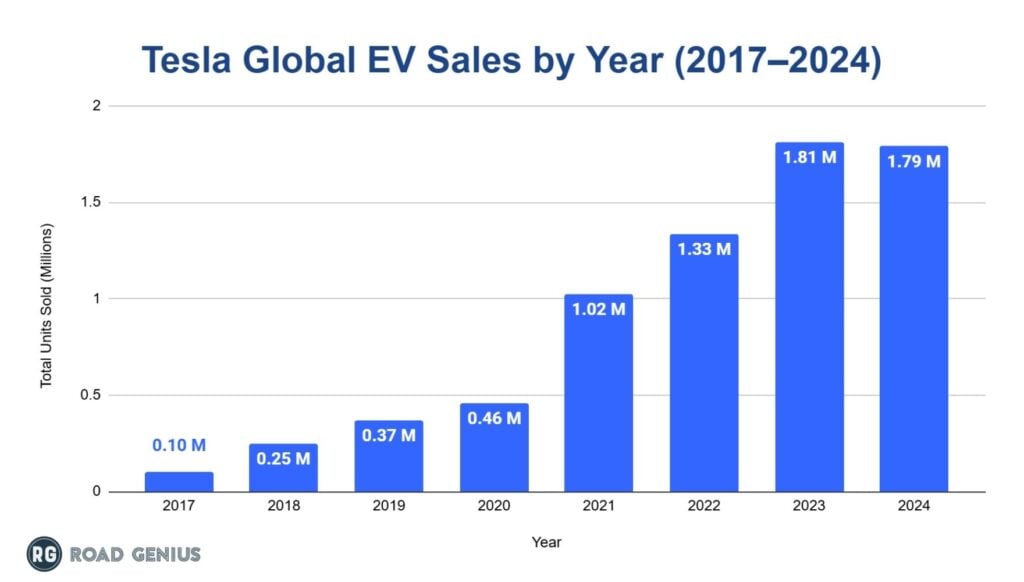
Evaluating Tesla’s sales health begins with its core financial metrics: vehicle deliveries and related revenue. These figures are closely scrutinized by the market as they offer direct insights into consumer demand and operational efficiency. Over recent periods, Tesla has demonstrated remarkable growth, albeit with notable fluctuations influenced by macroeconomic factors, production ramp-ups, and competitive pressures.
![]()
Key Delivery and Production Figures
Tesla’s financial reports consistently highlight its vehicle deliveries, which serve as the primary indicator of sales volume. These numbers are often released ahead of full earnings reports and can significantly sway investor sentiment. The company has historically set ambitious delivery targets, and its ability to meet or exceed these has been a cornerstone of its market narrative. For instance, strong sequential and year-over-year growth in deliveries typically signals robust demand and effective production scaling. Conversely, any miss on delivery targets can lead to downward revisions in revenue forecasts and exert pressure on the stock price. Production figures, while not directly sales, are equally important as they represent the supply side’s capacity to meet demand, indicating potential for future sales. Analyzing the mix of models sold (Model 3/Y versus Model S/X and Cybertruck) also provides a nuanced view, as different models carry varying price points and profit margins.
Revenue and Profitability Implications
Sales volumes directly translate into top-line revenue. Beyond the sheer number of vehicles sold, the average selling price (ASP) of Tesla’s vehicles plays a crucial role in revenue generation. Changes in product mix, pricing adjustments (such as price cuts or increases), and regional sales variations all impact the total revenue reported. From a financial perspective, however, revenue is just one piece of the puzzle. The profitability derived from these sales is paramount. Gross profit margins on automotive sales are a key metric, indicating the efficiency of production and the pricing power of the brand. Higher sales volumes, especially of higher-margin models, contribute disproportionately to net income. Fluctuations in material costs, manufacturing efficiencies, and the competitive landscape can compress or expand these margins, directly affecting Tesla’s overall financial health and its appeal to investors seeking sustainable earnings.
Market Dynamics and Competitive Landscape
Tesla operates in a dynamic market influenced by global economic conditions, evolving consumer preferences, and an intensifying competitive environment. These external factors directly impact its sales trajectory and financial performance. Understanding these dynamics is crucial for investors to contextualize Tesla’s sales figures.
Pricing Strategies and Their Impact
Tesla has shown a willingness to adjust its vehicle pricing dynamically, often in response to market demand, production costs, and competitive actions. Price cuts, for example, can stimulate sales volume by making vehicles more accessible and competitive, particularly in price-sensitive markets like China. However, such moves often come with a trade-off, potentially impacting automotive gross margins and overall profitability in the short term. Conversely, price increases for popular models reflect strong demand and allow Tesla to capture more value per sale, bolstering revenues and margins. Investors carefully watch these pricing strategies, as they are a direct lever for managing sales volume and financial output, influencing future revenue and earnings forecasts. The balance between volume growth and margin preservation is a continuous tightrope walk for the company, with direct consequences for its financial statements.
Global Market Expansion and Challenges
Tesla’s sales performance is intrinsically linked to its global expansion strategy. Growth in established markets like North America and Europe, coupled with penetration into rapidly expanding electric vehicle (EV) markets such as China and emerging economies, is vital for sustained revenue growth. Each region presents unique financial opportunities and challenges. For instance, robust sales in China significantly contribute to overall volume but can also expose Tesla to intense domestic competition and geopolitical risks. Navesting diverse regulatory landscapes, managing supply chains across continents, and adapting product offerings to local consumer tastes are all financial considerations that directly influence sales potential and operational costs. Investment in new Gigafactories in different regions demonstrates Tesla’s commitment to localized production, which aims to reduce logistics costs and tariffs, thereby improving local market competitiveness and ultimately boosting sales and profitability.
Investor Sentiment and Financial Outlook
![]()
The financial market’s reaction to Tesla’s sales performance is swift and often dramatic. Sales figures are not just historical data points; they are forward-looking indicators that shape investor sentiment, influence stock valuation, and dictate the company’s financial outlook.
Stock Performance Correlation
There is a strong correlation between Tesla’s reported sales figures (especially deliveries) and its stock performance. Strong delivery numbers often lead to a positive market reaction, driving the stock higher, as investors anticipate stronger revenues and earnings. Conversely, missed delivery targets or signs of weakening demand can trigger sell-offs. This sensitivity reflects Tesla’s growth stock status, where future growth expectations are heavily priced into its valuation. Financial analysts update their models and price targets based on these sales data, influencing institutional and retail investor decisions. Beyond unit sales, trends in average selling prices, order backlogs, and inventory levels also provide critical clues to investors about the underlying demand and pricing power, directly impacting the perceived financial health and future trajectory of the company.
Future Growth Drivers and Risks
Investors assess Tesla’s sales performance not only on past results but also on its potential for future growth. Key growth drivers include the successful launch and ramp-up of new products (e.g., Cybertruck, next-generation platforms), expansion into new geographical markets, and the continued development of its charging infrastructure (Supercharger network). These initiatives require significant capital expenditure, and their success in driving sales volume is critical for justifying these investments and generating future revenue streams. However, several financial risks could impede sales growth, including intense competition from legacy automakers and new EV startups, potential supply chain disruptions affecting production, macroeconomic headwinds (e.g., high interest rates impacting car financing), and regulatory changes. The ability of Tesla to mitigate these risks and capitalize on growth opportunities will be pivotal for its sustained sales performance and long-term financial viability.
The Role of Financial Metrics in Assessing Tesla’s Health
While sales volume is a primary indicator, a comprehensive financial assessment of Tesla’s sales health necessitates looking beyond just the number of vehicles sold. Other key financial metrics provide deeper insights into the quality of sales, operational efficiency, and overall financial strength.
Gross Margins and Operating Efficiency
Gross margins, particularly automotive gross margins, are critical for understanding the profitability embedded in each sale. Tesla’s ability to maintain or expand these margins amidst price adjustments, input cost fluctuations, and increased competition is a core financial challenge. A high gross margin indicates efficient production, effective cost management, and strong pricing power. Declining margins, even with rising sales volume, can signal underlying issues in cost control or increased competitive pressure forcing price reductions. Furthermore, operating efficiency, reflected in operating expenses relative to revenue, shows how effectively Tesla converts its sales into operating income. Investments in research and development (R&D) are vital for future product innovation and sales, but they must be managed carefully to avoid eroding profitability. Monitoring these metrics helps investors gauge the financial sustainability of Tesla’s sales growth.
Cash Flow and Capital Expenditures
Strong sales performance should ideally translate into robust cash flow from operations, which is the lifeblood of any growing company. Positive cash flow allows Tesla to self-fund its ambitious growth plans, including investments in new factories, product development, and charging infrastructure (capital expenditures, or CapEx). A company generating substantial free cash flow (cash flow from operations minus CapEx) demonstrates financial independence and flexibility, reducing its reliance on external financing. Conversely, if sales growth is not translating into sufficient cash generation, it might indicate aggressive pricing strategies impacting profitability or high operational costs. Investors pay close attention to Tesla’s cash position and its ability to fund its massive CapEx requirements internally, as it reflects the true financial strength and sustainability of its sales and operational model.
Long-Term Financial Projections and Investor Considerations
Tesla’s sales performance is not just a quarterly event; it’s part of a long-term financial narrative that influences investment decisions. Projecting future sales and their financial implications requires a nuanced understanding of market trends, competitive shifts, and the company’s strategic roadmap.
Financial analysts use current sales data to build models that project future revenue, earnings per share (EPS), and cash flows. These projections are heavily influenced by assumptions about vehicle demand, ASPs, production capacity, and profitability margins. For long-term investors, the focus extends beyond immediate sales figures to the company’s ability to sustain high growth rates, expand its addressable market, and diversify its revenue streams beyond vehicle sales (e.g., energy storage, software subscriptions). The successful execution of new product launches, such as the Cybertruck or future entry-level models, is crucial for unlocking new sales volumes and market segments, thereby expanding the total revenue opportunity.
However, the long-term financial outlook also considers potential headwinds. Increased competition could dilute market share and put downward pressure on pricing, impacting revenue and margins. Regulatory changes, particularly concerning environmental standards and subsidies, could either boost or hinder sales depending on their nature. The scalability of manufacturing processes and the global supply chain’s resilience are also vital financial considerations. Ultimately, investors weigh the significant growth potential against these inherent risks, using sales performance as a critical indicator of the company’s progress toward its long-term financial objectives and its ability to generate sustainable shareholder returns.
aViewFromTheCave is a participant in the Amazon Services LLC Associates Program, an affiliate advertising program designed to provide a means for sites to earn advertising fees by advertising and linking to Amazon.com. Amazon, the Amazon logo, AmazonSupply, and the AmazonSupply logo are trademarks of Amazon.com, Inc. or its affiliates. As an Amazon Associate we earn affiliate commissions from qualifying purchases.