
In the landscape of data science and software engineering, we are often taught that the median is the ultimate “robust” measure of central tendency. Unlike the mean, which can be easily skewed by a single outlier, the median remains a steadfast representation of the “middle” of a dataset. However, as data environments become more complex—dealing with high-frequency financial signals, massive user engagement logs, or erratic cloud latency metrics—the simplicity of the median often breaks down.
The phrase “having two medians” usually refers to one of two scenarios in technical analysis: the mathematical ambiguity of even-numbered datasets or, more significantly, the discovery of a bimodal distribution where two distinct peaks suggest that a single “central” value is no longer a valid representation of reality. When you find yourself with two medians, you are no longer looking at a simple list of numbers; you are looking at a signal that your system or your users are behaving in two fundamentally different ways.

The Statistical Conundrum: When Data Refuses to Converge
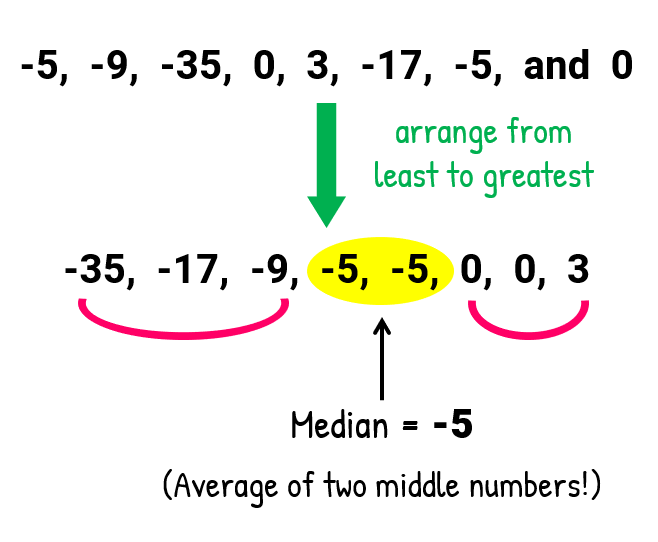
In introductory statistics, the median is straightforward. If you have an odd number of observations, it is the middle value. If you have an even number, it is conventionally the average of the two middle values. However, in high-precision software engineering and algorithmic trading, this “average of the middle” approach can mask critical insights.
The Limits of Interpolation
When a dataset contains an even number of elements, software libraries like NumPy (Python) or the standard statistics packages in R default to interpolating between the two middle points. While this provides a neat, single number, it is essentially a fabrication. In a dataset of {10, 10, 20, 20}, the median is 15. Yet, 15 does not exist in the dataset.
In systems where precision is paramount—such as determining a threshold for an automated circuit breaker or a load-balancer—using an interpolated median can lead to “dead zones.” If your system is designed to trigger at the median, but the median is a value that never actually occurs in real-world usage, your logic may fail to account for the actual state of the system.
Choosing the High or Low Median
In many database management systems (DBMS), such as PostgreSQL or Oracle, developers often have to choose between the “low median” (the smaller of the two middle values) or the “high median” (the larger). This is not just a mathematical preference; it is a business logic decision.
For instance, in a resource allocation algorithm, selecting the high median ensures that the system is over-provisioned rather than under-provisioned. Conversely, in a cost-containment script, the low median might be the safer bet. When your data presents two medians, the first step is to stop defaulting to the average and start selecting the median that aligns with your system’s risk tolerance.
Navigating Bimodal Distributions in Data Science
The more complex version of the “two medians” problem occurs when a distribution is bimodal. This happens when your data has two distinct peaks, creating a “valley” where a traditional median would normally sit. In this scenario, the median is often the least representative value in the entire set.
Identifying the Split
A bimodal distribution is a red flag in any tech stack. It suggests that your data is not coming from a single population, but from two distinct groups that have been erroneously merged.
Consider a global SaaS platform measuring user session lengths. If the data shows two peaks—one at 2 minutes and one at 45 minutes—calculating a single median (e.g., 23 minutes) is useless. The “median user” doesn’t actually exist. Instead, you have a group of “quick-check” mobile users and a group of “power-user” desktop workers. When you see two medians emerging in your density plots, your first action must be segmentation.
The Perils of Aggregation
Aggregating bimodal data into a single median is one of the most common mistakes in modern analytics. In DevOps, this often happens with latency metrics. If your server response times have a peak at 50ms (cache hits) and another peak at 500ms (cache misses), the median might sit at 275ms.
Optimizing for a 275ms median is a fool’s errand because no one is actually experiencing 275ms latency. You are either succeeding or failing, with no middle ground. When “two medians” appear in the form of bimodality, you must stop treating the data as a single stream and start building separate monitoring pipelines for each distinct behavior.
Algorithmic Strategies for Disambiguation
Once you have identified that your data is presenting two centers of gravity, you need a technical strategy to handle it. You cannot simply ignore the duality; you must architect your algorithms to account for it.

K-Means Clustering for Center Detection
The most common way to handle “two medians” in machine learning is to move away from central tendency and toward clustering. By applying a K-means algorithm where K=2, you can programmatically identify the two centers of gravity.
This approach allows the system to assign every incoming data point to one of the two “median” groups. In a customer-facing app, this could mean the UI automatically adapts based on which cluster a user falls into. If the user’s behavior aligns with the “low-latency/high-frequency” median, the app prioritizes speed. If they align with the “high-latency/low-frequency” median, the app prioritizes data-heavy features.
Kernel Density Estimation (KDE)
When a simple median fails, Kernel Density Estimation is the data scientist’s best friend. KDE allows you to visualize the “shape” of the data, making it obvious where the two peaks (the local maxima) are.
In a Python environment using Seaborn or Matplotlib, plotting a KDE curve over your histogram will reveal exactly how far apart your two medians are. If the peaks are far apart with a deep trough in between, you know that any single-value summary (mean or median) is statistically invalid. In this case, you should report the “modes” (the peaks) rather than the median.
Practical Implementation in Software Engineering and UX
The technical reality of “two medians” has immediate implications for how software is built and how users interact with it. From load balancing to A/B testing, the presence of two centers of gravity requires a shift in engineering philosophy.
Load Balancing and Throughput
In distributed systems, we often use medians to set timeouts or to determine when to spin up new instances. However, if your traffic is bimodal—perhaps consisting of small API calls and large file uploads—a single median timeout will either be too slow for the API calls or too fast for the uploads, causing unnecessary errors.
The solution is to implement “Class of Service” (CoS) tagging. By recognizing that there are two medians in your traffic pattern, you can route traffic to different pools of workers optimized for each specific median. This is a “split-median” architecture, where the system recognizes the dual nature of its workload and handles it with specialized resources.
A/B Testing and the Simpson’s Paradox
In UX research, “two medians” can often be a symptom of Simpson’s Paradox, where a trend appears in different groups of data but disappears or reverses when these groups are combined.
Imagine you are A/B testing a new checkout flow. In aggregate, the median conversion time is the same for both versions. But if you look closer, you see two medians: one for returning users (who are faster) and one for new users (who are slower). If Version B makes returning users faster but confuses new users, the medians might cancel each other out in the aggregate data. When you encounter two medians in your test results, it is a signal to drill down into your demographics; otherwise, you might ship a feature that actively harms a specific segment of your user base.
The Future of Central Tendency in Machine Learning
As we move toward more autonomous systems, the way we handle “two medians” will become a defining factor in the reliability of AI and ML models. Static medians are becoming a relic of a simpler era of data processing.
Dynamic Thresholding
Modern monitoring tools like Datadog or Prometheus are increasingly moving toward dynamic thresholding. Instead of a human setting a “median” value for an alert, the system uses machine learning to identify the current “normal” centers of gravity. If the system enters a bimodal state—something that might happen during a partial outage or a “grey failure”—the AI recognizes the emergence of a second median and alerts the engineers to a “distribution shift.”
Beyond the Median: Medoids and Centroids
In high-dimensional tech spaces, we are seeing a shift from the median toward the “medoid.” A medoid is the object in a cluster whose average dissimilarity to all the objects in the cluster is minimal. It is, in essence, the “most central” actual data point.
When you have two clusters (the two medians problem), finding the medoid for each provides a much more accurate representative sample than a mathematical median ever could. This is used extensively in recommendation engines. If a user likes both Horror movies and Romantic Comedies, the system shouldn’t recommend a “median” movie (which would be a confusing middle-ground). It should find the medoid for their Horror interest and the medoid for their Rom-Com interest, serving two distinct sets of recommendations.
Conclusion: Embracing the Duality
Finding two medians in your data is not a failure of your collection methods; it is an insight into the complexity of your system. In the tech world, the middle is often a ghost—a value that represents everyone in theory but no one in practice.
Whether you are dealing with even-numbered datasets that require a choice between high and low medians, or bimodal distributions that require clustering and segmentation, the goal remains the same: accuracy over simplicity. When you have two medians, stop looking for a way to merge them. Instead, build your systems to understand, accommodate, and leverage the duality. The most robust tech stacks are those that don’t just find the center, but recognize when the center has moved—or when there are two of them.
aViewFromTheCave is a participant in the Amazon Services LLC Associates Program, an affiliate advertising program designed to provide a means for sites to earn advertising fees by advertising and linking to Amazon.com. Amazon, the Amazon logo, AmazonSupply, and the AmazonSupply logo are trademarks of Amazon.com, Inc. or its affiliates. As an Amazon Associate we earn affiliate commissions from qualifying purchases.