In the dynamic landscape of business finance, the ability to accurately measure, monitor, and manage performance is paramount to sustainable growth and profitability. At the heart of this capability lie Key Performance Indicator (KPI) reports. Far more than mere compilations of data, these reports serve as indispensable financial tools, translating raw numbers into actionable insights that guide strategic decisions, optimize resource allocation, and ultimately enhance the fiscal health of an organization. Understanding what constitutes a KPI report, its various forms, and its profound utility is critical for any individual or entity navigating the complexities of business finance.
The Foundation of Business Finance: Understanding KPI Reports
A KPI report is a structured presentation of an organization’s Key Performance Indicators, designed to track progress toward specific financial and operational goals over a defined period. These reports distill vast quantities of data into digestible, relevant metrics, allowing stakeholders to quickly grasp the current state of affairs and identify areas requiring attention or intervention. For businesses, particularly in the realm of finance, KPI reports are the vital signs that indicate the organization’s health, predicting future performance and highlighting historical trends.
Defining Key Performance Indicators
Key Performance Indicators (KPIs) are quantifiable measures used to evaluate the success of an organization, a project, or an individual in meeting objectives. In a financial context, KPIs are metrics that directly reflect the fiscal health, efficiency, profitability, and growth trajectory of a business. They must be SMART: Specific, Measurable, Achievable, Relevant, and Time-bound. For instance, “increase sales” is a goal, but “increase quarterly net profit margin by 2% year-over-year” is a KPI. The selection of appropriate KPIs is crucial, as they must align directly with an organization’s strategic financial objectives to provide meaningful insights. Without well-defined KPIs, reports risk becoming a collection of uncontextualized numbers, offering little value for decision-making.
The Purpose of KPI Reports in Financial Management
The primary purpose of KPI reports in financial management is to provide a clear, concise, and objective view of an organization’s financial performance. They enable finance professionals, managers, and executives to:
- Monitor financial health: Keep a pulse on profitability, liquidity, solvency, and efficiency.
- Identify trends and patterns: Detect emerging opportunities or potential risks before they escalate.
- Track progress against goals: Measure performance against established financial targets and budgets.
- Facilitate informed decision-making: Provide data-backed insights to guide investments, cost controls, pricing strategies, and operational adjustments.
- Enhance accountability: Clearly define performance expectations and hold teams or departments responsible for financial outcomes.
- Communicate performance: Offer a standardized way to share financial results with internal and external stakeholders, including investors, lenders, and board members.
Ultimately, KPI reports empower businesses to move beyond reactive financial management to a proactive, data-driven approach, fostering a culture of continuous improvement and strategic growth.
Types of Financial KPIs and Their Role in Reporting
Financial KPI reports often categorize metrics to provide a holistic view of performance. These categories typically include profitability, liquidity, efficiency, and growth, each offering distinct insights into different facets of a business’s financial operations.
Profitability KPIs
Profitability KPIs measure a company’s ability to generate earnings relative to its revenue, operating costs, and balance sheet assets. They are fundamental to assessing financial viability. Common examples include:
- Gross Profit Margin: (Gross Profit / Revenue) * 100 – Indicates how much money a company makes from each sale after accounting for the cost of goods sold.
- Net Profit Margin: (Net Profit / Revenue) * 100 – Reveals the percentage of revenue left after all expenses, including taxes and interest, have been deducted.
- Operating Profit Margin: (Operating Income / Revenue) * 100 – Shows the profitability of core operations before interest and taxes.
- Return on Assets (ROA): (Net Income / Average Total Assets) * 100 – Measures how efficiently a company uses its assets to generate earnings.
Reporting these KPIs regularly allows businesses to understand the drivers of their profit, identify areas for cost reduction, and evaluate the effectiveness of pricing strategies.
Liquidity KPIs
Liquidity KPIs assess a company’s ability to meet its short-term financial obligations. They are critical for managing cash flow and ensuring operational continuity. Key metrics include:
- Current Ratio: Current Assets / Current Liabilities – Indicates a company’s ability to pay off its short-term liabilities with its short-term assets. A ratio of 2:1 is generally considered healthy.
- Quick Ratio (Acid-Test Ratio): (Current Assets – Inventory) / Current Liabilities – A more conservative measure than the current ratio, as it excludes inventory, which can be less liquid.
- Cash Ratio: Cash and Cash Equivalents / Current Liabilities – The most stringent liquidity measure, focusing solely on cash.
These KPIs are vital for lenders and creditors, but also for internal management to prevent cash flow crises and maintain financial stability.
Efficiency KPIs
Efficiency KPIs measure how effectively a company utilizes its assets and manages its liabilities to generate revenue. They speak to operational effectiveness and resource optimization. Examples include:
- Inventory Turnover: Cost of Goods Sold / Average Inventory – Indicates how many times inventory is sold and replaced over a period. A high turnover usually suggests efficient sales and inventory management.
- Accounts Receivable Turnover: Net Credit Sales / Average Accounts Receivable – Measures how quickly a company collects cash from its credit sales. A higher ratio indicates efficient collection.
- ****Accounts Payable Turnover: Purchases / Average Accounts Payable – Shows how quickly a company pays its suppliers.
- Asset Turnover Ratio: Net Sales / Average Total Assets – Measures a company’s efficiency in using its assets to generate sales.
By tracking these, businesses can pinpoint inefficiencies in their operations, optimize working capital, and enhance overall productivity.
Growth KPIs
Growth KPIs track the expansion and development of a company over time. While often tied to revenue, they can also encompass customer acquisition and market share. Important metrics include:
- Revenue Growth Rate: ((Current Period Revenue – Prior Period Revenue) / Prior Period Revenue) * 100 – Measures the percentage increase in sales over a specific period.
- Customer Acquisition Cost (CAC): Total Marketing and Sales Costs / Number of New Customers – The cost associated with convincing a potential customer to buy a product or service.
- Customer Lifetime Value (CLV): Average Purchase Value * Average Purchase Frequency * Average Customer Lifespan – Estimates the total revenue a business can reasonably expect from a single customer account over the course of their relationship.
Monitoring growth KPIs helps businesses gauge their market penetration, assess the effectiveness of their growth strategies, and project future revenue streams.

Building and Utilizing Effective KPI Reports
The value of a KPI report lies not just in the data it presents, but in its ability to facilitate clear understanding and drive action. Effective reports are meticulously constructed, leveraging appropriate financial tools and visualization techniques.
Data Collection and Aggregation
The cornerstone of any robust KPI report is accurate and timely data. This often involves integrating data from various financial systems, such as enterprise resource planning (ERP) software, accounting platforms, CRM systems, and payroll solutions. Manual data entry can be prone to errors and consume valuable time, making automated data collection and aggregation essential for consistency and reliability. Data needs to be cleaned, validated, and transformed into a format suitable for analysis, ensuring that the underlying numbers are trustworthy.
Choosing the Right Financial Tools
Modern business finance relies heavily on specialized tools for generating KPI reports. These can range from sophisticated business intelligence (BI) platforms and data visualization software to advanced spreadsheet applications and dedicated financial reporting suites.
- Business Intelligence (BI) Tools: Offer robust capabilities for data integration, analysis, and dashboard creation, allowing for interactive and dynamic KPI reports. Examples include Tableau, Power BI, and Qlik Sense.
- Financial Reporting Software: Often part of larger ERP systems (e.g., SAP, Oracle, NetSuite) or standalone solutions (e.g., Adaptive Insights, Workday Adaptive Planning), these tools specialize in financial consolidation, budgeting, forecasting, and KPI tracking.
- Advanced Spreadsheets: While less automated, tools like Microsoft Excel or Google Sheets, when used with advanced functions, pivot tables, and macros, can still be powerful for smaller organizations or for specific ad-hoc analysis.
The choice of tool depends on the complexity of the organization, the volume of data, and the desired level of reporting automation and interactivity.
Visualizing Financial Data for Insight
Raw data tables can be overwhelming. Effective KPI reports employ strong data visualization to highlight key trends, comparisons, and outliers. Charts, graphs, and dashboards make complex financial information accessible and understandable at a glance.
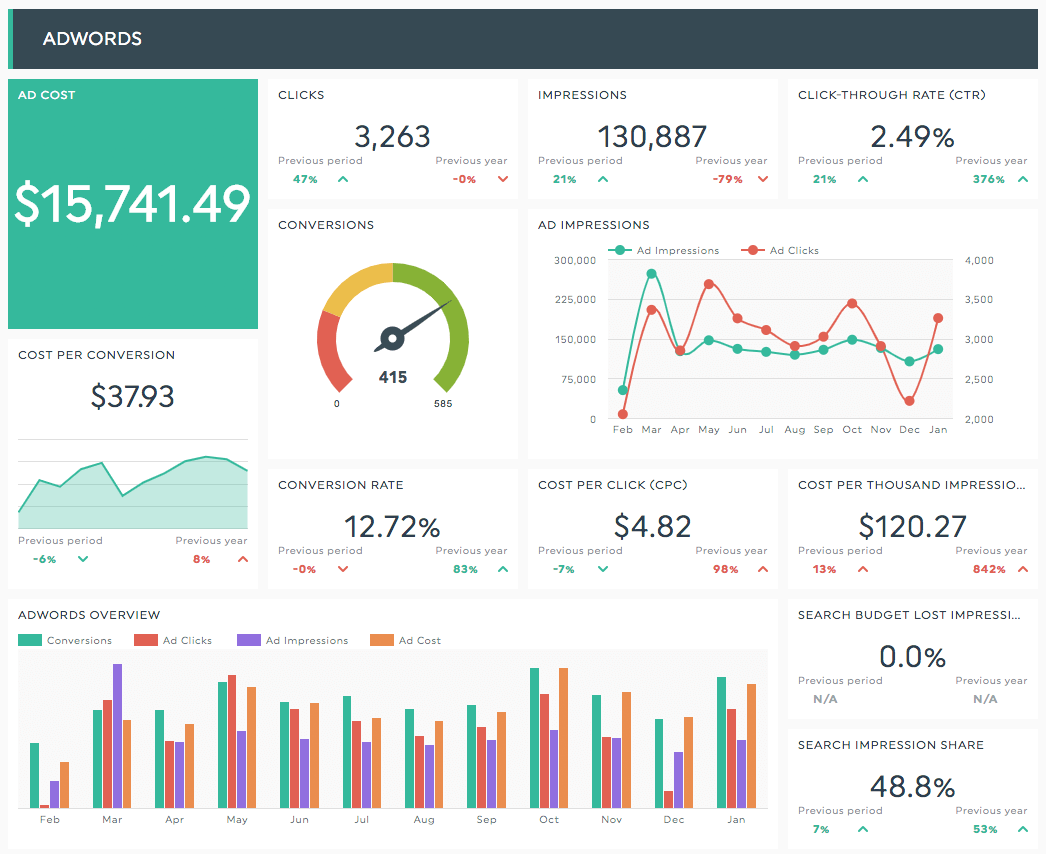
- Trend Lines: Ideal for showing changes in KPIs over time (e.g., revenue growth month-over-month).
- Bar Charts: Excellent for comparing different categories or periods (e.g., gross profit margin across different product lines).
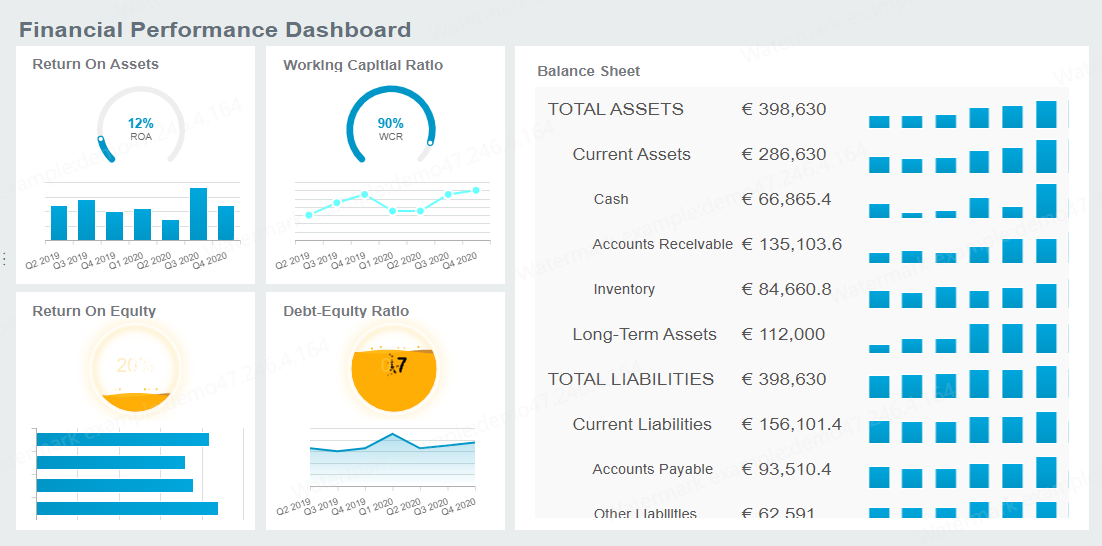
- Gauge Charts/Scorecards: Provide a quick visual of performance against a target, often used for critical KPIs.
- Heatmaps: Useful for identifying patterns in large datasets or comparing performance across multiple dimensions.
Well-designed visualizations simplify complex financial narratives, making it easier for decision-makers to quickly grasp critical information and identify areas for intervention.
Driving Strategic Financial Decisions with KPI Reports
The ultimate purpose of KPI reports is to inform and drive strategic decision-making. By providing a clear, evidence-based picture of financial performance, these reports empower leaders to navigate challenges and seize opportunities.
Identifying Trends and Anomalies
Regularly reviewing KPI reports enables businesses to spot emerging financial trends—both positive and negative. A consistent decline in net profit margin, for example, signals a need to investigate cost structures or pricing. Conversely, a sustained increase in asset turnover might indicate improved operational efficiency. Reports also help in identifying anomalies, such as an unexpected spike in operating expenses or a sudden drop in cash flow, prompting immediate investigation and corrective action. This foresight is invaluable in preventing minor issues from escalating into significant financial problems.
Benchmarking and Goal Setting
KPI reports facilitate benchmarking, allowing businesses to compare their financial performance against industry averages, competitors, or their own historical data. This context is crucial for understanding whether performance is genuinely good or bad. For instance, a 5% net profit margin might seem low in isolation, but if the industry average is 3%, it’s a strong performance. Benchmarking provides a realistic basis for setting future financial goals that are both ambitious and achievable, driving continuous improvement in areas like cost management, revenue generation, and capital efficiency.
Enhancing Accountability and Performance
By clearly defining what success looks like through specific KPIs, reports create a framework for accountability. Departments, teams, and individuals can be assigned responsibility for metrics directly within their control. For example, a sales team might be accountable for revenue growth rate, while an operations team might focus on inventory turnover. Regular KPI reporting then becomes a mechanism for tracking performance against these responsibilities, identifying areas where support or intervention is needed, and recognizing achievements. This fosters a performance-driven culture where financial goals are transparent and everyone understands their role in achieving them.
The Future of Financial KPI Reporting
The landscape of financial reporting is continually evolving, driven by technological advancements and the increasing demand for real-time, predictive insights.
Automation and AI in Financial Analysis
The future of KPI reports increasingly lies in automation and artificial intelligence (AI). Automated data extraction, cleansing, and report generation reduce manual effort and human error, allowing finance teams to focus on analysis rather than data preparation. AI and machine learning algorithms are beginning to play a significant role in identifying subtle patterns, forecasting future financial performance with greater accuracy, and even flagging potential risks that might be overlooked by human analysts. These technologies are making KPI reporting more efficient, insightful, and predictive.
Real-time Reporting and Predictive Analytics
Traditional financial reports often provide a retrospective view. However, the demand for real-time KPI reporting is growing, enabling businesses to react instantly to changing market conditions or internal performance shifts. Cloud-based financial tools and integrated data platforms facilitate this immediacy. Furthermore, the emphasis is shifting towards predictive analytics. Instead of merely showing what has happened, advanced KPI reports, powered by AI and sophisticated statistical models, will increasingly aim to predict what will happen, offering insights into future cash flow, revenue, and profitability. This transition from descriptive to predictive analytics will empower businesses with unparalleled foresight, allowing for truly proactive financial management and strategic planning.
aViewFromTheCave is a participant in the Amazon Services LLC Associates Program, an affiliate advertising program designed to provide a means for sites to earn advertising fees by advertising and linking to Amazon.com. Amazon, the Amazon logo, AmazonSupply, and the AmazonSupply logo are trademarks of Amazon.com, Inc. or its affiliates. As an Amazon Associate we earn affiliate commissions from qualifying purchases.