
In the dynamic world of professional baseball, performance metrics are the bedrock of evaluation, strategy, and even fan engagement. Among the pantheon of statistics, one acronym, OPS, has ascended to particular prominence, often cited as a crucial measure of a player’s offensive value. While its meaning is straightforward—On-base Plus Slugging—its emergence as a standard metric is deeply intertwined with the digital revolution that has transformed sports analytics. Understanding OPS in the modern era means recognizing the underlying technological infrastructure that collects, processes, and presents such complex data, enabling insights far beyond the traditional box score.

The Digital Transformation of Baseball Analytics
Baseball, often dubbed America’s pastime, has undergone a profound analytical transformation, moving from subjective scouting and rudimentary statistics to a data-driven science. This shift is not merely about new formulas but about the technological advancements that enable their creation, computation, and dissemination.
From Manual Scoring to Big Data Infrastructure
For decades, baseball statistics were meticulously compiled through manual scorekeeping, yielding basic counts like hits, runs, and errors. The introduction of personal computers in the late 20th century marked a pivotal moment, allowing for more efficient data entry and simple calculations. However, the true revolution began with the advent of robust database management systems, advanced sensor technologies, and high-speed data transmission networks. Today, every single play, pitch, and swing is captured by an array of sophisticated tools—from high-definition cameras and radar systems (like Statcast) to biomechanical sensors. This granular data, amounting to petabytes of information annually, forms the “big data” backbone upon which modern baseball analytics, including the calculation of OPS, is built. Without this comprehensive data capture and storage infrastructure, nuanced metrics would be impossible to derive and analyze.
The Rise of Sabermetrics and Software Tools
The term “sabermetrics,” coined by baseball historian Bill James, refers to the empirical analysis of baseball, especially baseball statistics that measure in-game activity. Initially, sabermetricians often worked with limited public data, crunching numbers on early spreadsheet software or custom-built programs. However, the proliferation of powerful analytical software, programming languages like R and Python, and cloud-based computing platforms has democratized and amplified sabermetrics. These tools allow analysts to develop complex algorithms, run simulations, and identify previously unseen patterns in player performance. OPS itself is an early example of a sabermetric stat that gained mainstream acceptance, proving the value of looking beyond traditional metrics. Its rise paved the way for even more advanced, technologically intensive metrics, all powered by sophisticated data processing and visualization software.
Deconstructing OPS: A Technologically-Enabled Metric
OPS isn’t just a simple addition; it’s a composite statistic whose components, On-base Percentage and Slugging Percentage, represent distinct aspects of offensive value. The ability to precisely calculate and integrate these components reliably across millions of data points is a testament to modern data processing capabilities.
On-base Percentage: A Data-Driven Evolution
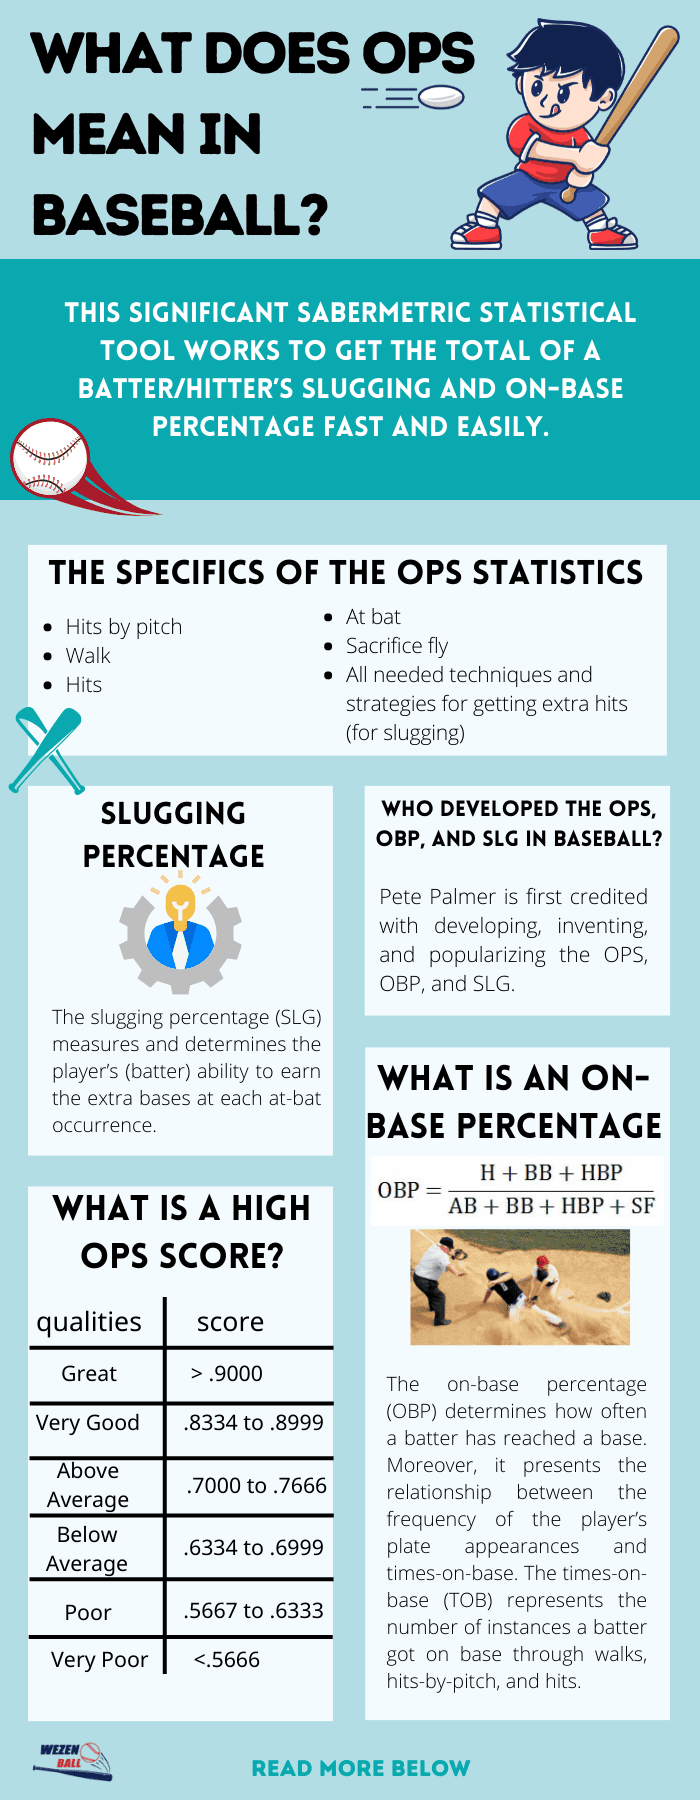
On-base Percentage (OBP) measures how frequently a player reaches base via a hit, walk, or hit-by-pitch. Its formula—(Hits + Walks + Hit by Pitch) / (At Bats + Walks + Hit by Pitch + Sacrifice Flies)—requires careful tracking of multiple discrete events. In the pre-digital age, accurately tallying walks and hit-by-pitches in conjunction with at-bats and sacrifice flies across an entire season for every player was a laborious task, prone to error. Today, dedicated software platforms automatically categorize every play outcome. When a player draws a walk, is hit by a pitch, or hits a single, the event is immediately logged and fed into a central database. These systems perform real-time aggregation and calculation, ensuring OBP is always up-to-date and accurate, reflecting the player’s capacity to avoid outs and create scoring opportunities.
Slugging Percentage: Quantifying Power with Precision
Slugging Percentage (SLG) quantifies the total number of bases a player records per at-bat. It’s calculated as (Singles + 2x Doubles + 3x Triples + 4x Home Runs) / At-bats. Unlike batting average, which only counts hits, SLG weights hits by their base value, thereby giving more credit to extra-base hits. The calculation of SLG demands the precise identification and categorization of every hit type. Modern analytics systems utilize machine vision and advanced algorithms to distinguish between singles, doubles, triples, and home runs with impeccable accuracy. These systems track the ball’s trajectory, landing spot, and the runner’s progress, ensuring that each hit is correctly classified. The ability of software to instantaneously apply these weights and sum total bases across thousands of plate appearances provides an immediate and precise measure of a player’s power-hitting ability.
The Synergy of On-base and Slugging in Software Platforms
OPS, as the sum of OBP and SLG, combines a player’s ability to get on base with their ability to hit for power. This composite nature is what makes it such a valuable indicator, and its widespread adoption is largely due to the seamless integration offered by modern statistical software. Rather than performing two separate, manual calculations and then adding them, today’s sports analytics platforms are designed to compute both OBP and SLG concurrently from the same raw data streams. They then automatically sum these values to present OPS in real-time. This integration ensures consistency, reduces human error, and allows for instantaneous updates across various interfaces, from team analytical dashboards to public sports statistics websites and fantasy sports applications. The synergy is not just conceptual but built into the very architecture of the software designed for baseball statistics.
How Technology Calculates and Visualizes Advanced Statistics
The journey from raw event data to a meaningful statistic like OPS involves a sophisticated technological pipeline. This pipeline ensures that statistics are not only accurate but also accessible and actionable for various stakeholders.
Data Ingestion and Processing Pipelines
The first step in generating statistics like OPS is robust data ingestion. High-frequency sensor data, pitch-tracking information, and video analysis outputs are continuously streamed into centralized data lakes. Here, advanced Extract, Transform, Load (ETL) processes clean, normalize, and structure the raw data. This involves identifying and correcting anomalies, standardizing event classifications, and linking disparate data sources. For example, a single pitch might generate data from multiple cameras and radar guns, all of which need to be synchronized and aggregated. Cloud computing resources provide the scalability and computational power necessary to handle this massive influx and prepare it for analysis.
Algorithmic Computation and Real-time Updates
Once the data is processed, proprietary algorithms and statistical models are applied to compute metrics. For OPS, this means not only the direct calculation of OBP and SLG but also potentially contextualizing these numbers. For instance, advanced models might adjust OPS for park factors, league average, or opponent quality. These computations are often performed in real-time or near real-time, especially during games, providing immediate feedback for broadcasters, coaches, and fans. Database technologies, often leveraging in-memory computing or NoSQL databases for speed, are critical for delivering these lightning-fast updates, allowing analysts to track a player’s OPS rise or fall with every plate appearance.
Interactive Dashboards and Predictive Modeling
The ultimate goal of complex statistical calculations is to provide actionable insights. Technology facilitates this through interactive data visualization dashboards. These platforms allow users—coaches, scouts, general managers, and even players—to explore statistics like OPS through various filters, compare players, and track trends over time. Users can slice and dice data by specific game situations, handedness of pitcher, or even field dimensions. Beyond descriptive analytics, machine learning algorithms leverage historical OPS data, alongside hundreds of other metrics, to build predictive models. These models forecast future player performance, project career trajectories, and inform critical decisions in player acquisition, contract negotiations, and in-game strategy. The ease with which these models can be built, trained, and deployed is a direct outcome of advancements in AI and data science tooling.
The Broader Implications of OPS and Tech in Modern Baseball
The integration of OPS into mainstream baseball parlance is emblematic of how technology has reshaped the sport, influencing everything from player evaluation to fan engagement.
Player Evaluation and Scouting Software
Scouting in modern baseball is no longer solely about the “eye test.” While subjective observation remains valuable, it is now rigorously complemented by objective data provided by analytical software. OPS, alongside a multitude of other advanced statistics, is a key component in a scout’s toolkit. Custom-built scouting software platforms integrate player profiles with a wealth of statistical data, video clips, and physiological measurements. These platforms allow teams to filter potential draft picks or trade targets based on specific OPS thresholds, compare players against historical benchmarks, and identify undervalued talent. The ability to access, manipulate, and analyze such comprehensive data ensures more informed and objective player evaluation decisions.
Strategic Decision-Making with AI
In-game and long-term strategic decisions are increasingly driven by advanced analytics and artificial intelligence. Coaches and front offices use software models that simulate game outcomes, optimize lineups, and predict probabilities of success based on player statistics, including OPS. For instance, an AI model might recommend a specific pinch-hitter based on their historical OPS against a particular type of pitcher in a high-leverage situation. Over the long term, AI-powered roster construction tools leverage OPS projections to identify player combinations that maximize team performance within budget constraints, demonstrating the tangible impact of statistical acumen enabled by cutting-edge technology.

Engaging Fans with Data-Rich Experiences
The digital age has also transformed how fans interact with baseball. Broadcasters, sports journalists, and dedicated fan apps now regularly display advanced statistics like OPS, often accompanied by intuitive visualizations and real-time updates. Websites and streaming services offer interactive interfaces where fans can delve into player stats, compare historical data, and even build their own fantasy teams based on analytical insights. This data-rich environment not only educates fans but also deepens their understanding and appreciation of the game, fostering a more engaged and analytically sophisticated audience, all made possible by the seamless integration and presentation of complex statistical data through advanced digital platforms.
aViewFromTheCave is a participant in the Amazon Services LLC Associates Program, an affiliate advertising program designed to provide a means for sites to earn advertising fees by advertising and linking to Amazon.com. Amazon, the Amazon logo, AmazonSupply, and the AmazonSupply logo are trademarks of Amazon.com, Inc. or its affiliates. As an Amazon Associate we earn affiliate commissions from qualifying purchases.