
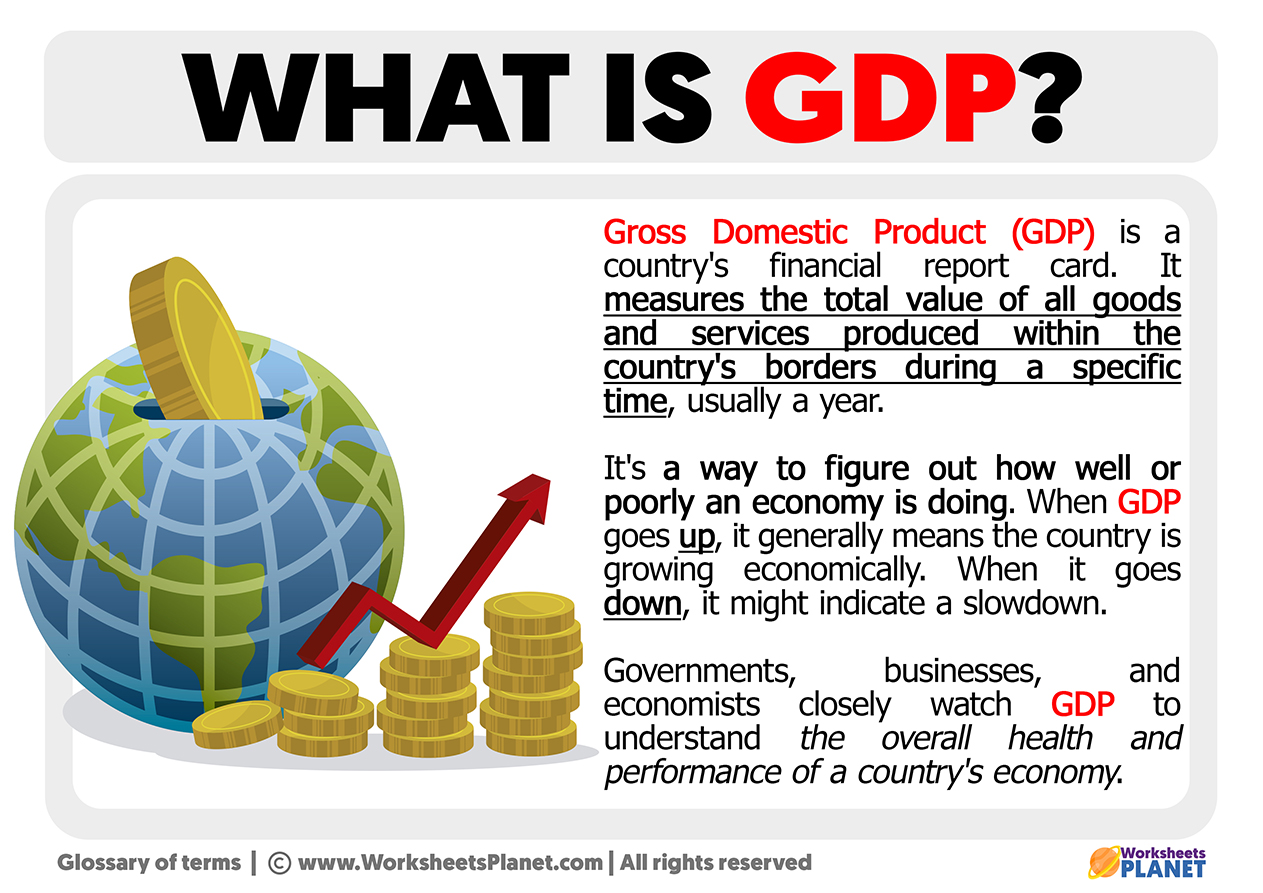
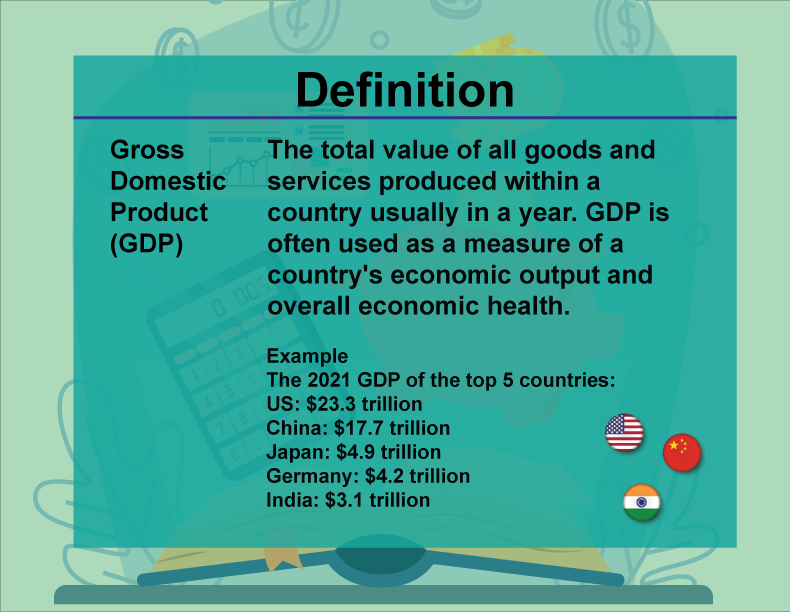
Gross Domestic Product, or GDP, is one of the most frequently cited economic terms, yet its true meaning and implications can often seem complex. In essence, GDP is the ultimate scorecard for a country’s economic health, providing a snapshot of its productivity and prosperity. It’s a critical metric for policymakers, businesses, investors, and even individuals trying to understand the broader financial landscape. Simply put, GDP represents the total monetary value of all finished goods and services produced within a country’s borders over a specific period, typically a quarter or a year.
Think of it as a nation’s economic output; every time a product is manufactured, a service is rendered, or a sale is made within a country, it contributes to this grand total. Understanding GDP is fundamental to grasping how economies grow, why recessions occur, and what influences everything from job prospects to investment returns.
The Core Concept: Measuring Economic Health
At its heart, GDP is a measure of a country’s economic activity. It compiles the market value of all tangible goods – from cars and computers to apples and airplanes – and intangible services – like healthcare, education, legal advice, and entertainment – that are produced within a nation’s geographical confines. The key phrases here are “finished goods and services” and “within a country’s borders.”
The inclusion of “finished goods and services” is crucial to avoid double-counting. For example, the value of the tires sold to a car manufacturer is not counted in GDP; only the final value of the car sold to the consumer is. This ensures that the true economic value generated is captured without inflating figures by counting intermediate steps multiple times. Similarly, “within a country’s borders” means that even if a foreign-owned company operates a factory in the United States, its output contributes to U.S. GDP. Conversely, the profits of a U.S.-owned company operating overseas do not count towards U.S. GDP, but rather towards the GDP of the country where the production occurred.
GDP serves as a vital benchmark for economists and analysts to gauge whether an economy is expanding, contracting, or remaining stable. A growing GDP generally signals a healthy economy with rising incomes, increased employment, and greater consumer spending. Conversely, a declining GDP often indicates economic contraction, potentially leading to job losses and reduced business activity. It’s the most widely recognized indicator for comparing the economic size and performance of different nations.
What’s Included (and Excluded) in GDP Calculation?
To arrive at the comprehensive figure of GDP, economists typically employ one of three main approaches: the expenditure approach, the income approach, and the production (or output) approach. While all three methods should theoretically yield the same result, the expenditure approach is arguably the most intuitive and widely used for explanation, as it directly reflects how money is spent in an economy.
The Expenditure Approach: C+I+G+NX
This formula breaks down GDP into four main components, representing the total spending on finished goods and services within an economy:
-
C (Consumption): This is the largest component of GDP in most developed economies, representing all private household spending on goods and and services. It includes durable goods (like cars and appliances), non-durable goods (like food and clothing), and services (like haircuts, medical care, and education). Consumer confidence and purchasing power significantly influence this component. When consumers are optimistic about their financial future, they tend to spend more, boosting consumption.
-
I (Investment): Don’t confuse this with financial investments like buying stocks or bonds. In GDP terms, “investment” refers to business spending on capital goods and residential construction. This includes businesses purchasing new machinery, equipment, software, or constructing new factories, as well as households buying new homes. This component is crucial for future economic growth, as it signifies businesses’ confidence in expanding their productive capacity.
-
G (Government Spending): This component includes all spending by local, state, and federal governments on goods and services. Examples include government employee salaries, infrastructure projects (roads, bridges), defense spending, and public education. However, it’s important to note that government transfer payments, such as social security benefits, unemployment insurance, or welfare payments, are not included. These are simply transfers of existing wealth and do not represent new production of goods or services.
-
NX (Net Exports): This is calculated as a country’s total exports minus its total imports.
- Exports: Goods and services produced domestically but sold to foreign buyers. Exports add to a country’s GDP because they represent domestic production.
- Imports: Goods and services produced abroad but purchased by domestic consumers, businesses, or governments. Imports are subtracted because they represent money flowing out of the domestic economy and goods produced elsewhere. If a country imports more than it exports, it has a trade deficit, which subtracts from its GDP. Conversely, a trade surplus (exports exceed imports) adds to GDP.
The formula GDP = C + I + G + NX thus provides a comprehensive overview of where economic activity is happening through spending.
Other Calculation Methods (Brief Mention)
While the expenditure approach is commonly used, it’s worth noting the other two methods:
- The Income Approach: This sums up all the income earned from the production of goods and services within the country. This includes wages, salaries, profits, rent, and interest.
- The Production (or Output) Approach: This measures the total value of goods and services produced, subtracting the value of intermediate goods used in the production process (to avoid double-counting). This focuses on the “value added” at each stage of production.
All these methods aim to quantify the same economic reality, offering different lenses through which to view a nation’s productivity.
Why Does GDP Matter to You?
GDP is not just an abstract economic number; its fluctuations have tangible effects on various aspects of daily life and financial decisions. Understanding its significance can empower better financial planning, business strategy, and investment choices.
For Businesses and Investors
For businesses, GDP growth signals an expanding market, potentially leading to increased sales, higher profits, and opportunities for expansion and hiring. A strong GDP environment can encourage businesses to invest in new equipment, research and development, and talent acquisition, fueling further economic momentum. Conversely, a shrinking GDP often leads to reduced consumer demand, lower sales, and potentially cost-cutting measures, including layoffs or deferred investments.
Investors closely monitor GDP reports because they provide crucial insights into corporate earnings and overall market direction. Strong GDP growth typically correlates with a robust stock market as companies perform well. It also influences interest rates, bond yields, and currency values. For instance, a country with consistently high GDP growth may attract foreign investment, strengthening its currency. Conversely, a weak GDP outlook might prompt investors to pull funds, leading to market downturns. Knowing the GDP trajectory helps investors make informed decisions about where to allocate capital, whether in domestic or international markets, or across different asset classes.
For Everyday Consumers and Job Seekers
For the average person, GDP directly impacts job prospects, income levels, and overall financial security. A healthy, growing GDP generally means:
- More Jobs: Expanding businesses need more employees, leading to lower unemployment rates and a more competitive job market for workers.
- Higher Wages: With increased demand for labor, employees often see wage increases and better benefits.
- Improved Consumer Confidence: People feel more secure about their jobs and financial future, encouraging them to spend more, which in turn fuels further economic activity.
Conversely, during periods of GDP contraction (a recession), job losses become more common, wage growth stagnates, and consumer confidence wanes. This can lead to increased personal financial stress and reduced spending, creating a challenging environment for households.
For Government Policy and Public Services
Governments rely on GDP data to formulate fiscal and monetary policies. A slowing GDP might prompt governments to implement fiscal stimulus packages (e.g., increased public spending, tax cuts) or central banks to lower interest rates to encourage borrowing and investment. Conversely, an overheating economy with rapid GDP growth and rising inflation might lead to tighter monetary policies (e.g., interest rate hikes) to cool down the economy.
Furthermore, a nation’s GDP is intrinsically linked to its capacity to fund public services. A larger GDP base typically translates into higher tax revenues, allowing governments to invest more in critical areas such as education, healthcare, infrastructure, and social welfare programs. It’s also a benchmark for comparing a country’s economic standing and development against other nations, influencing international aid, trade agreements, and geopolitical strategies.
Understanding GDP Growth and Fluctuations
Not all GDP figures are created equal. To accurately interpret economic performance, it’s essential to understand the distinction between different types of GDP and the broader economic cycles.
Real vs. Nominal GDP
When GDP is initially calculated, it’s typically presented as Nominal GDP. This measures the value of goods and services at current market prices. The challenge with nominal GDP is that it can increase simply due to inflation (rising prices) rather than an actual increase in the quantity of goods and services produced. If prices double but the actual output remains the same, nominal GDP would double, giving a misleading impression of economic growth.
To get a clearer picture of actual economic growth, economists use Real GDP. This figure adjusts nominal GDP for inflation, effectively removing the impact of price changes. By using a base year’s prices, real GDP allows for an apples-to-apples comparison of economic output over time. When analysts talk about economic growth or recession, they are almost always referring to changes in real GDP, as it truly reflects changes in the volume of goods and services produced. A positive real GDP growth indicates that an economy is producing more, while negative real GDP growth signals a contraction.
Economic Cycles: Booms and Busts
Economies rarely grow at a perfectly steady rate. Instead, they typically move through predictable phases known as business cycles, characterized by fluctuations in real GDP:
- Expansion: A period of economic growth where real GDP increases, accompanied by rising employment, income, and consumer spending.
- Peak: The highest point of economic activity before a downturn.
- Contraction (Recession): A period of economic decline where real GDP falls for at least two consecutive quarters (six months). During a recession, unemployment rises, and businesses often face reduced profits and investment.
- Trough: The lowest point of economic activity before recovery begins.
Understanding these cycles is vital for businesses and investors to anticipate changes and for governments to implement timely policies aimed at moderating the swings, such as stimulating growth during a recession or curbing inflation during an overheating expansion.

Limitations and Alternative Metrics
While GDP is an invaluable economic indicator, it is not without its limitations. It provides a purely economic measure and doesn’t capture the full picture of societal well-being or progress.
Key limitations include:
- Income Inequality: A high GDP doesn’t necessarily mean wealth is evenly distributed. A few individuals or corporations could be driving the growth, while a large segment of the population struggles.
- Non-Market Activities: It doesn’t account for unpaid work like volunteering, household chores, or childcare, which contribute significantly to society.
- Informal Economy: Economic activities that are unregistered or untaxed (e.g., illicit trade, unreported cash transactions) are not included.
- Environmental Impact: GDP doesn’t factor in the environmental costs of production, such as pollution or resource depletion. Economic growth might come at the expense of ecological health.
- Quality of Life: It doesn’t measure happiness, health, education levels, or other aspects that contribute to a high quality of life. A country could have a high GDP but poor public health outcomes or low life satisfaction.
Recognizing these limitations, other metrics have been developed to complement or provide alternative perspectives on national well-being. These include the Human Development Index (HDI), which considers life expectancy, education, and living standards; the Genuine Progress Indicator (GPI), which accounts for environmental and social costs; and even Gross National Happiness (GNH), pioneered by Bhutan, which prioritizes holistic development.
Despite these limitations, GDP remains the most widely accepted and comprehensive single measure of a nation’s economic output. It provides a foundational understanding of economic performance, influencing countless decisions across personal finance, business strategy, and national policy.
aViewFromTheCave is a participant in the Amazon Services LLC Associates Program, an affiliate advertising program designed to provide a means for sites to earn advertising fees by advertising and linking to Amazon.com. Amazon, the Amazon logo, AmazonSupply, and the AmazonSupply logo are trademarks of Amazon.com, Inc. or its affiliates. As an Amazon Associate we earn affiliate commissions from qualifying purchases.