
In the fast-paced world of algorithmic trading and financial analysis, “period math” represents the foundational quantitative framework used to normalize raw data into actionable insights. At its core, period math is the mathematical process of defining, smoothing, and analyzing data sets over specific, repeating intervals of time. Whether you are managing a personal portfolio or overseeing corporate liquidity, understanding how time-series data is sliced into “periods” is the difference between noise and signal.
The Quantitative Anatomy of Time-Series Data
Financial markets generate an overwhelming amount of data every second. To make sense of this information, analysts use period math to transform infinite streams of price or volume data into discrete, manageable units. A “period” can be defined as a single second, a minute, an hour, a day, or a fiscal quarter. The primary objective of period math is to strip away short-term volatility to reveal underlying trends.
Defining the Interval
The selection of an interval is the first step in any quantitative analysis. If the interval is too small, the data remains noisy and prone to “whipsaw” effects, where false signals lead to poor decision-making. If the interval is too large, the analysis suffers from lag—the data becomes a historical artifact rather than a predictive tool. Period math requires a rigorous justification for why a specific window (such as a 20-day moving average) is chosen over another.
Normalization and Standard Deviation
Once an interval is selected, period math employs normalization techniques to compare disparate assets. By calculating the standard deviation of price movements within a specific period, analysts can determine the “volatility profile” of an asset. This is critical for risk management, as it allows investors to normalize their exposure based on how much an asset typically deviates from its mean within a given window.
Moving Averages and Smoothing Algorithms
The most common application of period math in finance is the construction of moving averages. These are not merely lines on a chart; they are sophisticated statistical filters that leverage period math to reduce the impact of outliers.
Simple Moving Averages (SMA)
The SMA is the arithmetic mean of a given set of prices over a specific number of periods. For example, a 50-day SMA takes the closing prices of the last 50 periods and divides by 50. This process effectively smooths out the “period jitter”—the random, non-directional movements that occur within a market day. By applying this math, analysts identify the “trend direction” rather than reacting to the “trend tick.”
Exponential Moving Averages (EMA)
While SMAs treat all periods within the calculation equally, EMA applies a multiplier to prioritize more recent data. This is where period math becomes dynamic. By assigning greater weight to the most recent period, the EMA responds faster to price changes than the SMA. This mathematical weighting is essential for high-frequency trading, where the relevance of data decays rapidly over time.
The Role of Time-Decay in Period Math
In options trading and derivative pricing, period math involves the concept of Theta, or time decay. As an option contract approaches its expiration period, the mathematical value of the contract changes at an accelerating rate. Traders use period math to calculate the “time premium” of an asset, determining whether the current market price accounts for the remaining lifespan of the instrument.
Forecasting and Predictive Modeling
Beyond descriptive analysis, period math is the engine behind predictive modeling. By understanding how an asset behaved over a series of historical periods, quantitative analysts build models that project future ranges.
Autoregressive Integrated Moving Average (ARIMA)
ARIMA is a class of models that captures various standard temporal structures in time series data. It uses period math to identify autocorrelation—the degree to which the value of an asset in the current period is related to its value in previous periods. By “differencing” the data to remove trends and seasonality, analysts can forecast future price movements with a quantified level of confidence.
Seasonality and Periodic Cycles
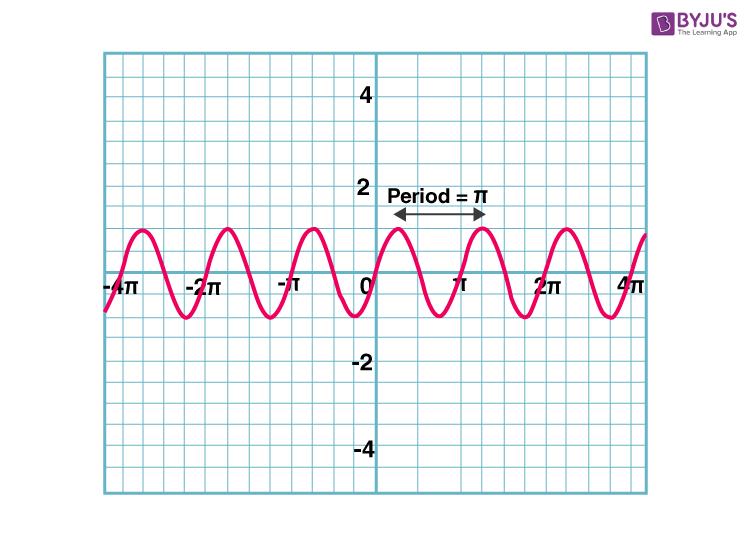
Many assets exhibit periodic behavior—recurring patterns that occur at specific intervals. Period math allows analysts to isolate these cycles, such as the “end-of-quarter effect” or annual retail spending surges. By applying a Fourier transform or other spectral analysis techniques to time-series data, analysts can break down a complex price signal into a set of simpler, periodic waves. This allows firms to allocate capital more efficiently by anticipating when a specific asset will enter a period of high or low demand.
Risk Management and the “Period-at-Risk”
Perhaps the most vital application of period math is in the calculation of Value at Risk (VaR). Financial institutions must report the potential loss of their portfolios over specific time horizons.
The Time Horizon Constraint
The “Time Horizon” in VaR calculations is the ultimate application of period math. If a bank calculates its risk over a one-day period, it assumes the portfolio can be liquidated within that timeframe. If market liquidity dries up, the period math changes; the firm must extend its horizon, which mathematically increases the potential for loss. Understanding the relationship between the period length and the probability of a “tail event” (a market crash) is a cornerstone of institutional risk management.
Volatility Clustering
Period math also accounts for the reality that volatility is not constant. Financial history shows that periods of high volatility tend to cluster together. Using GARCH (Generalized Autoregressive Conditional Heteroskedasticity) models, analysts use period math to forecast future volatility based on past periods of variance. This allows for dynamic position sizing—reducing exposure when the math indicates the current period is becoming unstable.
Algorithmic Execution and Latency
In the age of electronic trading, period math has moved from the ledger to the processor. Algorithms execute thousands of trades based on sub-millisecond period math.
The Micro-Period Advantage
When trading at a scale of microseconds, period math must account for network latency and execution speed. Algorithms analyze the “order book imbalance” within these microscopic periods to determine if there is an immediate price movement incoming. The math here is precise: it looks at the ratio of buy orders to sell orders within a specific window and executes trades before the aggregate market has a chance to recalibrate.
Optimization of Period Parameters
Machine learning models are now used to “learn” the optimal period length for various market conditions. Instead of relying on static 50-day or 200-day averages, modern quantitative systems treat the period length as a variable that evolves. When market conditions are stable, the system might widen the period to reduce sensitivity; when the market becomes turbulent, the system automatically shortens the period to increase responsiveness. This adaptive period math is the current frontier of quantitative finance.

Conclusion: The Precision of Time
Period math is the framework that translates the chaos of global commerce into a structured language. By defining the temporal bounds of our analysis, we gain the ability to predict, manage, and exploit the flow of value. Whether you are smoothing data to identify a long-term trend or optimizing a high-speed algorithm to capitalize on a micro-second imbalance, the principles remain the same: the truth of a market is hidden in the intervals. By mastering the math of these periods, investors and businesses move away from subjective guessing and toward a disciplined, data-driven approach to financial success. The complexity of modern markets will only increase, making the ability to accurately segment, weight, and project data over time the most valuable skill in any financial toolkit.
aViewFromTheCave is a participant in the Amazon Services LLC Associates Program, an affiliate advertising program designed to provide a means for sites to earn advertising fees by advertising and linking to Amazon.com. Amazon, the Amazon logo, AmazonSupply, and the AmazonSupply logo are trademarks of Amazon.com, Inc. or its affiliates. As an Amazon Associate we earn affiliate commissions from qualifying purchases.