
Data is the lifeblood of modern business, yet the ability to harness it begins long before a dashboard is built or an algorithm is trained. It starts with the way we frame our inquiries. In the world of business intelligence and data-driven strategy, a “statistical question” is the fundamental bridge between raw information and actionable insight. If your organization is struggling to move the needle on key performance indicators (KPIs), the problem likely isn’t the quality of your data, but the quality of the questions you are asking of it.
The Anatomy of a Statistical Question
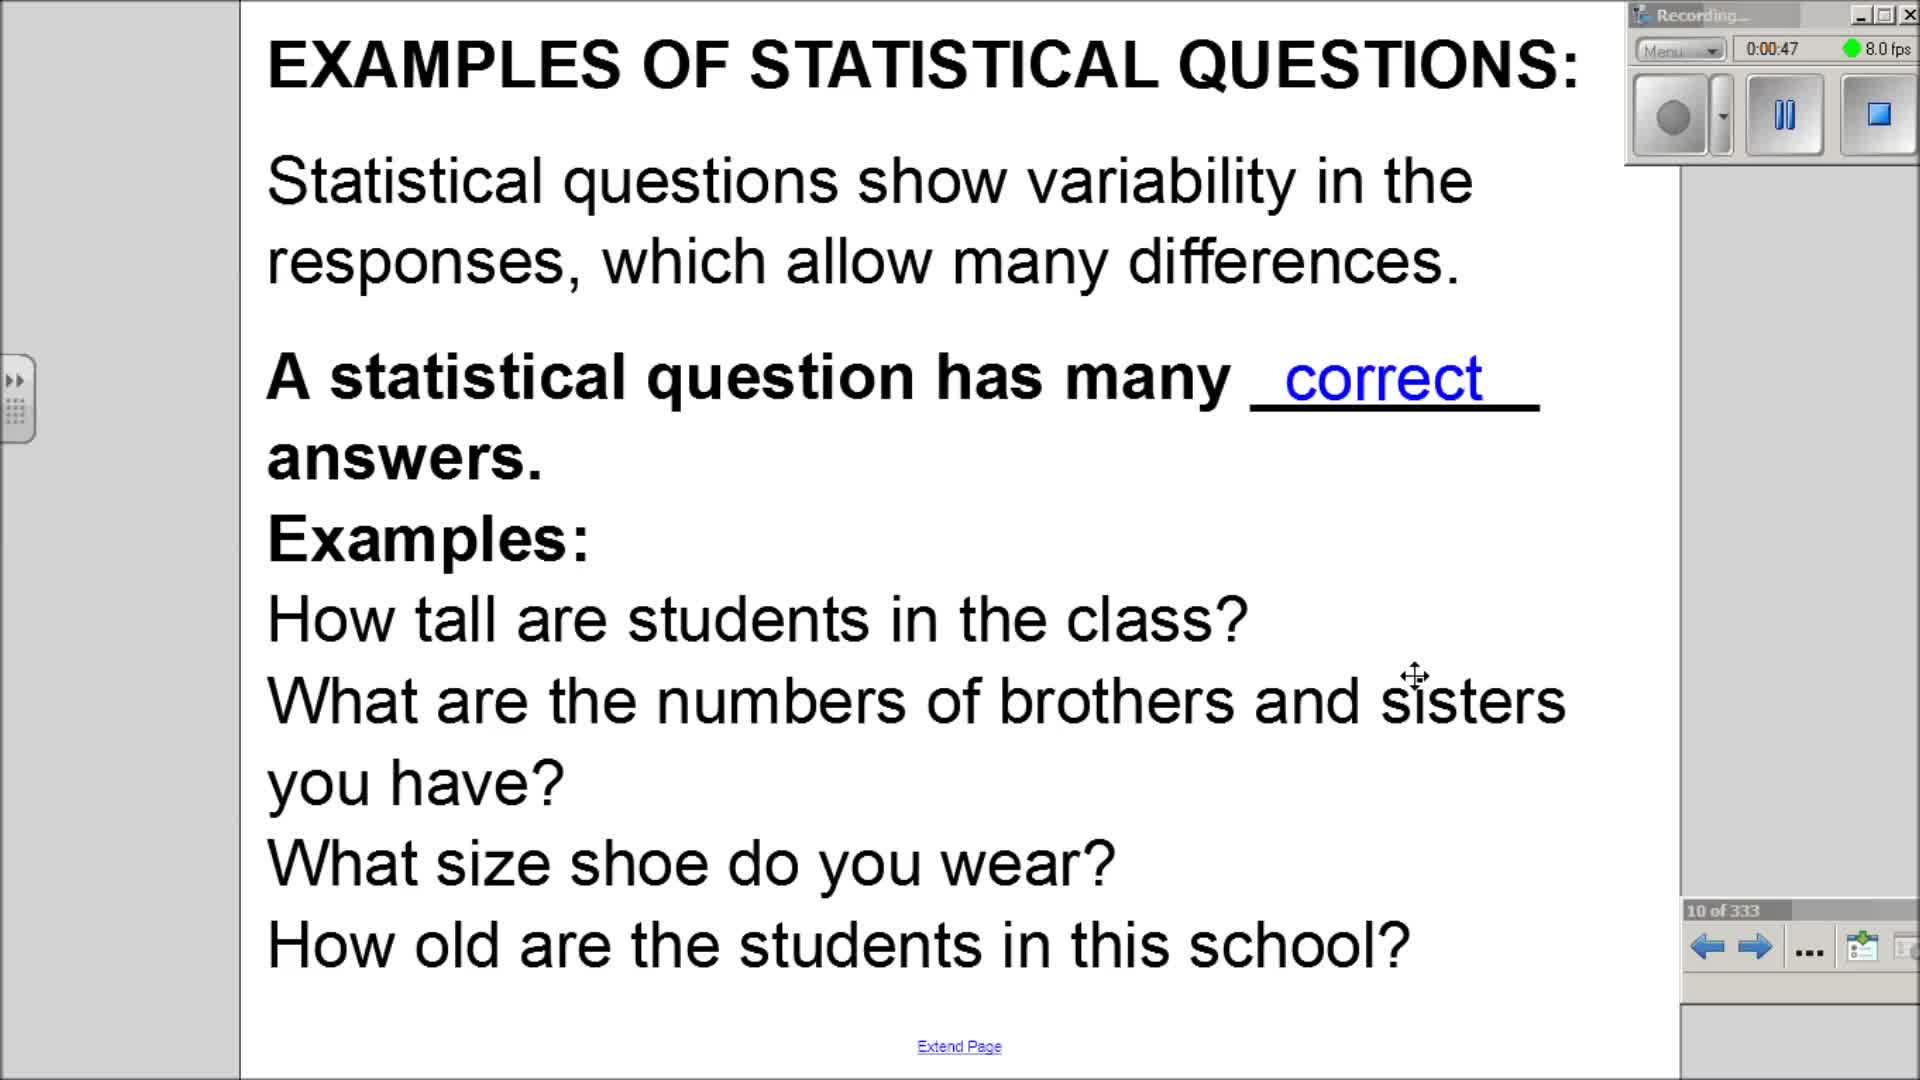
A statistical question is defined by its inherent expectation of variability. Unlike a deterministic question—which seeks a single, fixed, and factual answer—a statistical question anticipates that the data collected will vary from person to person, unit to unit, or time period to time period.
Deterministic vs. Statistical Inquiries
To understand what constitutes a statistical question, one must first distinguish it from a deterministic one. A deterministic question asks for a specific, singular fact: “How many employees are currently enrolled in our health insurance plan?” The answer is a single number, verified by a count. There is no variability to account for; it is an administrative tally.
In contrast, a statistical question acknowledges that the answer is not a single point, but a distribution. For example, “What is the average duration of our client onboarding process?” is a statistical question. One client might take three days, while another takes ten. The data fluctuates, and by analyzing this variability, we move from reporting static facts to understanding operational patterns.
The Role of Variability in Data Strategy
Variability is not “noise”—it is the core component of business intelligence. When we ask statistical questions, we are purposefully looking for the range, the mean, the median, and the outliers. If your business strategy treats every data point as an absolute truth rather than a sample of a larger, variable reality, you will inevitably misinterpret trends. Statistical thinking requires an acceptance that no single data point defines the whole, but the collective distribution tells a story of performance, risk, and opportunity.
Why Your Business Strategy Needs Statistical Literacy
In a corporate environment, many decisions are made based on intuition or anecdotal evidence. While human experience is valuable, it is rarely scalable. Shifting from anecdotal decision-making to data-driven governance requires a shift in how stakeholders frame their objectives.
Moving Beyond “How Many?”
Most corporate reporting is fixated on totals. “What was our revenue this quarter?” or “How many leads did marketing generate?” These are essential questions, but they are not statistical questions. They provide a rearview mirror perspective. To look forward, businesses must ask questions that incorporate variability: “How does our customer churn rate correlate with the specific software version utilized by the client?”
By introducing variables—software version, client industry, acquisition channel—you turn a descriptive inquiry into a statistical one. This allows for segmentation and predictive modeling. You are no longer asking for a static sum; you are asking how different factors influence a variable outcome.
Mitigating Cognitive Bias with Data
One of the most dangerous traps in business management is confirmation bias—the tendency to look for data that supports a pre-existing belief. Statistical questions act as a safeguard against this. When you frame your project as a statistical inquiry, you must define the population, the sample, and the expected range of variance before the analysis even begins.
If you ask, “Is our new marketing campaign successful?” you are prone to interpret any positive trend as a win. If, however, you frame it as a statistical question—”How does the conversion rate of this campaign vary across our three core demographics compared to the historical mean?”—you are forced to analyze the variance. You are looking for a rigorous, repeatable trend rather than a singular, comfortable success story.
Structuring Effective Statistical Inquiries

For a question to be truly statistical, it must be actionable and measurable. Vague questions lead to “analysis paralysis,” where data is collected without purpose. A well-structured statistical inquiry requires three components: a clear population, a measurable variable, and a defined scope of analysis.
Defining the Population and Sample
Before running a query, define your population clearly. Are you looking at all global customers, or only those in the EMEA region? Are you analyzing every support ticket from the last five years, or only those marked as “priority”? A statistical question that is too broad lacks precision, while one that is too narrow lacks relevance. The goal is to isolate a population that is representative enough to provide a meaningful insight into your business processes.
Measuring the Right Variables
In data science, we often talk about “independent” and “dependent” variables. A statistical question should clearly identify what is being measured and what factors are influencing that measurement.
For instance, consider the question: “How does our remote work policy impact employee productivity?”
- Population: Full-time employees.
- Variable: Output metrics (e.g., ticket resolution speed or lines of code deployed).
- Influence: Work location (Remote vs. In-office).
This is a robust statistical question because it sets the stage for a comparative analysis. It invites the data to reveal whether there is a statistically significant difference between the two groups, rather than relying on a manager’s subjective feeling about office energy.
Ensuring Statistical Significance
The final step in mastering the statistical question is understanding the concept of significance. A business question should not just ask “is there a difference,” but “is the observed difference significant enough to warrant a strategic change?”
If your data shows that your remote team is 1% faster than your in-office team, is that a meaningful result or a statistical fluke? By framing your question to account for confidence intervals and probability, you ensure that your business strategy is built on evidence that is robust enough to survive market volatility.
Implementing Statistical Thinking Across Departments
Statistical literacy should not be siloed within the data science or business intelligence teams. When sales, marketing, and HR professionals understand how to frame a statistical question, the quality of communication throughout the entire enterprise improves.
Bridging the Gap Between Technical and Non-Technical Teams
Data analysts often become frustrated when stakeholders ask “dumb” questions. In reality, the stakeholders are rarely asking “dumb” questions; they are asking deterministic questions because that is the culture they were trained in. By teaching your leadership teams how to frame their curiosities as statistical inquiries, you turn the data team from “report generators” into “strategic partners.”
Encourage your team to replace “Did we hit our goal?” with “How does our current trajectory deviate from the statistical mean of our historical performance?” This change in language shifts the mindset from binary (pass/fail) to developmental (learning/optimizing).

The Feedback Loop: Questioning the Answers
Finally, a statistical question is the start of a cycle. Once you receive the answer, the next logical step is to ask a follow-up question based on the variability you observed. If your data shows a spike in churn in a specific demographic, don’t stop at the fact. Ask a new statistical question: “What is the primary variable within this demographic—price sensitivity, product utility, or service quality—that explains this variance?”
By continuously refining your inquiries, you move from simple data collection to an iterative process of optimization. You aren’t just using data to prove what you already believe; you are using statistical questions to discover what you don’t yet know.
In conclusion, understanding what a statistical question means is about understanding the nature of your business. Business is not a fixed, deterministic environment. It is a complex, fluctuating ecosystem defined by nuance and variability. When you adopt a mindset of asking statistical questions, you stop looking for single numbers and start looking for the patterns, distributions, and probabilities that actually drive long-term success.
aViewFromTheCave is a participant in the Amazon Services LLC Associates Program, an affiliate advertising program designed to provide a means for sites to earn advertising fees by advertising and linking to Amazon.com. Amazon, the Amazon logo, AmazonSupply, and the AmazonSupply logo are trademarks of Amazon.com, Inc. or its affiliates. As an Amazon Associate we earn affiliate commissions from qualifying purchases.