
The Dow Jones Industrial Average (DJIA), often simply referred to as “the Dow,” stands as one of the oldest and most frequently cited stock market indices in the world. For over a century, it has served as a critical barometer for the health of the U.S. stock market and, by extension, the broader economy. When investors, analysts, and the general public inquire about “the high for Dow Jones,” they are typically referring to its all-time peak—the highest point the index has ever reached. This benchmark is not just a statistical curiosity; it offers profound insights into market sentiment, economic cycles, and the psychological interplay of fear and greed that drives investment decisions.

Understanding the Dow’s highs, and the context surrounding them, is crucial for any investor looking to navigate the complexities of the financial markets. It helps frame discussions about market valuations, potential risks, and the long-term trajectory of wealth creation. This article will delve into what the Dow Jones Industrial Average represents, its historical peaks, why these highs matter to investors, and strategies for navigating markets when indices are at record levels.
Deconstructing the Dow Jones Industrial Average
Before dissecting its peaks, it’s essential to grasp what the Dow Jones Industrial Average truly is and its role within the financial landscape.
What is the DJIA?
The Dow Jones Industrial Average was created in 1896 by Charles Dow, founder of The Wall Street Journal and Dow Jones & Company. It initially comprised 12 industrial companies and aimed to provide a clear, concise measure of the U.S. industrial sector’s performance. Today, it tracks 30 large, publicly-owned companies listed on the NASDAQ and the New York Stock Exchange. These aren’t just “industrial” companies in the traditional sense anymore; they represent a diverse cross-section of major sectors, including technology, healthcare, finance, and consumer goods, making it a proxy for the broader economy.
Unlike market-capitalization-weighted indices such as the S&P 500, the DJIA is a price-weighted average. This means that companies with higher stock prices have a greater influence on the index’s value, regardless of their total market capitalization. This methodology, while simple, has its critics, as a $1 movement in a high-priced stock has more impact than a $1 movement in a lower-priced, but potentially much larger, company. Despite this, its historical significance and widespread recognition ensure its continued prominence.
Significance as an Economic Barometer
For many, the Dow is synonymous with the stock market itself. Its movements are often headline news, and a rising Dow is generally perceived as a sign of economic prosperity and investor confidence, while a declining Dow can signal trouble ahead. This makes its all-time highs particularly noteworthy, as they reflect periods of sustained economic growth, strong corporate earnings, and optimistic investor outlooks.
However, it’s important to recognize the DJIA’s limitations. Representing only 30 companies, it doesn’t offer a complete picture of the entire U.S. market. Sectors not heavily represented, or the performance of smaller companies, are not captured. Furthermore, its price-weighted nature means that stock splits or changes in component companies require adjustments to the divisor, a unique calculation feature of the Dow. Despite these caveats, its long history and visibility make it an invaluable tool for tracking long-term trends and understanding market sentiment.
Historical Peaks and Market Cycles
The Dow’s journey to its current standing has been marked by numerous highs, each telling a story of economic booms, technological advancements, and shifting investor sentiment.
Tracking the All-Time Highs
The “all-time high” is a dynamic concept, constantly shifting as the market evolves. When the Dow reaches a new peak, it means the collective value of its 30 component companies has never been higher, signaling robust market performance. These milestones are often celebrated as evidence of a strong bull market, reflecting periods when economic growth, corporate profits, and investor confidence are all aligned.
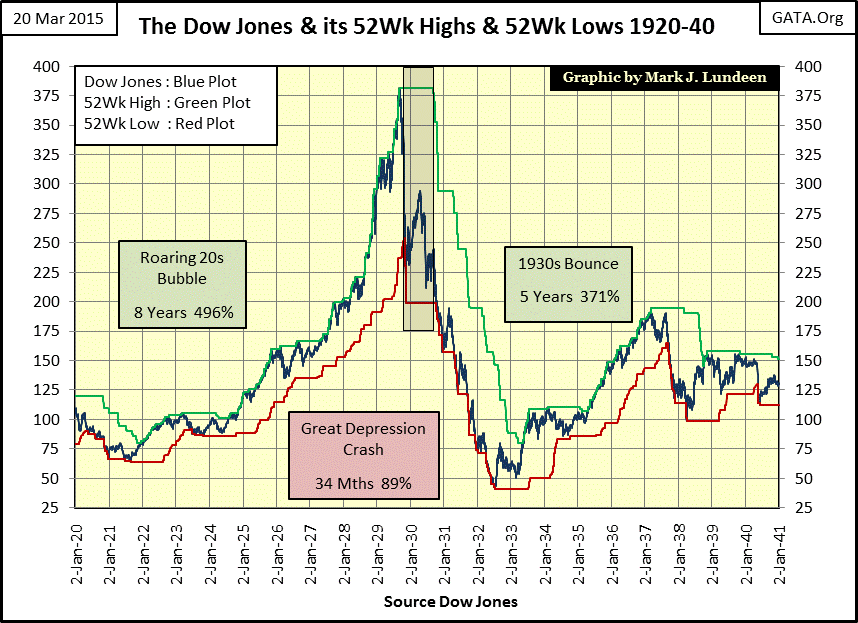
Throughout its history, the Dow has moved through various cycles of expansion and contraction. Early highs were modest, reflecting an agrarian and then industrializing economy. The “Roaring Twenties” saw significant surges, culminating in the infamous 1929 peak before the Great Depression. Subsequent decades brought new highs, driven by post-war economic booms, the rise of technology, and globalization. Each new peak, whether breaking a psychological barrier like 10,000 points or simply setting a new numerical record, captures a moment of collective optimism and wealth creation.
Key Milestones and Bull Runs
Several periods stand out in the Dow’s history for their impressive bull runs and the setting of numerous new highs:
- The Post-WWII Boom: Following the end of World War II, the U.S. economy experienced a period of unprecedented growth, fueled by industrial production and consumer demand. The Dow steadily climbed, reflecting this prosperity.
- The 1980s and 1990s: Driven by deregulation, globalization, and the early days of the technology revolution, the Dow saw substantial gains. The late 1990s, in particular, witnessed a dramatic surge as the dot-com bubble inflated, pushing the index past 10,000 points for the first time.
- Post-2008 Financial Crisis Recovery: After the severe market downturn caused by the 2008 financial crisis, the Dow embarked on one of its longest and strongest bull runs in history, fueled by quantitative easing, low interest rates, and a gradual economic recovery. This period saw the index achieve multiple record highs, breaching 20,000, 25,000, and even 30,000 points.
- Post-COVID-19 Recovery: The swift market rebound after the initial shock of the COVID-19 pandemic demonstrated remarkable resilience, propelled by massive fiscal and monetary stimulus, and rapid advancements in technology and healthcare. This led to new all-time highs in the early 2020s.
Understanding Market Corrections and Bear Markets
It’s crucial to understand that market highs are rarely linear. Periods of sustained growth are invariably followed by corrections (a drop of 10-20% from a peak) or bear markets (a drop of 20% or more). These downturns are a natural, albeit painful, part of market cycles, often triggered by economic recessions, geopolitical events, or shifts in monetary policy. For instance, the dot-com bust of 2000-2002, the 2008 financial crisis, and the COVID-19-induced crash in early 2020 all saw the Dow retreat significantly from previous highs before eventually recovering and setting new records. This cyclical nature underscores the importance of a long-term perspective and robust risk management.
Why “The High” Matters to Investors
The Dow reaching an all-time high is more than just a number; it triggers a range of emotional, analytical, and strategic considerations for investors.

Psychological Impact: FOMO and Greed
When the Dow consistently hits new highs, it often fuels a powerful psychological phenomenon: the Fear Of Missing Out (FOMO). Investors who have been on the sidelines or under-invested may feel compelled to jump into the market, fearing they will miss out on further gains. This can lead to irrational decision-making, such as buying at elevated prices without sufficient due diligence. Conversely, existing investors may experience a surge of greed, leading them to take on excessive risk in pursuit of even greater returns. While optimism is healthy, unbridled euphoria at market highs can be a warning sign, as history shows that peaks are often followed by corrections.
Valuation Concerns
One of the most critical analytical considerations at market highs is valuation. Are stocks genuinely worth their elevated prices, or are they overvalued? Investors and analysts often use metrics like price-to-earnings (P/E) ratios, price-to-sales ratios, and dividend yields to assess whether a stock or the broader market is trading at a fair price relative to its fundamentals. When the Dow is at an all-time high, it often means that these valuation metrics are also stretched, implying that future returns might be lower, or the risk of a downturn is higher. A discerning investor will look beyond the headline number and evaluate whether the underlying earnings growth justifies the market’s enthusiasm.
Risk Management at Peak Levels
Periods of all-time highs necessitate a careful re-evaluation of risk. While the market may continue to climb, the potential for a reversal increases. Investors might consider strategies such as:
- Taking Profits: Selling a portion of highly appreciated assets to lock in gains and reduce exposure.
- Rebalancing: Adjusting portfolio allocations back to target weights. If stocks have significantly outperformed, an investor might sell some stocks and reallocate to other asset classes like bonds or cash to maintain their desired risk profile.
- Increasing Cash Reserves: Holding more cash can provide dry powder to invest during potential downturns when assets are cheaper.
- Reviewing Stop-Loss Orders: Implementing or adjusting stop-loss orders can help limit potential losses if the market suddenly reverses course.
Long-Term vs. Short-Term Perspective
For long-term investors, market highs, while pleasant, are often less about immediate action and more about reaffirming a disciplined strategy. The focus remains on time in the market, not timing the market. Historically, the Dow has always recovered from downturns and gone on to set new highs. Therefore, a high for the Dow is typically just another point on an upward-sloping, albeit volatile, long-term chart. Short-term traders, however, might view market highs as critical inflection points, seeking to capitalize on momentum or predict reversals. Different investment horizons dictate vastly different responses to a market at its peak.
Strategies for Navigating Market Highs
Successfully investing when the Dow is hitting record highs requires a strategic, disciplined approach that balances optimism with prudence.
Dollar-Cost Averaging
One of the most effective strategies for mitigating the risk of buying at a market peak is dollar-cost averaging. This involves investing a fixed amount of money at regular intervals (e.g., monthly) regardless of market fluctuations. By consistently investing, you buy more shares when prices are low and fewer shares when prices are high. Over the long term, this strategy helps to average out the purchase price, reducing the impact of short-term volatility and removing the emotional temptation to time the market.
Diversification and Asset Allocation
Diversification remains a cornerstone of sound investment strategy, especially at market highs. Spreading investments across different asset classes (stocks, bonds, real estate, commodities), geographies, and sectors can help cushion your portfolio against downturns in any single area. If the Dow’s 30 companies—predominantly large-cap U.S. stocks—are overvalued, having exposure to international markets, small-cap stocks, or alternative investments can provide a buffer. Asset allocation, the strategic mix of these different asset types, should be aligned with your personal risk tolerance and financial goals.
Rebalancing Your Portfolio
As discussed, market highs can lead to certain asset classes disproportionately growing within your portfolio. Regular rebalancing ensures that your portfolio stays aligned with your initial risk profile. If stocks have surged, you might sell some of your equities to bring your allocation back to target, using the proceeds to invest in underperforming assets or simply holding cash. This systematic approach prevents your portfolio from becoming overly concentrated in assets that have performed well and might now be riskier.
Fundamental Analysis
Instead of being swayed by the overall market sentiment at new highs, astute investors focus on fundamental analysis. This involves scrutinizing the financial health, management quality, competitive advantages, and growth prospects of individual companies. Even in a market at an all-time high, there can be undervalued companies or sectors with strong fundamentals that offer compelling long-term opportunities. Conversely, highly-valued companies with weak fundamentals might be ripe for a correction. A deep dive into financial statements, earnings reports, and industry trends helps investors make informed decisions, rather than simply following the herd.
Importance of a Long-Term Investment Horizon
Perhaps the most crucial strategy when faced with market highs is to maintain a long-term investment horizon. Over decades, the stock market has consistently generated positive returns, overcoming numerous crises and corrections. Short-term fluctuations, even significant ones from a peak, tend to be smoothed out over longer periods. Investors who remain patient, stick to their investment plan, and resist the urge to panic sell during downturns are generally better positioned to capitalize on the market’s long-term growth potential. Time in the market, rather than attempting to time its peaks and troughs, is the more reliable path to wealth accumulation.
Beyond the Dow: A Holistic View
While the Dow Jones Industrial Average provides valuable insights, a comprehensive understanding of financial markets requires looking beyond this single index.
Broader Market Indices
To gain a more complete perspective, investors should also monitor broader market indices. The S&P 500, which tracks 500 large U.S. companies weighted by market capitalization, is often considered a better representation of the overall U.S. stock market. The NASDAQ Composite, heavily weighted towards technology and growth stocks, offers insights into that dynamic sector. The Russell 2000 focuses on small-cap companies, providing a pulse on a different segment of the economy. Observing how these various indices perform relative to each other, especially at market highs, can provide a more nuanced understanding of where value and risk might lie.
Economic Indicators
Market highs are intertwined with economic conditions. Therefore, keeping an eye on key economic indicators is essential. Gross Domestic Product (GDP) growth, inflation rates, interest rates set by central banks (like the Federal Reserve), employment figures, and consumer spending data all provide context for stock market performance. A market at new highs amidst robust economic growth and contained inflation tells a different story than a market rising on speculation alone, or in the face of underlying economic weakness.
Global Influences
In today’s interconnected world, domestic market highs are also influenced by global factors. Geopolitical events, economic performance in major international markets, currency fluctuations, and global trade dynamics can all impact corporate earnings and investor sentiment in the U.S. Understanding these broader forces helps investors put the Dow’s performance into a global context, informing decisions about international diversification.
Conclusion
The question “what is the high for Dow Jones” is more than a request for a numerical value; it opens a gateway to understanding market dynamics, investor psychology, and strategic financial planning. All-time highs are milestones that reflect periods of prosperity and confidence, but they also serve as critical junctures for investors to assess risk, evaluate valuations, and reaffirm their long-term strategies.
Navigating markets at their peaks requires discipline, a focus on fundamentals, and a diversified, rebalanced portfolio. While the allure of quick gains can be strong, the most successful investors understand that sustained wealth creation comes from a methodical approach, a long-term perspective, and a comprehensive understanding of both the market’s historical cycles and its current economic context. By doing so, investors can look beyond the headline numbers and make informed decisions that align with their financial goals, regardless of whether the Dow is setting new records or experiencing a temporary pullback.
aViewFromTheCave is a participant in the Amazon Services LLC Associates Program, an affiliate advertising program designed to provide a means for sites to earn advertising fees by advertising and linking to Amazon.com. Amazon, the Amazon logo, AmazonSupply, and the AmazonSupply logo are trademarks of Amazon.com, Inc. or its affiliates. As an Amazon Associate we earn affiliate commissions from qualifying purchases.