
The lexicon of the stock market can often feel like a complex foreign language, filled with specialized terms and acronyms that leave many aspiring investors scratching their heads. Among these, the term “points” is frequently thrown around in financial news and market commentaries, often without adequate explanation for the uninitiated. Understanding what “points” signify in the stock market is crucial for anyone looking to grasp market movements, interpret financial reports, and make informed investment decisions. Far from being a mere abstract unit, points are a fundamental measure of change within stock market indexes, reflecting the collective sentiment and performance of the economy and the companies within it. This article will demystify the concept of points, explore their significance, and explain how they serve as a vital metric for investors and analysts alike.
Decoding “Points”: The Fundamental Concept
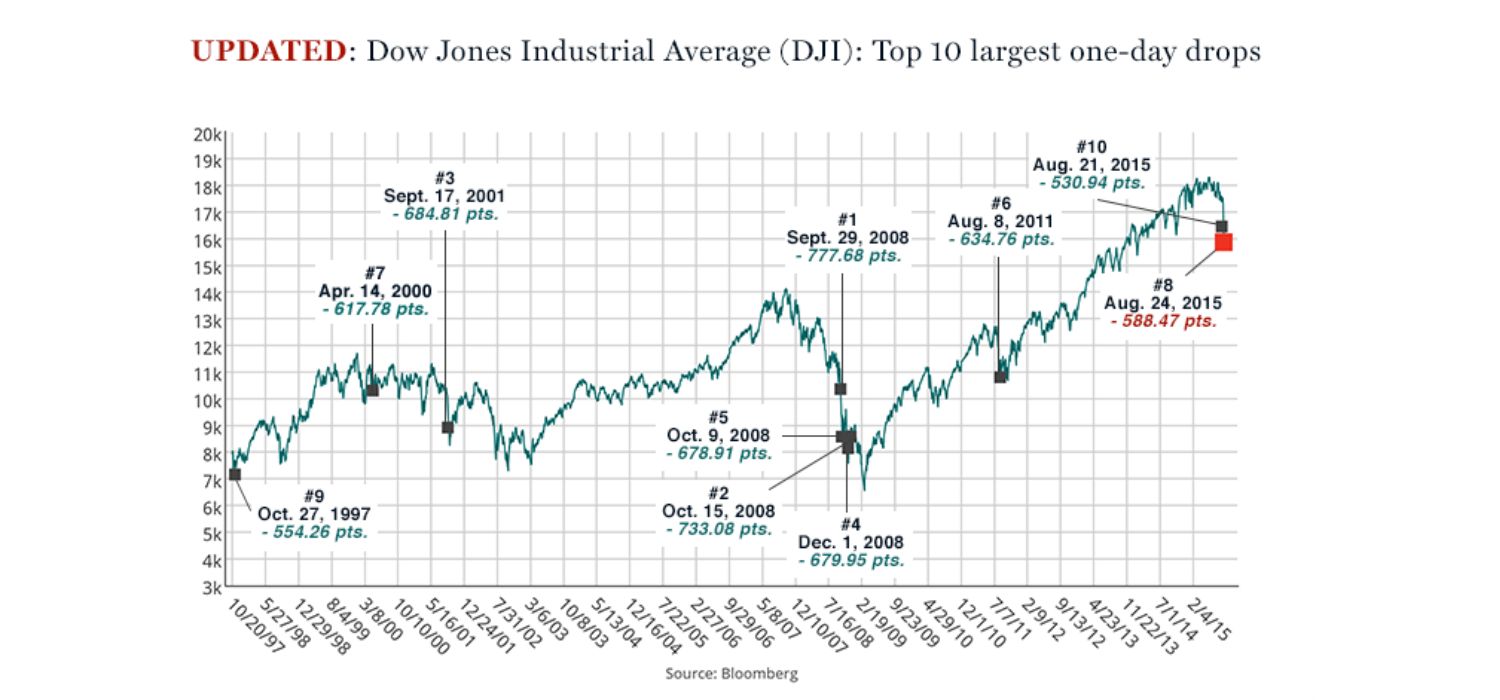
At its core, a “point” in the stock market refers to the unit of measurement used to describe the change in value of a stock market index. Unlike the price of an individual stock, which is denominated in a specific currency (e.g., dollars per share), an index’s value is an aggregate number representing the performance of a basket of underlying securities. When you hear that the Dow Jones Industrial Average (DJIA) “rose 200 points” or the S&P 500 “fell 50 points,” it’s these index movements that are being discussed.
Points and Stock Market Indexes
Stock market indexes are curated collections of stocks designed to represent a specific segment of the market or the market as a whole. They serve as benchmarks against which the performance of individual stocks, sectors, or even entire economies can be measured. Prominent examples include:
- Dow Jones Industrial Average (DJIA): Comprising 30 large, publicly traded companies across various sectors, it is one of the oldest and most widely quoted market indexes. Its movements are often reported in points.
- S&P 500: A market-capitalization-weighted index of 500 large U.S. companies, widely regarded as one of the best gauges of large-cap U.S. equities and the overall health of the U.S. stock market.
- NASDAQ Composite: An index of all stocks listed on the NASDAQ stock market, known for its heavy weighting towards technology and growth companies.
Each of these indexes has a specific methodology for its calculation, often involving the summation of prices of component stocks, sometimes weighted by market capitalization or other factors. When these underlying stock prices move, the index’s value changes, and this change is expressed in points. For instance, if the DJIA is at 35,000 points and it rises to 35,200 points, it has “risen 200 points.” This movement isn’t a direct dollar value for every investor, but rather an indicator of the overall direction and magnitude of change in the index.
The Difference Between Points and Price
It’s crucial to distinguish between points and the actual price of an individual stock. A stock’s price is the monetary value at which one share can be bought or sold. For example, if Apple stock (AAPL) trades at $170 per share, that is its price. If it goes up to $172, its price has increased by $2.
Indexes, however, do not have a “price” in the same way. Their value is an abstract number derived from their components. The “points” represent the change in this abstract value. A 100-point move in an index doesn’t mean every stock in the index went up by $100, nor does it translate directly to a fixed dollar amount in an investor’s portfolio without knowing the specific investments tied to that index. The actual impact on an investor’s portfolio depends on which stocks they hold, the size of their investment, and whether they are invested in index funds or ETFs that track the index.
Why Not Just Use Percentages?
While point changes are widely reported, understanding the percentage change is often more insightful for investors. A 100-point move in an index means different things depending on the index’s base value. For example:
- If an index is at 1,000 points, a 100-point gain represents a 10% increase.
- If the same index is at 30,000 points, a 100-point gain represents only about a 0.33% increase.
The percentage change provides a standardized measure of magnitude, allowing for a more accurate comparison of market movements over different periods or across different indexes. Financial professionals often emphasize percentage changes because they offer a clearer perspective on the relative performance, free from the distortion of large absolute numbers. However, points remain a common and accessible way for the general public and media to quickly convey market direction and magnitude, especially for well-known indexes with high base values.
Beyond the Number: What Points Really Signify
While points are a numerical representation of market change, their significance extends far beyond mere arithmetic. They serve as a powerful barometer for market sentiment, economic health, and investor confidence. Interpreting point movements correctly can provide valuable insights into the broader financial landscape.
Reflecting Market Sentiment and Health
When major indexes like the S&P 500 or DJIA show significant point gains, it generally indicates a positive market sentiment, often driven by optimism about corporate earnings, economic growth, or favorable monetary policies. Conversely, substantial point losses can signal widespread pessimism, perhaps fueled by fears of recession, geopolitical instability, or disappointing financial results. These movements are not arbitrary; they are the collective outcome of millions of individual investment decisions based on available information and expectations for the future.
A rising market (positive points) suggests that investors are willing to pay more for stocks, anticipating future profits and economic expansion. A falling market (negative points) implies the opposite: investors are becoming more risk-averse, selling off assets, and bracing for potential downturns. While day-to-day fluctuations can be influenced by transient news, sustained trends in point movements offer a clearer picture of the market’s underlying health and prevailing sentiment.
Understanding Magnitude: Big Moves vs. Small Shifts
The absolute number of points an index moves is important, but its impact must be considered in context. As discussed, a 500-point swing in the DJIA today, when the index is typically in the range of 30,000-40,000, represents a percentage change of roughly 1.25% to 1.6%. While notable, this is less impactful than a 500-point swing would have been decades ago when the index was at much lower levels. For instance, in 1987, a 500-point drop would have been catastrophic, representing a much larger percentage of the total index value.
Therefore, when evaluating market news, it’s crucial to look beyond just the raw point figure and consider the percentage change. A move of 1% to 2% in a major index is generally considered a significant daily shift, while larger moves (e.g., 3%+ in a single day) are indicative of substantial market events or heightened volatility. Small shifts, perhaps less than 0.5%, are typically normal day-to-day fluctuations and often do not signal a major change in market direction or sentiment.
Points in Different Market Contexts
The concept of points isn’t limited to broad market indexes. Specific sectors or market segments might also track their performance in points, especially if they are compiled into their own indexes. For instance, a technology index or a healthcare index might show point changes. However, the most common usage refers to the major national or international stock market benchmarks.
Furthermore, “basis points” (bps) are another form of “points” used in financial markets, though distinct from the index movements discussed. A basis point is one-hundredth of a percentage point (0.01%). This term is primarily used when discussing interest rates, bond yields, or other financial percentages. For example, if interest rates rise by 25 basis points, they have increased by 0.25 percentage points. While also using the word “points,” basis points are a precise unit for percentage changes, whereas stock market points refer to the change in an index’s aggregate value. It’s important not to confuse the two in stock market discussions.
Navigating Market Movements: Points in Practice
For investors and market observers, tracking point movements is an everyday activity. It informs daily narratives, influences trading decisions, and contributes to the broader understanding of economic performance. Learning how to effectively navigate these reports can enhance one’s financial literacy and investment acumen.
Interpreting Daily Market Reports
Every business day, financial news outlets report on how the major stock market indexes have performed, often highlighting the number of points gained or lost. A typical report might state: “The Dow Jones Industrial Average closed up 150 points, while the S&P 500 gained 0.4% and the NASDAQ Composite advanced 0.8%.” This concise summary tells a story: the overall market was positive, with technology and growth stocks (represented by NASDAQ) outperforming the broader market.
When interpreting these reports, consider:
- Direction: Did the points go up or down? This indicates the general mood of the market.
- Magnitude: How many points changed, and what percentage does that represent? Large percentage changes suggest significant market events.
- Context: What news or economic data was released that day? Major earnings reports, Federal Reserve announcements, or geopolitical developments often correlate with significant point movements.
- Sector Performance: While the overall index moves in points, looking at individual sectors (e.g., energy, tech, financials) can reveal which parts of the economy are driving the change.
A holistic view, rather than fixating on a single number, provides a richer understanding of the market’s dynamics.
Long-Term Trends vs. Short-Term Volatility
While daily point changes capture immediate market reactions, long-term investors are often more interested in sustained trends. A few days of significant point gains or losses might indicate short-term volatility, but they rarely define a long-term investment strategy. Long-term trends, spanning months or years, are generally more indicative of fundamental economic shifts or sustained growth/decline patterns.
For example, observing the DJIA gaining thousands of points over a multi-year period (even with daily fluctuations) points to a bull market, characterized by economic expansion and increasing corporate profits. Conversely, a sustained period of declining points, even if punctuated by occasional rallies, suggests a bear market, often associated with recessionary fears or economic contraction. Understanding the difference between short-term noise and long-term signals is critical for making strategic investment decisions rather than reacting impulsively to daily headlines.
The Role of Points in Economic Indicators
Stock market performance, as measured by point movements in major indexes, is often considered a leading economic indicator. This means that changes in stock prices tend to anticipate future economic conditions. If the market is consistently gaining points over a period, it suggests that investors are collectively optimistic about future corporate earnings and economic growth. This optimism can precede actual improvements in GDP, employment rates, or consumer spending.
Conversely, a sustained downturn in points can signal an impending economic slowdown or recession. While the stock market isn’t infallible in its predictions, its collective wisdom, reflected in point movements, provides valuable insights into the trajectory of the economy. Policymakers, economists, and business leaders all pay close attention to stock market points as part of their broader analysis of economic health and future prospects.
Investor’s Toolkit: Leveraging Point Data
For the astute investor, understanding “points” is more than just academic knowledge; it’s a practical tool that aids in decision-making, risk management, and portfolio evaluation. Integrating this understanding into one’s investment approach can foster a more disciplined and informed strategy.
Informed Decision-Making for Investors
Investors rarely make decisions based solely on the daily point change of an index. However, this information, combined with other fundamental and technical analysis, contributes to a comprehensive investment perspective. For instance, if an investor observes consistent point gains in a particular sector index, it might prompt them to research companies within that sector for potential investment opportunities. Conversely, a prolonged period of declining points in the broader market might signal a need to review portfolio allocations, perhaps shifting towards more defensive assets.
Furthermore, understanding points helps investors filter out sensationalism. News headlines often highlight dramatic point swings to grab attention. An investor who understands the percentage context and the difference between short-term volatility and long-term trends can avoid panic-selling during a brief market dip or over-exuberance during a temporary rally. Informed decision-making stems from a balanced perspective, where points serve as one piece of a larger puzzle.
Risk Assessment and Portfolio Management
Points play a role in how investors assess and manage risk within their portfolios. For those invested in index funds or Exchange Traded Funds (ETFs) that track major indexes, the point movements directly impact their portfolio value. For example, if an investor holds an S&P 500 index fund, a 1% drop (which might translate to 50 points if the index is at 5,000) means their investment in that fund has also decreased by 1%.
Beyond direct impact, broad market point movements provide a benchmark for evaluating portfolio performance. An investor might compare their portfolio’s returns against the S&P 500’s point performance to see if they are outperforming, underperforming, or tracking the market. This benchmarking is crucial for assessing the effectiveness of one’s investment strategy and making necessary adjustments to align with personal financial goals and risk tolerance. Understanding points helps investors set realistic expectations for returns and potential drawdowns.

Avoiding Common Misconceptions
One of the most common misconceptions is equating a large point movement with an equally large dollar impact on one’s portfolio, irrespective of the portfolio’s size or holdings. As emphasized, a 500-point drop in the DJIA does not mean an investor lost $500. The actual dollar impact depends on the individual’s investments and how closely they track the index.
Another misconception is that points are arbitrary numbers without real-world implications. In reality, every point move in an index is the result of countless individual transactions and reflects the collective valuation of some of the world’s largest companies. These movements are driven by tangible factors such as corporate earnings, interest rate changes, geopolitical events, and technological advancements, all of which have profound economic consequences. By understanding the underlying drivers of point movements, investors can gain a deeper appreciation for the complex interplay of forces shaping financial markets.
In conclusion, “points” in the stock market are far more than just abstract numbers. They are the language through which market indexes communicate their daily performance, reflect investor sentiment, and signal broader economic trends. For anyone engaged in personal finance or investing, mastering this concept is an indispensable step towards becoming a more confident and competent participant in the dynamic world of the stock market. By looking beyond the headline figure and understanding the context, percentage change, and underlying drivers, investors can leverage point data to make more informed decisions, manage risk effectively, and build a resilient financial future.
aViewFromTheCave is a participant in the Amazon Services LLC Associates Program, an affiliate advertising program designed to provide a means for sites to earn advertising fees by advertising and linking to Amazon.com. Amazon, the Amazon logo, AmazonSupply, and the AmazonSupply logo are trademarks of Amazon.com, Inc. or its affiliates. As an Amazon Associate we earn affiliate commissions from qualifying purchases.