
In the realm of personal and business finance, the ability to calculate and interpret percentages is more than just a mathematical skill—it is a fundamental pillar of financial literacy. Whether you are evaluating the performance of a stock portfolio, determining the profitability of a side hustle, or calculating the true cost of a high-interest loan, percentages provide the standardized language necessary to make informed decisions. Understanding how to get a percentage allows you to strip away the noise of raw numbers and see the underlying trends that dictate your fiscal health.

The Fundamentals of Financial Percentages: Beyond the Basic Formula
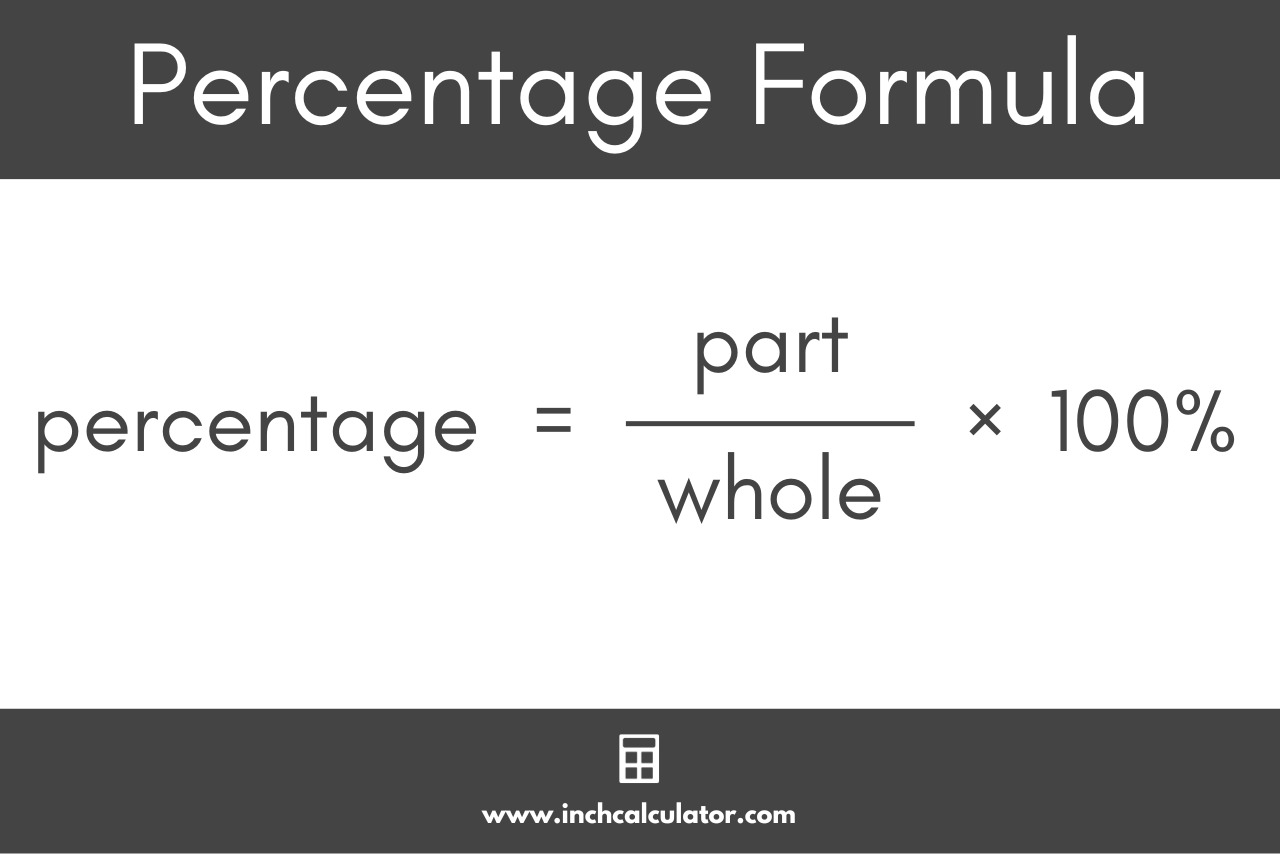
To understand “how to get a percentage” in a financial context, one must first master the basic relationship between a part and its whole. In its simplest form, a percentage is a fraction of 100. The mathematical formula—(Part / Whole) x 100—serves as the foundation for nearly every financial metric used by Wall Street analysts and household budgeters alike.
The Power of Relative Values
In money management, raw numbers can often be misleading. For instance, earning $1,000 on an investment might sound impressive, but its significance changes drastically depending on the initial outlay. If you invested $2,000 to earn that $1,000, you have a 50% return. If you invested $100,000, that same $1,000 represents a mere 1% return. By converting these figures into percentages, you gain a clear perspective on the efficiency of your capital. This relative value is what allows investors to compare a small-cap tech stock against a massive government bond on an equal playing field.
Percentages in Budgeting: The 50/30/20 Rule
One of the most practical applications of percentages in daily life is the 50/30/20 budgeting framework. This rule suggests allocating 50% of your after-tax income to “Needs,” 30% to “Wants,” and 20% to “Savings and Debt Repayment.” Calculating these percentages requires you to take your total monthly income (the “Whole”) and divide your specific expenses (the “Part”) into these categories. This percentage-based approach ensures that as your income grows, your lifestyle and savings scale proportionally, preventing “lifestyle creep” from eroding your financial future.
Mastering Investment Math: Calculating Returns and Growth
When it comes to building wealth, the most common question is: “What is my percentage return?” Understanding how to calculate different types of returns is essential for managing a portfolio and identifying which assets are actually pulling their weight.
Return on Investment (ROI)
ROI is the most straightforward way to calculate the percentage gain or loss on an investment. To get this percentage, you subtract the initial cost of the investment from its current value to find the “Net Profit.” You then divide that profit by the original cost and multiply by 100.
For example, if you purchased shares of an Index Fund for $5,000 and sold them a year later for $5,750, your profit is $750. Dividing $750 by $5,000 gives you 0.15, or a 15% ROI. This simple calculation is the “gold standard” for a quick snapshot of performance, though it does not account for the time the money was invested.
Compound Annual Growth Rate (CAGR)
While ROI gives you a total snapshot, the Compound Annual Growth Rate (CAGR) is the percentage you need to understand how an investment has performed over multiple years. Money does not grow in a straight line; it compounds. CAGR provides a smoothed annual percentage rate that represents the geometric progression ratio that provides a constant rate of return over the time period. Understanding CAGR is vital when comparing the long-term performance of real estate versus the stock market, as it accounts for the volatility and the compounding effect of reinvested earnings.
Dividend Yield and Distribution Rates
For income-focused investors, the “percentage” they care most about is the yield. To get the dividend yield of a stock, you divide the annual dividend payment by the current share price. If a company pays $2.00 per share annually and the stock is trading at $50.00, the dividend yield is 4%. This percentage allows you to compare the income-generating potential of different stocks regardless of their price per share, helping you build a more robust passive income stream.
Business Finance: Using Percentages to Gauge Profitability

For entrepreneurs and business owners, knowing how to get a percentage is the difference between a thriving enterprise and a failing one. Financial statements are packed with “margins,” which are simply percentages that indicate how much of every dollar earned is kept as profit.
Gross Profit Margin vs. Net Profit Margin
Understanding the difference between these two percentages is crucial for business health. The Gross Profit Margin is calculated by subtracting the Cost of Goods Sold (COGS) from total revenue, then dividing that result by total revenue. This percentage tells you how efficiently you are producing or sourcing your products.
However, the Net Profit Margin is the “bottom line” percentage. It takes into account all expenses—rent, payroll, taxes, and interest. To get this percentage, you divide your net income by your total revenue. A business might have a high Gross Margin (70%) but a very low Net Margin (5%) if its operating costs are too high. Monitoring these percentages helps business owners identify where they are “bleeding” cash.
Year-over-Year (YoY) Growth Percentages
In business, stagnation is often the precursor to decline. To measure growth, we use the Year-over-Year percentage change formula: [(Current Year Value – Previous Year Value) / Previous Year Value] x 100. If your business earned $100,000 last year and $120,000 this year, you have achieved a 20% growth rate. Investors use this percentage to determine if a company is expanding its market share or if it has reached a plateau.
Break-Even Analysis and Margin of Safety
Percentages also play a role in risk management. A “Margin of Safety” is the percentage by which sales can drop before a business begins to lose money. If your break-even point is $50,000 in sales and you currently earn $100,000, your margin of safety is 50%. Understanding this percentage gives business owners the confidence to reinvest in the company or the warning they need to cut costs before a crisis hits.
Debt and Credit: The High Cost of Percentage Points
While percentages can work for you in investments, they can work against you in the form of debt. In the world of borrowing, small changes in percentage points can lead to massive differences in the total amount of money paid over time.
Navigating APR (Annual Percentage Rate)
When you take out a loan or carry a balance on a credit card, the lender charges an APR. This is the annual percentage of the principal you pay for the privilege of borrowing the money. To understand the impact, consider a $10,000 credit card balance at a 20% APR. That percentage translates to $2,000 in interest charges in a single year if the balance remains unpaid. By understanding how to calculate the daily periodic rate (APR divided by 365), consumers can see exactly how much interest is accruing every single day they carry a balance.
The Impact of Interest Rate Hikes
In a macro-financial sense, the percentages set by central banks (like the Federal Reserve) dictate the cost of everything from mortgages to car loans. A 1% increase in a mortgage interest rate might seem negligible, but on a 30-year loan of $400,000, that single percentage point can result in nearly $100,000 in additional interest payments over the life of the loan. Knowing how to get these percentages and run “what-if” scenarios is essential before signing any long-term financial contract.
Practical Tools and Best Practices for Financial Calculations
In the modern era, you don’t always need a pencil and paper to get a percentage, but you do need to know how to use the tools available to you.
Leveraging Spreadsheets for Financial Analysis
Programs like Microsoft Excel or Google Sheets are the ultimate tools for percentage calculations. Using the “Percentage” cell format allows you to input formulas like =A1/B1 and instantly see the result as a percentage. For more complex needs, functions like IRR (Internal Rate of Return) help investors calculate the percentage profitability of potential investments with varying cash flows over time.
The Dangers of “Percentage Blindness”
A common mistake in money management is focusing on the percentage without looking at the nominal dollar amount, or vice versa. A 100% gain on a $10 investment is only $10, while a 5% loss on a $1,000,000 portfolio is $50,000. Successful financial planning requires a dual perspective: use percentages to determine strategy and efficiency, but use raw dollar amounts to determine the actual impact on your life and goals.
Conclusion: The Percentage as a Compass
Ultimately, learning how to get a percentage is about gaining a compass for your financial journey. It allows you to ignore the marketing hype of “big numbers” and focus on the metrics that actually matter: growth, efficiency, and cost. Whether you are a student starting your first savings account or a seasoned entrepreneur scaling a corporation, the humble percentage remains your most powerful tool for measuring progress and securing your financial future. By mastering these calculations, you transform from a passive observer of your bank account into an active architect of your wealth.
aViewFromTheCave is a participant in the Amazon Services LLC Associates Program, an affiliate advertising program designed to provide a means for sites to earn advertising fees by advertising and linking to Amazon.com. Amazon, the Amazon logo, AmazonSupply, and the AmazonSupply logo are trademarks of Amazon.com, Inc. or its affiliates. As an Amazon Associate we earn affiliate commissions from qualifying purchases.