The Price-to-Earnings (P/E) ratio is arguably one of the most widely cited and fundamental metrics in the investment world, offering a quick snapshot of how much investors are willing to pay for each dollar of a company’s earnings. When we extend this concept to an entire market index like the S&P 500, the P/E ratio becomes a powerful, albeit complex, indicator of broader market valuation and investor sentiment. Understanding the current P/E of the S&P 500 is not merely about knowing a single number; it involves delving into what that number represents, how it’s calculated, its historical context, and its implications for investment strategies.

For investors, both seasoned and novice, the S&P 500’s P/E ratio serves as a critical thermometer for the market’s temperature. Is the market overvalued, fairly valued, or potentially undervalued? While no single metric provides a definitive answer, the P/E offers a valuable starting point for deeper analysis. This article aims to demystify the S&P 500 P/E ratio, guiding you through its nuances and empowering you to interpret this vital financial metric effectively.
Understanding the P/E Ratio: A Fundamental Valuation Metric
Before we can discuss the S&P 500’s P/E, it’s crucial to grasp the core concept of the P/E ratio itself and its significance in financial analysis.
What is the P/E Ratio?
At its heart, the P/E ratio is a valuation multiple that measures a company’s current share price relative to its per-share earnings. It’s calculated by dividing the current market price per share by the earnings per share (EPS). For example, if a company’s stock trades at $100 and has earned $5 per share over the past year, its P/E ratio would be 20 ($100 / $5). In essence, a P/E of 20 means investors are willing to pay $20 for every $1 of the company’s annual earnings.
A higher P/E ratio typically suggests that investors have higher growth expectations for the company in the future, or that the company is perceived as having lower risk. Conversely, a lower P/E ratio might indicate that a company is undervalued, experiencing slower growth, or facing significant risks. For an index like the S&P 500, the P/E ratio is an aggregation, often calculated by summing the market capitalizations of all constituent companies and dividing that by the sum of their earnings.
Types of P/E Ratios
The term “P/E ratio” isn’t a monolithic concept; there are several variations, each offering a slightly different perspective on valuation:
- Trailing P/E: This is the most common type, calculated using a company’s earnings per share over the past 12 months. It’s backward-looking but based on actual, reported earnings, making it reliable.
- Forward P/E: This uses analysts’ estimates of a company’s future earnings per share, typically for the next 12 months. It’s forward-looking and reflects market expectations, but relies on projections which can be inaccurate. The S&P 500 often uses a forward P/E to reflect the market’s anticipatory nature.
- Shiller P/E (CAPE Ratio): Developed by Nobel laureate Robert Shiller, the Cyclically Adjusted Price-to-Earnings (CAPE) ratio addresses the cyclical nature of earnings. It takes the current stock price and divides it by the average of ten years of inflation-adjusted earnings, smoothing out short-term fluctuations. This ratio is particularly useful for assessing long-term market valuation.
Why the S&P 500 P/E Matters
The S&P 500 P/E ratio is not just an academic curiosity; it’s a vital indicator for the broader market. As the S&P 500 represents 500 of the largest publicly traded companies in the United States, its collective P/E provides a robust gauge of the overall market’s valuation. It offers insights into aggregate investor sentiment, economic health, and potential future returns. A historically high S&P 500 P/E might signal an “expensive” market prone to corrections, while a low P/E could suggest a market trading at a discount, potentially offering attractive entry points for long-term investors.
Determining the “Current” S&P 500 P/E Ratio
The quest to find the “current” S&P 500 P/E ratio often leads to a single number, but its dynamic nature requires a more nuanced understanding.
The Dynamic Nature of the P/E
Unlike a static financial statement figure, the P/E ratio of the S&P 500 is constantly in flux. It changes daily, even by the minute, due to two primary factors:
- Stock Prices: As the prices of the 500 constituent stocks fluctuate throughout the trading day, the aggregate market capitalization of the S&P 500 changes, directly impacting the “Price” component of the ratio.
- Earnings Estimates: While trailing earnings are more stable, forward earnings estimates are continually updated by analysts. As companies report quarterly earnings, and as analysts adjust their projections for future quarters, the “Earnings” component changes. Significant economic news or company-specific developments can also prompt rapid revisions.
This dynamic nature means that any reported “current” P/E ratio is merely a snapshot in time. What was current an hour ago may already be slightly different.
Where to Find Reliable Data
Given its importance, various financial platforms provide real-time or near real-time data for the S&P 500 P/E ratio. Reliable sources include:
- Financial News Websites: Major financial news outlets (e.g., Bloomberg, Reuters, Wall Street Journal, Financial Times) often display the S&P 500’s P/E ratio prominently in their market data sections.
- Index Providers: S&P Dow Jones Indices, the official maintainer of the S&P 500, publishes detailed statistics, including various P/E ratios (trailing, forward, CAPE) on its website.
- Brokerage Platforms: Most online brokerage accounts offer comprehensive market data, including the P/E ratio for major indices.
- Financial Data Providers: Professional terminals and data services (e.g., FactSet, Refinitiv, Morningstar) offer the most granular and up-to-date information, often with historical context.
When seeking the “current” P/E, it’s advisable to specify which type you’re interested in (trailing, forward, or CAPE), as different sources might default to one over another.
Interpreting the Number in Real-Time
Once you have a “current” P/E number, the immediate question is: what does it mean? A single number in isolation provides limited insight. Its value comes from comparison:
- Against its own historical average: Is the current P/E significantly higher or lower than the S&P 500’s long-term average?
- Against other market indices: How does it compare to the P/E of the Dow Jones Industrial Average or the Nasdaq Composite?
- Against international markets: Is the U.S. market more expensive or cheaper than European or Asian markets based on P/E?
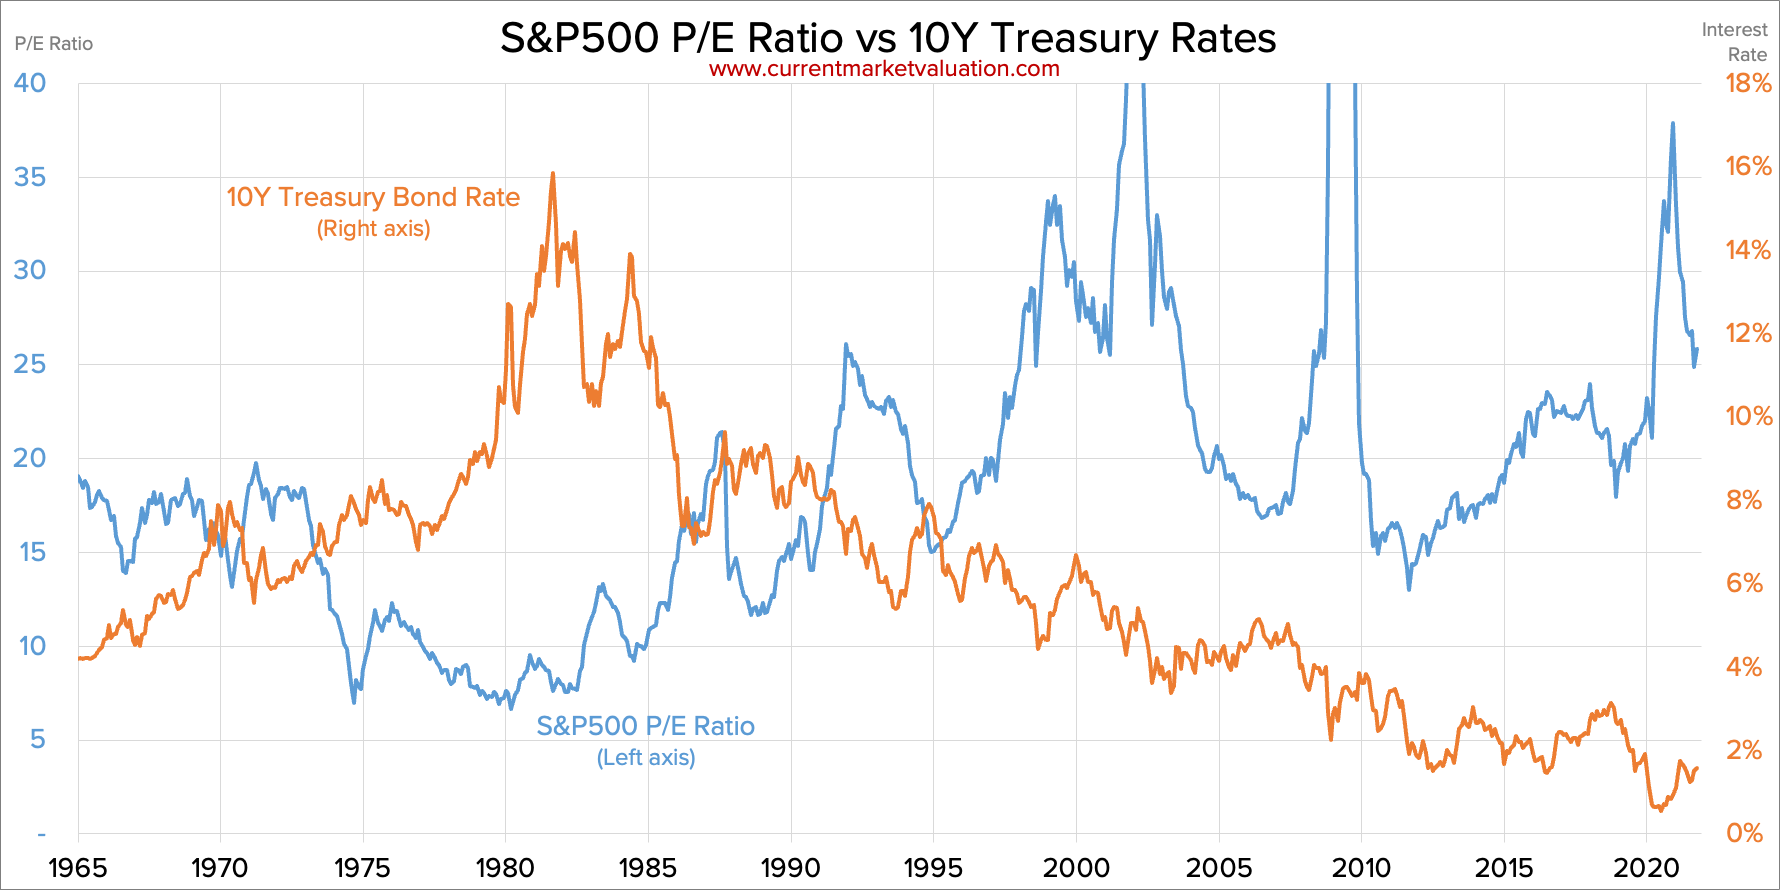
- Against prevailing interest rates: In a low-interest-rate environment, higher P/E ratios can often be justified as investors seek higher returns from equities. Conversely, rising interest rates tend to put downward pressure on P/E multiples.
Understanding these comparisons is crucial because a P/E of, for example, 25 might be considered high in one market environment but reasonable in another, particularly during periods of robust earnings growth or low inflation.
Historical Context and Valuation Insights
The S&P 500’s P/E ratio is best understood not as a static benchmark, but as a dynamic measure that ebbs and flows with economic cycles, technological shifts, and investor sentiment.
Average Historical S&P 500 P/E
Historically, the S&P 500’s average trailing P/E ratio has hovered around 15-17. However, this average masks significant volatility. During periods of robust economic growth and technological innovation, such as the dot-com bubble of the late 1990s or the post-financial crisis bull run, the P/E has surged well above 20, even touching 30 or higher at times. Conversely, during recessions, financial crises, or periods of high uncertainty, the P/E can fall significantly, sometimes into the low teens or even single digits, though this often reflects a collapse in earnings rather than a dramatic drop in prices initially.

Analyzing the CAPE ratio, which smooths out earnings volatility, provides an even longer-term perspective. The historical average for the CAPE ratio is typically around 16-17. Deviations from this long-term average can signal periods of potential over or undervaluation over extended time horizons.
Is a High P/E Justified?
A high S&P 500 P/E ratio often raises concerns about market overvaluation, but it’s not always a signal to sell. Several factors can justify elevated multiples:
- Low Interest Rates: When interest rates are low, the present value of future earnings is higher, making stocks more attractive relative to bonds. This can support higher P/E ratios.
- Strong Earnings Growth Expectations: If analysts anticipate robust, sustained earnings growth across a broad range of companies, investors are willing to pay a premium today for those expected future profits.
- Technological Innovation: Periods of significant technological advancement can drive strong productivity gains and create new markets, justifying higher valuations for the companies leading these changes.
- Low Inflation: A low and stable inflationary environment reduces uncertainty about future costs and profits, fostering greater confidence in earnings projections.
- Defensive Qualities/Flight to Safety: In uncertain times, investors might flock to perceived “safer” large-cap stocks, pushing up their prices and, consequently, the index P/E.
Is a Low P/E a Bargain?
Similarly, a low S&P 500 P/E ratio, while potentially indicating an undervalued market, isn’t automatically a “buy” signal. Factors contributing to a low P/E can include:
- Economic Recession or Slowdown: During downturns, corporate earnings often contract sharply, and investor confidence wanes, leading to lower valuations.
- High Interest Rates: Rising interest rates make bonds more competitive and increase the cost of capital for companies, putting downward pressure on stock valuations.
- High Inflation/Economic Uncertainty: Unpredictable inflation erodes purchasing power and makes it difficult for companies to plan, leading investors to demand a discount.
- Geopolitical Risks: Major global events or political instability can significantly dampen investor sentiment and drive down market multiples.
- Industry-Specific Headwinds: If key sectors within the S&P 500 are facing significant challenges (e.g., regulatory changes, disruptive technologies), this can drag down the overall index P/E.
A low P/E often reflects prevailing pessimism, which, for a contrarian long-term investor, might indeed present an opportunity. However, it’s crucial to distinguish between a temporary dip and a deeper, structural problem.
The P/E Ratio as an Investment Tool
The S&P 500 P/E ratio is a powerful tool, but like any financial metric, it has its strengths and limitations. Wise investors use it as part of a broader analytical framework.
P/E in Conjunction with Other Metrics
Relying solely on the P/E ratio for investment decisions is akin to judging a book by its cover. A comprehensive valuation approach combines the P/E with several other fundamental indicators:
- PEG Ratio (Price/Earnings to Growth): This ratio divides the P/E by the earnings growth rate, offering a more nuanced view for growth stocks. A PEG of 1 generally suggests a fair valuation.
- Dividend Yield: For income-focused investors, the dividend yield (annual dividend per share / price per share) provides insight into the income generated relative to the stock price.
- Debt-to-Equity Ratio: This measures a company’s financial leverage, indicating how much debt it uses to finance assets relative to shareholder equity. High debt can signal risk, even for a company with an attractive P/E.
- Return on Equity (ROE) / Return on Invested Capital (ROIC): These profitability metrics show how efficiently a company uses shareholder capital to generate profits. A high P/E might be justified if accompanied by strong and consistent ROE/ROIC.
- Price-to-Book (P/B) Ratio: Compares a company’s market value to its book value (assets minus liabilities). It’s particularly useful for valuing financial institutions and asset-heavy industries.
- Cash Flow Multiples (P/FCF): Measures the stock price against a company’s free cash flow, often considered a more reliable measure of financial health than reported earnings, which can be manipulated.
By integrating these metrics, investors can build a more holistic picture of the S&P 500’s valuation and the underlying health of its constituent companies.
Limitations of Solely Relying on P/E
While indispensable, the P/E ratio has inherent limitations that savvy investors must acknowledge:
- Not Suitable for All Industries: The P/E is less effective for companies with unstable or negative earnings, such as early-stage tech startups or cyclical businesses during a downturn. Different valuation methods (e.g., price-to-sales, discounted cash flow) might be more appropriate.
- Earnings Manipulation: Companies can sometimes use accounting tricks to smooth or inflate earnings, potentially distorting the P/E ratio.
- Accounting Differences: International accounting standards can differ, making direct P/E comparisons across global markets challenging.
- Ignores Debt: P/E doesn’t account for a company’s debt load. A company with a low P/E might be highly leveraged, increasing its risk profile.
- Doesn’t Account for Intangibles: For many modern companies, intellectual property, brand value, and network effects are crucial, but these are often not fully captured in traditional earnings figures or the P/E ratio.
Investor Sentiment and Market Psychology
The P/E ratio is not just a mathematical calculation; it’s also a reflection of investor sentiment and market psychology. During periods of euphoria, investors might push P/E ratios to historically high levels, believing “this time is different” or that certain companies can sustain hyper-growth indefinitely. Conversely, during panics, fear can drive P/E ratios to irrationally low levels. Understanding that the P/E embodies both objective financial data and subjective human emotion is critical for its correct interpretation. The S&P 500 P/E can, therefore, be seen as a barometer of the collective optimism or pessimism prevailing in the market.
Navigating Current Market Conditions
Understanding the S&P 500 P/E requires more than just knowing its current value or historical averages; it demands an appreciation for the broader macroeconomic landscape and individual sector dynamics.
Macroeconomic Factors Influencing P/E
The P/E ratio of the S&P 500 is profoundly influenced by overarching macroeconomic trends.
- Inflation: High and persistent inflation can erode corporate profits and make future earnings less certain, typically leading to lower P/E multiples. Central banks’ responses to inflation, particularly interest rate hikes, can also dampen investor appetite for risk assets.
- Interest Rates: As discussed, interest rates play a critical role. Low rates tend to inflate P/Es by making future earnings more valuable in present terms and by making bonds less attractive alternatives. Rising rates have the opposite effect.
- GDP Growth: A robust and growing economy generally supports higher corporate earnings and, by extension, higher P/E multiples as investors anticipate continued prosperity.
- Geopolitical Events: Wars, trade disputes, and political instability can introduce significant uncertainty, causing investors to demand a higher earnings yield (lower P/E) for taking on equity risk.
Sectoral Differences in Valuation
It’s also important to remember that the S&P 500 is an aggregate of 11 sectors, each with its own valuation characteristics. Technology and growth-oriented sectors often command higher P/E ratios due to expectations of rapid future earnings growth. Conversely, mature industries like utilities, consumer staples, or financials, which typically have slower, more stable growth, tend to trade at lower P/E multiples.
When the S&P 500’s P/E is particularly high or low, it’s worth investigating which sectors are driving that trend. A high overall P/E driven by a few mega-cap tech stocks might indicate concentrated risk, whereas a broad-based elevation might suggest widespread optimism.
Long-Term Investing Principles
Ultimately, while the current S&P 500 P/E ratio provides valuable context, it should rarely be the sole determinant of an investment strategy, especially for long-term investors. A balanced approach incorporates:
- Dollar-Cost Averaging: Consistently investing a fixed amount over time, regardless of market highs or lows, helps smooth out entry points and reduces the impact of short-term market fluctuations, including P/E volatility.
- Diversification: Spreading investments across different asset classes, sectors, and geographies reduces risk and ensures that no single market factor disproportionately impacts your portfolio.
- Understanding Your Risk Tolerance: Your investment decisions should always align with your personal financial goals and ability to withstand market ups and downs.
- Avoiding Market Timing: Trying to perfectly time market entries and exits based on P/E ratios is notoriously difficult and often leads to missed opportunities. A long-term perspective focused on fundamental value and disciplined investing generally yields better results.
The P/E ratio is a powerful analytical tool when used wisely, as one piece of a larger, more intricate puzzle.
The “current” P/E ratio of the S&P 500 is a constantly moving target, a complex number reflecting both the tangible earnings of hundreds of companies and the intangible hopes and fears of millions of investors. While a high P/E can signal caution and a low P/E opportunity, these are never standalone indicators. By understanding the P/E ratio’s calculation, its various forms, historical context, and its interplay with other financial metrics and macroeconomic forces, investors can gain a more profound insight into the market’s pulse. Ultimately, the P/E ratio serves as an invaluable guide, not a definitive oracle, for navigating the intricate world of investment. It empowers us to ask better questions and make more informed decisions, fostering a disciplined and thoughtful approach to building wealth over the long term.
aViewFromTheCave is a participant in the Amazon Services LLC Associates Program, an affiliate advertising program designed to provide a means for sites to earn advertising fees by advertising and linking to Amazon.com. Amazon, the Amazon logo, AmazonSupply, and the AmazonSupply logo are trademarks of Amazon.com, Inc. or its affiliates. As an Amazon Associate we earn affiliate commissions from qualifying purchases.