
For anyone looking to invest in the stock market or simply understand the health of the broader economy, the S&P 500 is an indispensable benchmark. It’s more than just a list of companies; it’s a powerful indicator, a snapshot of American corporate prowess, and often, a proxy for the entire U.S. stock market. Understanding its average return is crucial for investors, financial planners, and anyone keen on building wealth. However, the seemingly simple question “what is the average return on the S&P 500?” opens up a nuanced discussion involving historical data, economic context, and various methodological considerations. This article will delve into the historical performance of this vital index, explore the factors that shape its returns, and provide a comprehensive perspective on what investors can realistically expect.
Understanding the S&P 500 and Its Significance
Before we dissect the numbers, it’s essential to grasp what the S&P 500 truly represents and why its performance is so widely tracked. It’s not just a collection of stocks; it’s a carefully curated index designed to reflect a significant portion of the U.S. economy.
What is the S&P 500?
The S&P 500, or Standard & Poor’s 500, is a stock market index that tracks the performance of 500 of the largest publicly traded companies in the United States. These companies are selected by S&P Dow Jones Indices based on criteria such as market size, liquidity, and sector representation, rather than simply being the 500 largest by market capitalization. The index is market-capitalization weighted, meaning companies with larger market values have a greater impact on the index’s overall performance. From tech giants like Apple and Microsoft to financial institutions, healthcare providers, and consumer discretionary leaders, the S&P 500 offers a broad and diverse exposure to the American economy. Its selection criteria ensure that it represents industries proportionately, making it a robust barometer for the stock market.
Why is the S&P 500 a Benchmark?
The S&P 500’s status as a benchmark index is unparalleled. It is widely considered the best single gauge of large-cap U.S. equities and a leading indicator of U.S. economic health. For professional money managers, comparing their portfolio’s performance against the S&P 500 is a standard practice to assess their success. If an actively managed fund consistently underperforms the S&P 500, investors might question the value of its higher fees. For individual investors, the S&P 500 serves as a proxy for the overall market return, helping them set realistic expectations for their own investment portfolios. Its broad coverage and stringent selection process make it a reliable and widely accepted standard for evaluating investment performance and understanding market trends.
How the S&P 500 is Calculated
The S&P 500 index value is determined by a market-capitalization-weighted methodology. This means that the impact of each company’s stock price movement on the index is proportional to its total market value (share price multiplied by the number of outstanding shares). For instance, a 1% rise in Apple’s stock price, given its massive market capitalization, will have a much greater effect on the index’s overall value than a 1% rise in a smaller component company. This weighting scheme naturally gives more emphasis to larger, more influential companies, which often tend to drive a significant portion of market movements. The index is continuously calculated throughout the trading day, reflecting real-time market sentiment and stock price fluctuations. Regular rebalancing and adjustments are made to ensure the index remains representative of the market and its selection criteria.
Deconstructing the “Average Return”: Historical Performance
When people ask about the “average return,” they are often seeking a simple, concrete number. However, the S&P 500’s average return is anything but simple, fluctuating based on the period analyzed and the method of calculation.
The Long-Term Averages
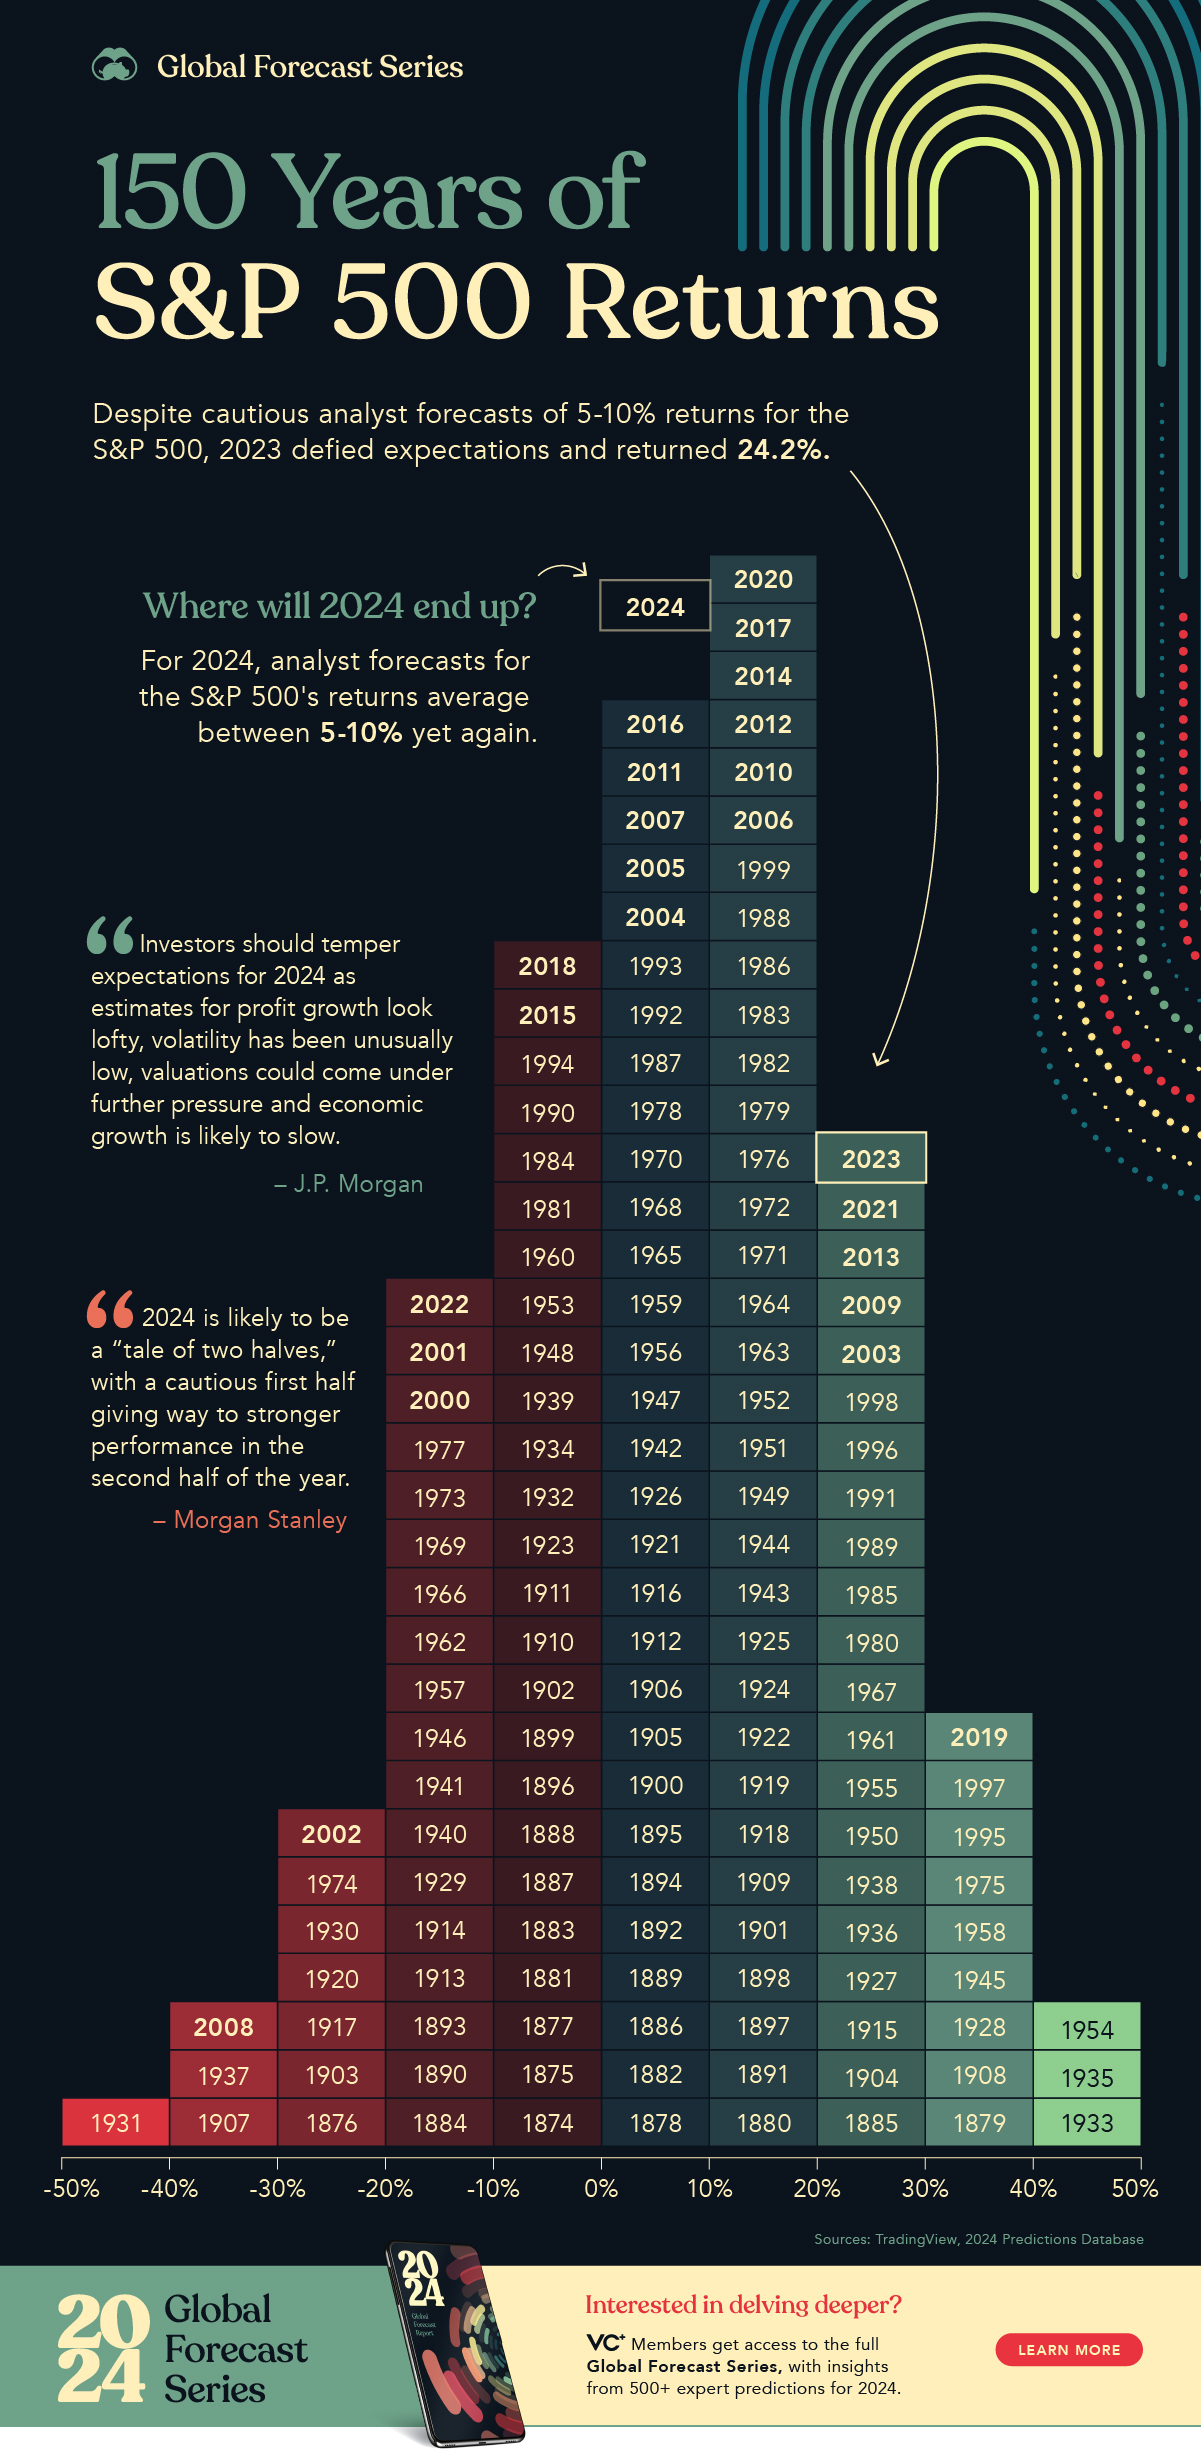
Historically, the S&P 500 has delivered impressive returns over the long run. Since its inception in 1928 through the end of 2023, the average annualized return of the S&P 500 (including dividends, but before adjusting for inflation) has been approximately 10% to 12%. Many financial professionals often quote an approximate 10% annual return for the S&P 500 as a reasonable long-term expectation. It is critical to emphasize that this is an average, and actual annual returns can vary wildly. Some years have seen spectacular gains (e.g., +37.58% in 1995), while others have experienced significant losses (e.g., -37.00% in 2008). This long-term average is the result of compounding gains over many decades, smoothing out the peaks and troughs of market cycles.
Different Time Horizons
While the long-term average is a powerful figure, it doesn’t tell the whole story. The average return changes significantly depending on the time horizon you examine:
- 1-Year Return: Highly volatile and unpredictable. A single year’s return can be anywhere from a substantial loss to a significant gain. This short-term view is often driven by immediate economic conditions, corporate earnings, and investor sentiment.
- 5-Year Return: Provides a slightly more stable picture, starting to smooth out some short-term market noise. However, it can still be heavily influenced by the beginning and end points, especially if they fall during periods of extreme market conditions.
- 10-Year Return: Offers a more reliable view, often encompassing multiple market cycles. This period tends to bring the average closer to the historical mean, as bear and bull markets typically occur within a decade.
- 20-Year Return and Beyond: This is where the power of long-term investing truly shines. Over periods of 20 years or more, the S&P 500 has historically demonstrated remarkable consistency in delivering positive returns, thanks to compounding and the ability to recover from major market downturns. The longer the investment horizon, the higher the probability of achieving returns closer to the long-term historical average.
Total Return vs. Price Return
When discussing S&P 500 returns, it’s crucial to distinguish between “price return” and “total return.”
- Price Return: This refers solely to the change in the index’s value based on the stock prices of its components. It does not include dividends paid by the constituent companies.
- Total Return: This is the more accurate and relevant measure for investors. It includes both the capital appreciation (price return) and the reinvestment of dividends paid by the companies in the index. Historically, dividends have accounted for a significant portion—sometimes as much as 30-40%—of the S&P 500’s total return over the long run. Ignoring dividends dramatically understates the true wealth-generating capacity of the S&P 500. Therefore, when discussing the average return of 10-12%, we are almost always referring to the total return with dividends reinvested.
The Impact of Inflation
Another critical consideration is the impact of inflation. The nominal returns (the 10-12% figure we’ve discussed) represent the raw percentage gain. However, inflation erodes the purchasing power of money over time. To get a true sense of the growth in your wealth, you must consider the “real return.” The real return is calculated by subtracting the rate of inflation from the nominal return. For example, if the S&P 500 returns 10% in a year and inflation is 3%, your real return is approximately 7%. Historically, the average real return of the S&P 500 has been closer to 7% to 8% annually over very long periods. This distinction is vital for long-term financial planning, as it reflects the actual increase in your buying power.
Factors Influencing S&P 500 Returns
The S&P 500’s returns are not arbitrary; they are the cumulative outcome of numerous interconnected economic, corporate, and global forces. Understanding these drivers helps contextualize past performance and anticipate future trends.
Economic Cycles and Market Volatility
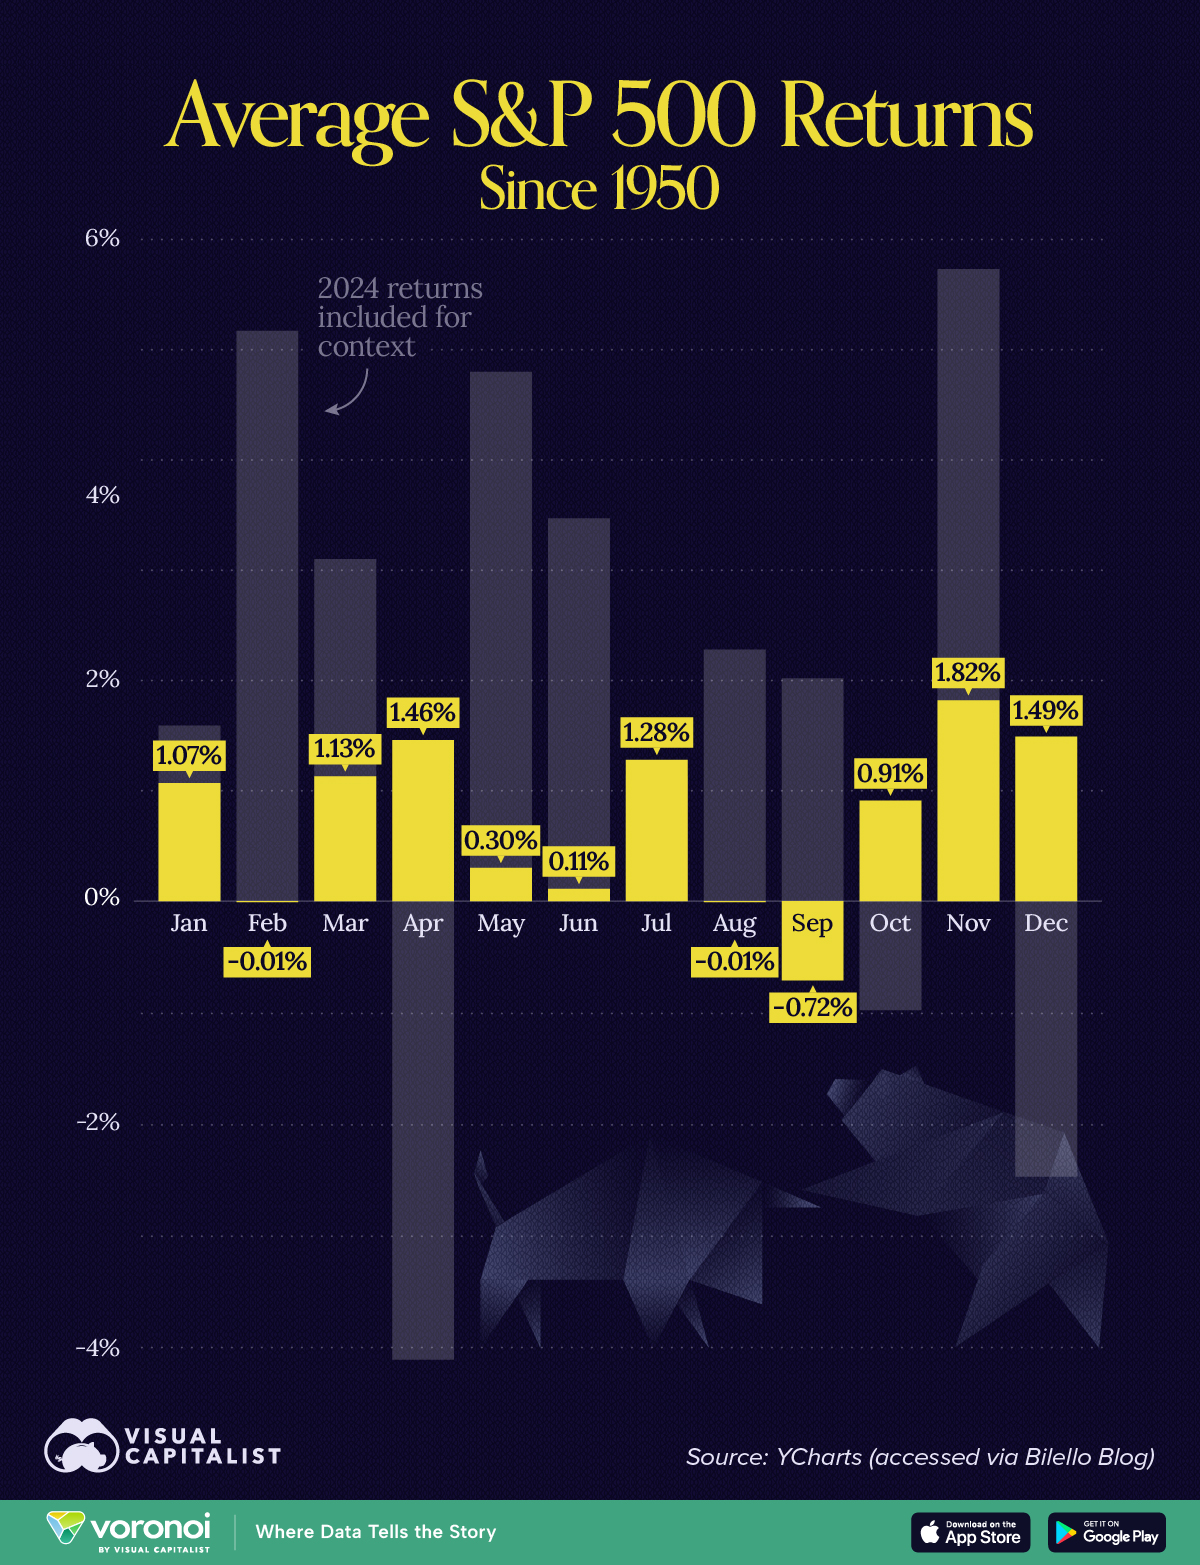
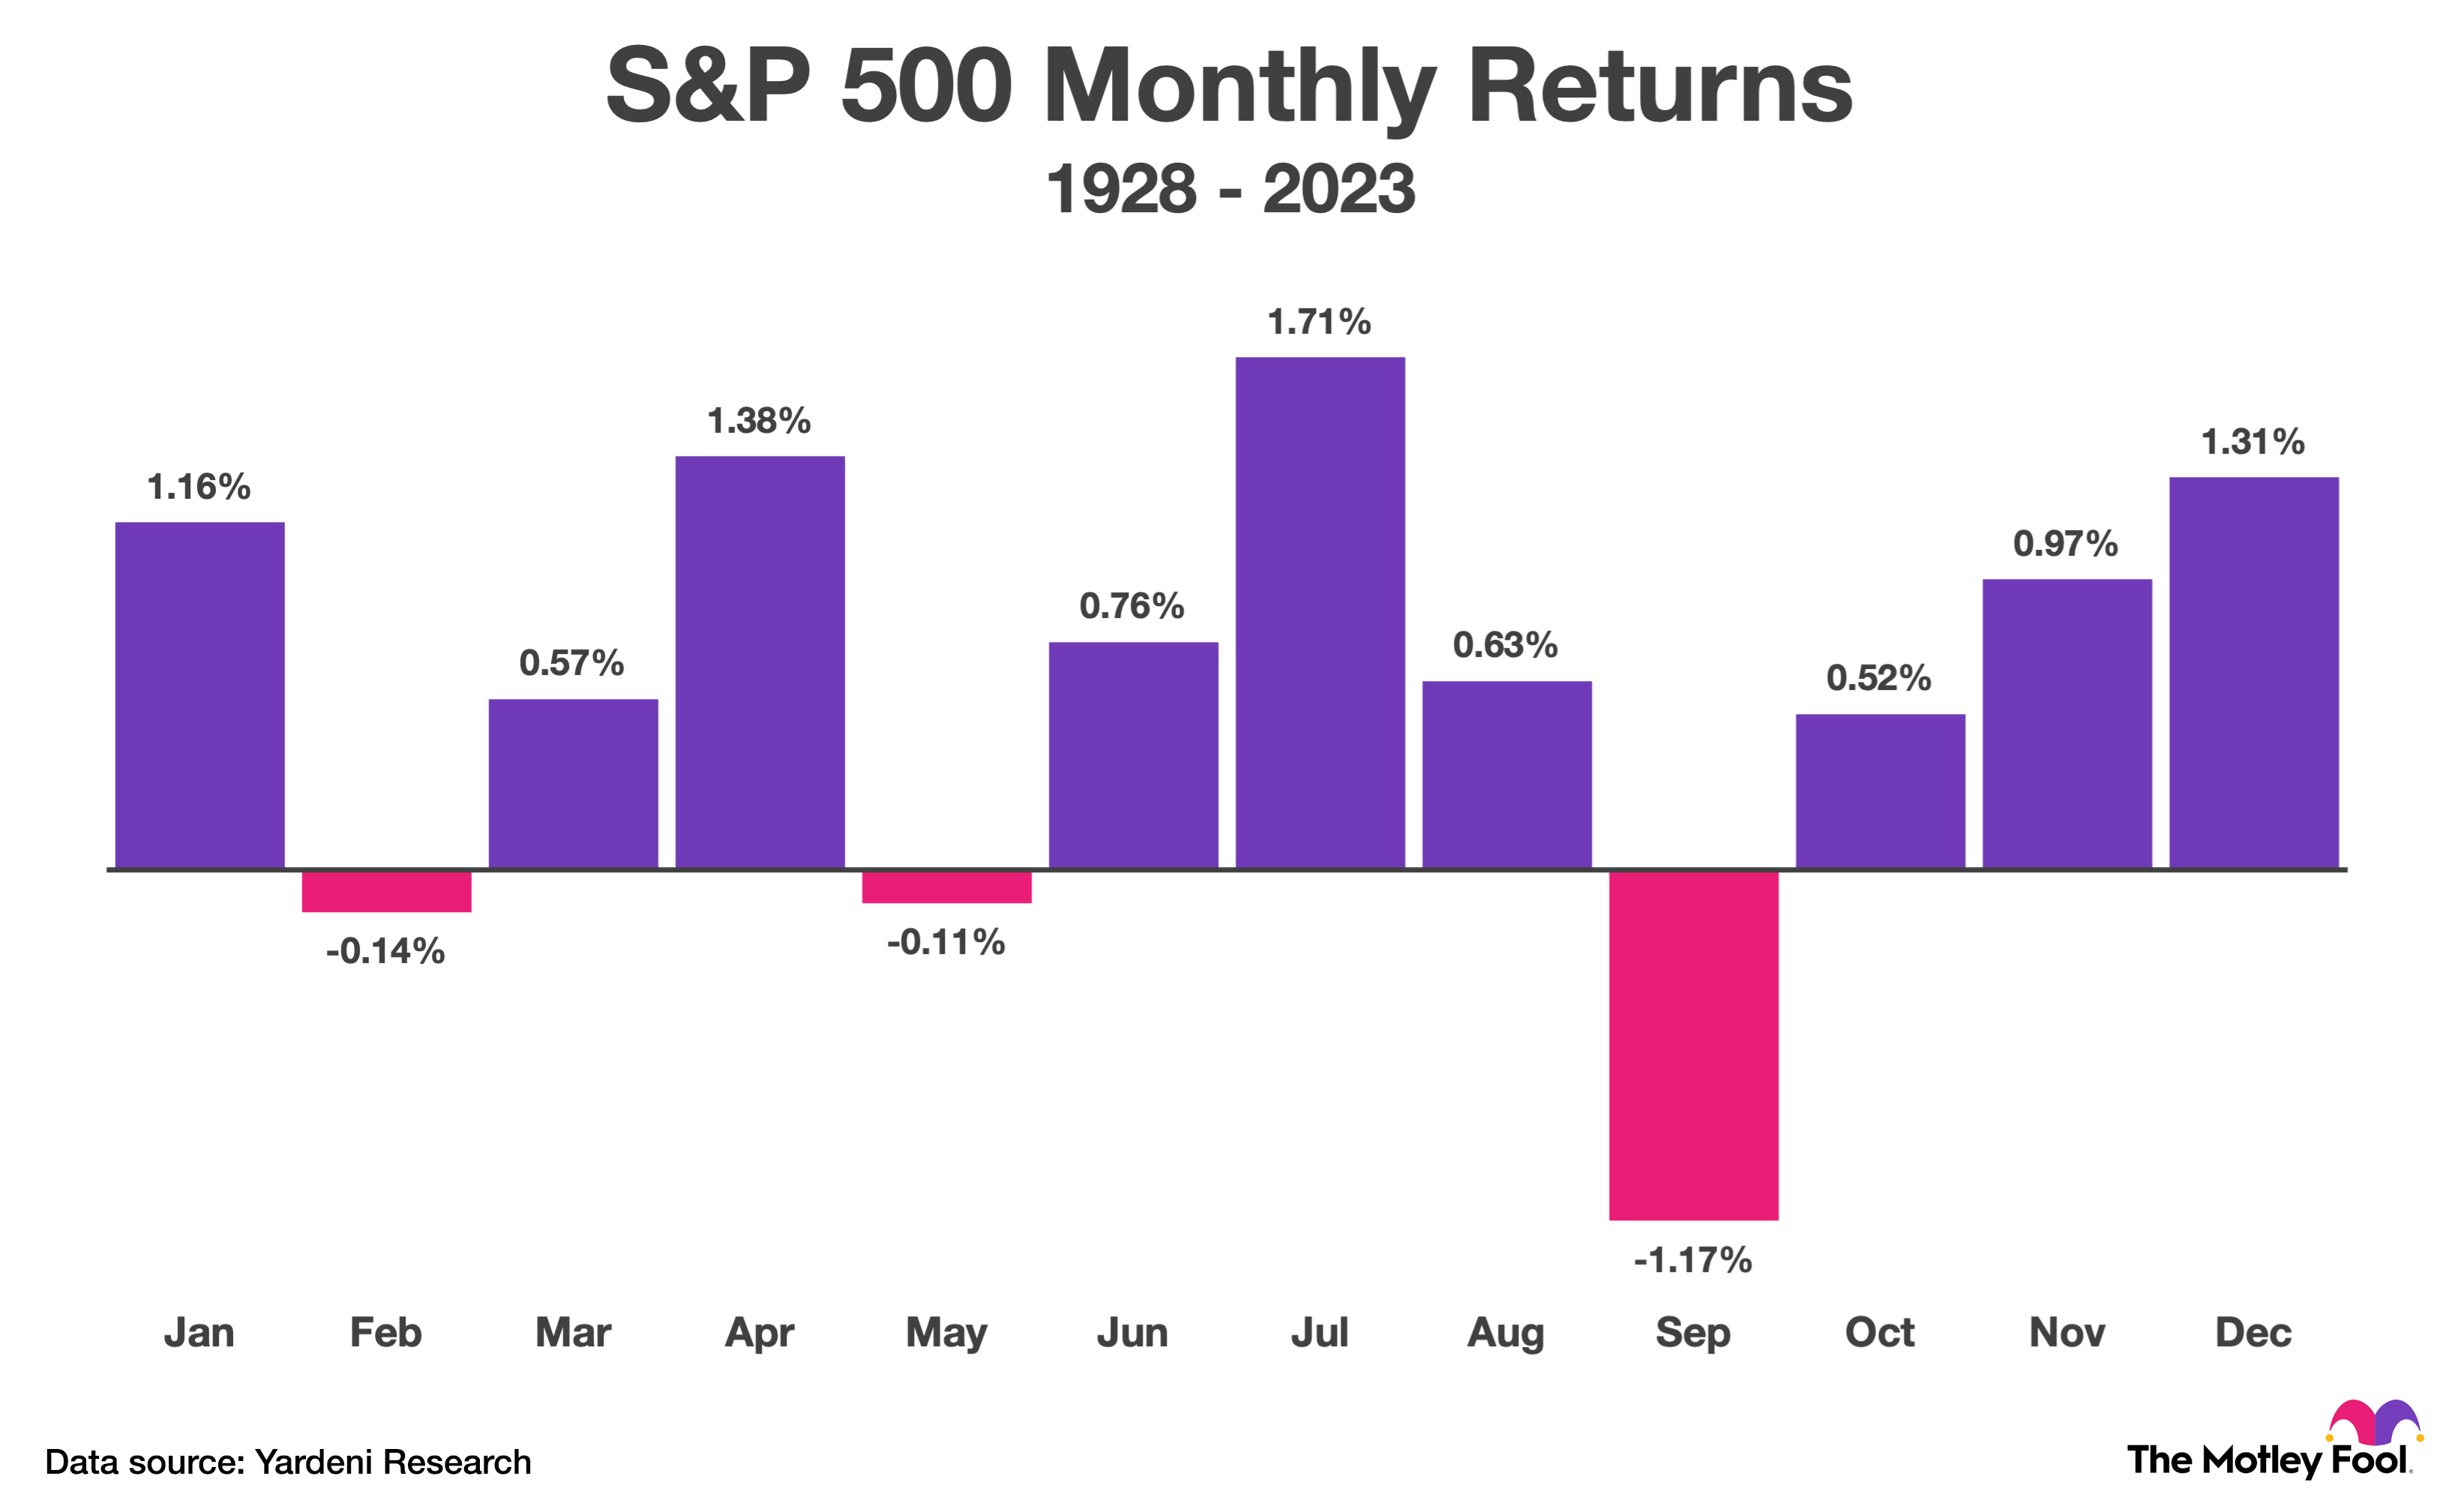
The stock market, and by extension the S&P 500, moves in cycles, often mirroring broader economic cycles of expansion and contraction. During periods of economic growth (expansion), corporate earnings typically rise, leading to higher stock prices and strong S&P 500 returns. Conversely, economic downturns (recessions) often result in decreased corporate profitability, investor panic, and falling stock values. Market volatility, characterized by sharp upward and downward swings, is an inherent feature of these cycles, influenced by factors like GDP growth, employment rates, consumer spending, and interest rate policies set by central banks.
Corporate Earnings and Profitability
At its core, the S&P 500’s performance is fundamentally tied to the earnings and profitability of its constituent companies. Sustainable growth in corporate profits drives stock prices higher over the long term. Companies that innovate, expand market share, manage costs effectively, and return value to shareholders through dividends and share buybacks contribute positively to the index. Conversely, widespread earnings disappointments, declining profit margins, or a gloomy outlook from major corporations can drag the entire index down. Analyst expectations for future earnings play a significant role in market sentiment and stock valuations.
Technological Advancements and Innovation
Technological innovation has been a profound driver of S&P 500 returns, particularly in recent decades. The rise of computing, the internet, software, and artificial intelligence has created entirely new industries and transformed existing ones, propelling companies like Apple, Microsoft, Amazon, and Nvidia to immense market capitalizations. These companies often exhibit high growth potential, attracting significant investment and contributing disproportionately to the index’s gains. Disruptive technologies can also lead to the decline of older industries, illustrating the dynamic nature of the S&P 500’s composition and performance.
Geopolitical Events and Global Markets
The S&P 500 does not exist in a vacuum. Geopolitical events, such as wars, trade disputes, political instability in major economies, or global pandemics, can send shockwaves through financial markets. These events can disrupt supply chains, alter consumer behavior, increase uncertainty, and directly impact corporate earnings and investor confidence. Furthermore, as many S&P 500 companies have significant international operations, their performance is increasingly linked to the health of the global economy and the stability of international relations. A slowdown in China, for example, can impact the revenues of many U.S. multinationals.
Monetary and Fiscal Policy
Government fiscal policy (spending and taxation) and central bank monetary policy (interest rates, quantitative easing/tightening) exert considerable influence over the S&P 500. Low interest rates, for instance, make borrowing cheaper for companies (boosting investment) and make equities relatively more attractive than bonds (boosting stock prices). Conversely, rising interest rates can make borrowing more expensive, dampen economic activity, and increase the appeal of bonds, potentially cooling the stock market. Government spending on infrastructure, tax cuts, or stimulus packages can also directly or indirectly boost corporate revenues and consumer confidence, affecting S&P 500 returns.
Investing Strategies Around S&P 500 Performance
Given the S&P 500’s historical track record, many investors choose to incorporate it into their portfolios. Several strategies can help individuals leverage its long-term growth potential.
Passive Investing: Index Funds and ETFs
One of the most popular and effective ways to invest in the S&P 500 is through passive investing vehicles like S&P 500 index funds or Exchange Traded Funds (ETFs). These funds aim to replicate the performance of the index by holding the same stocks in the same proportions. They offer broad diversification across 500 companies, typically come with very low expense ratios compared to actively managed funds, and require minimal intervention. Investing in an S&P 500 index fund or ETF allows investors to capture the average market return without the need for stock picking or market timing, making it an ideal choice for long-term growth.
Dollar-Cost Averaging
Dollar-cost averaging (DCA) is an investment strategy where an investor invests a fixed amount of money at regular intervals, regardless of the S&P 500’s price. For example, investing $200 every month into an S&P 500 ETF. This strategy helps mitigate the risk of market timing. When prices are high, your fixed investment buys fewer shares; when prices are low, it buys more shares. Over time, this averages out the purchase price and can lead to a lower average cost per share, potentially enhancing returns compared to trying to time the market’s ups and downs. DCA is particularly effective for long-term investors contributing regularly to their portfolios.
Rebalancing Your Portfolio
While investing in the S&P 500 provides exposure to equities, a well-rounded portfolio typically includes other asset classes like bonds or international stocks. Over time, market movements can cause your asset allocation to drift from your target. For example, a strong S&P 500 performance might make your equity allocation grow larger than intended. Rebalancing involves periodically selling a portion of your overperforming assets (like S&P 500 funds) and buying underperforming ones to bring your portfolio back to your desired asset allocation. This disciplined approach helps manage risk, keeps your portfolio aligned with your financial goals, and can even involve selling high and buying low, subtly optimizing returns.
The Importance of a Long-Term Perspective
Perhaps the most crucial strategy for S&P 500 investors is maintaining a long-term perspective. While the index experiences volatility and occasional significant drawdowns in the short term, its historical trajectory over decades has been consistently upward. The power of compounding, where your earnings generate further earnings, is most evident over extended periods. Attempting to time the market by jumping in and out often leads to missing key recovery periods or significant upswings. Patience, discipline, and the willingness to ride out market fluctuations are paramount to realizing the S&P 500’s average long-term returns.
Risks and Considerations for S&P 500 Investors
While the S&P 500 offers compelling long-term potential, it is not without risks. Investors should be aware of these factors to make informed decisions and manage their expectations.
Market Volatility and Drawdowns
Despite its long-term average, the S&P 500 experiences significant short-term volatility. Market corrections (declines of 10-20%) and bear markets (declines of 20% or more) are normal, albeit uncomfortable, parts of the investment cycle. Investors must be prepared for these drawdowns, which can occur unpredictably and last for extended periods. While the market has always recovered historically, there’s no guarantee that past performance will perfectly repeat. The psychological impact of seeing one’s portfolio value decline can be challenging, underscoring the need for emotional discipline.
Concentration Risk
While diversified across 500 companies, the S&P 500 is still relatively concentrated. It focuses exclusively on large-cap U.S. equities. This means it lacks exposure to small-cap companies, international markets, or other asset classes like real estate or commodities. A downturn in the U.S. economy or a prolonged slump in large-cap stocks could significantly impact an S&P 500-only portfolio. For true global diversification, investors often complement their S&P 500 exposure with international equity funds and other asset classes.
Inflation Risk
As discussed, inflation erodes purchasing power. Even if the S&P 500 delivers solid nominal returns, high inflation can significantly diminish the real (inflation-adjusted) returns. During periods of elevated inflation, the market may struggle to keep pace, reducing the actual wealth growth for investors. While stocks generally offer some protection against inflation over the very long term, there can be periods where inflation outstrips market gains.
Regulatory and Political Risk
Changes in government regulations, tax policies, trade agreements, or political stability can impact corporate profitability and, consequently, S&P 500 returns. For example, new antitrust legislation, changes to corporate tax rates, or stricter environmental regulations could affect the operating environment and earnings of component companies. These risks are inherent in investing in any market, and the S&P 500, being a broad market index, is broadly exposed to them.
Fees and Expenses
While S&P 500 index funds and ETFs typically have low expense ratios, these fees are still a factor. Even a seemingly small annual fee of 0.03% or 0.05% can compound over decades, eating into your returns. It’s crucial for investors to be aware of the expense ratios of any fund they choose and opt for the lowest-cost options available to maximize their net returns. Transaction costs, if applicable, should also be considered, though many brokers now offer commission-free ETF trading.
In conclusion, the S&P 500’s average return, historically ranging from 10% to 12% annually in nominal terms (or 7% to 8% real returns, including dividends reinvested), represents a powerful long-term wealth generator. It is a testament to the enduring growth and innovation of American corporations. However, this average is a composite of highly volatile short-term movements, influenced by a complex interplay of economic, corporate, and global factors. By understanding its construction, historical nuances, underlying drivers, and associated risks, investors can strategically leverage the S&P 500’s potential through disciplined, long-term investing approaches like passive index funds and dollar-cost averaging, making it a cornerstone of many successful financial plans.
aViewFromTheCave is a participant in the Amazon Services LLC Associates Program, an affiliate advertising program designed to provide a means for sites to earn advertising fees by advertising and linking to Amazon.com. Amazon, the Amazon logo, AmazonSupply, and the AmazonSupply logo are trademarks of Amazon.com, Inc. or its affiliates. As an Amazon Associate we earn affiliate commissions from qualifying purchases.