
The seemingly simple question, “where is x and y on a graph,” unlocks a fundamental concept underpinning virtually every digital interaction, from designing a sleek user interface to rendering complex 3D worlds in video games. Far from being a mere academic exercise, understanding the Cartesian coordinate system—the framework that defines X and Y—is essential for anyone delving into software development, data visualization, digital art, or even just comprehending how our screens display information. In the realm of technology, X and Y are not just abstract variables; they are concrete addresses in a digital space, dictating position, movement, and relationship.
The Cartesian Coordinate System: A Universal Language for Location
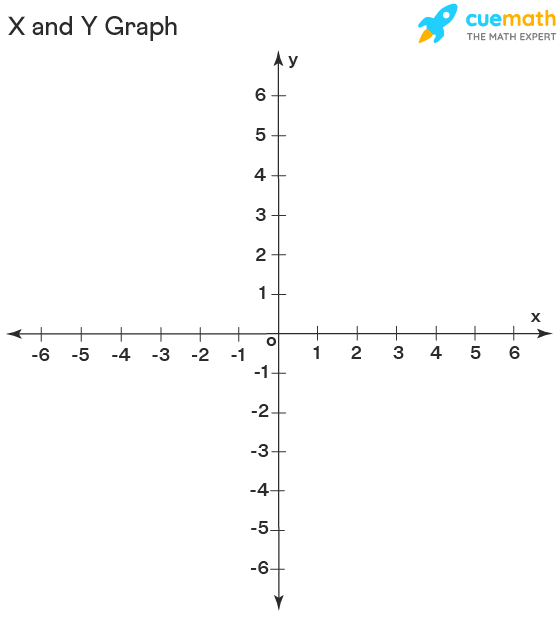
At its core, a graph, particularly in the context of technology, relies on the Cartesian coordinate system, named after the French mathematician René Descartes. This system provides a method for uniquely determining the position of any point in a plane by using two numbers, typically called the coordinates of the point. These coordinates represent the point’s perpendicular distances from two fixed perpendicular lines, called the axes.
Defining the Axes: X as Horizontal, Y as Vertical
In a standard two-dimensional Cartesian graph, we define two primary axes:
- The X-axis (Horizontal Axis): This line runs horizontally, typically from left to right. Values along the X-axis represent horizontal displacement. Moving to the right increases the X-value, while moving to the left decreases it. Positive X-values are to the right of the origin, and negative X-values are to the left.
- The Y-axis (Vertical Axis): This line runs vertically, typically from bottom to top. Values along the Y-axis represent vertical displacement. Moving upwards increases the Y-value, while moving downwards decreases it. Positive Y-values are above the origin, and negative Y-values are below.
A point on the graph is then represented by an ordered pair (x, y), where ‘x’ is its position along the horizontal axis and ‘y’ is its position along the vertical axis. For example, the point (3, 2) would be located 3 units to the right of the Y-axis and 2 units above the X-axis.
The Origin: The Starting Point of All Digital Space
The point where the X-axis and Y-axis intersect is called the origin. It is designated by the coordinates (0, 0). This is the absolute reference point from which all other positions are measured. In many mathematical and scientific contexts, the origin (0,0) is typically located at the center of the graph, allowing for both positive and negative values in all directions. However, as we’ll explore, in digital environments like computer screens, the origin often shifts to a corner, profoundly influencing how applications position elements.
From Paper to Pixels: X and Y in Digital Interfaces
While the fundamental principles of the Cartesian system remain, their application in digital technology often introduces specific conventions that differ from traditional mathematical graphs. Understanding these nuances is crucial for anyone involved in digital design or development.
Screen Coordinates: Top-Left as (0,0) in Many Applications
One of the most significant differences in digital interfaces, such as computer screens, web browsers, or mobile apps, is the placement of the origin. Instead of the center, the top-left corner of the screen or a specific display area is typically designated as the origin (0,0).
- X-values still increase as you move to the right.
- Y-values, however, often increase as you move downwards. This is a common convention in many graphics libraries, operating systems (like Windows or macOS for UI elements), and web development (CSS, HTML canvas).
This “top-left origin, Y-down” convention simplifies calculations for rendering elements sequentially from top to bottom, which aligns with how text is read and how many user interfaces are constructed. For instance, a button positioned at (100, 50) would be 100 pixels from the left edge and 50 pixels from the top edge of its container.
Graphics Programming: Plotting Points and Shapes
In graphics programming, whether for 2D or 3D applications, X and Y coordinates are the bedrock for drawing anything.
- 2D Graphics: When drawing a line, a rectangle, or a circle on a canvas, you specify the X and Y coordinates for its starting point, endpoints, or center. For example,
drawLine(x1, y1, x2, y2)explicitly uses these coordinates to connect two points. Bitmap images are essentially grids of pixels, each identifiable by its (x,y) coordinate, corresponding to its column and row. - 3D Graphics: While 3D introduces a Z-axis for depth, the X and Y axes still define the horizontal and vertical positions within the 2D projection of the 3D scene onto the screen. Understanding their role is critical for camera positioning, object placement, and scene composition.
User Interface (UI) Design: Positioning Elements with Precision

UI designers and front-end developers rely heavily on X and Y coordinates (often abstracted into layout systems) to precisely place and size elements on a screen. Every button, text box, image, or navigation bar has a defined position relative to its parent container or the screen itself.
- Relative vs. Absolute Positioning: Some systems use absolute X, Y coordinates to pin elements to specific pixel locations, while others use relative positioning where an element’s X, Y might be defined as an offset from another element or respond dynamically to screen size.
- Responsive Design: Even in responsive designs that adapt to different screen sizes, the underlying principles of X and Y coordinate systems dictate how elements scale, align, and reposition themselves to maintain an optimal layout. Tools like Figma, Sketch, and Adobe XD all internally manage element placement using these coordinate systems, albeit often with user-friendly drag-and-drop interfaces.
Beyond Static Points: X and Y in Motion and Data Visualization
The utility of X and Y extends far beyond static positioning. They are dynamic variables crucial for representing movement, tracking changes, and illustrating complex data relationships.
Animation and Game Development: Tracking Movement Over Time
In animation and video games, X and Y coordinates are in constant flux. Every moving character, projectile, camera pan, or visual effect involves continuous updates to its X and Y (and Z) positions over time.
- Game Physics: Game engines use X and Y to calculate trajectories, collisions, and interactions between objects. A character’s jump might involve increasing its Y-coordinate while its X-coordinate changes to simulate forward motion.
- Keyframing: Animators define keyframes at specific points in time, setting the X and Y positions (and other properties) of an object. The software then interpolates the values between these keyframes to create smooth motion.
Data Visualization: Representing Trends and Relationships
Data visualization is one of the most powerful applications of X and Y on a graph. Charts, plots, and dashboards leverage these axes to visually represent data sets, making complex information digestible and understandable.
- Line Charts: The X-axis often represents a continuous variable like time (dates, years), while the Y-axis represents a measured quantity (stock prices, temperature, sales figures). Each point (x, y) then shows the value of the quantity at a specific point in time.
- Bar Charts: The X-axis typically categorizes distinct groups or intervals, and the Y-axis shows their corresponding magnitude.
- Scatter Plots: Both X and Y axes represent quantitative variables, and each point (x, y) signifies an observation, revealing correlations or clusters within the data. Tools like D3.js, Matplotlib, and Tableau all rely on this fundamental coordinate system to render insightful visualizations.
Geospatial Applications: Latitude and Longitude as X and Y Analogs
While not strictly X and Y in the Cartesian sense, latitude and longitude serve as a powerful real-world analog for the coordinate system, especially in mapping and geospatial technologies.
- Latitude: Analogous to the Y-axis, latitude measures the angular distance north or south of the Earth’s equator.
- Longitude: Analogous to the X-axis, longitude measures the angular distance east or west of the prime meridian.
Mapping applications like Google Maps or Geographic Information Systems (GIS) convert these spherical coordinates into planar X, Y coordinates for display on a 2D screen, enabling navigation, location tracking, and analysis of geographical data.
Practical Applications and Tools for Working with X and Y
The understanding of X and Y coordinates permeates countless technological tools and platforms, empowering professionals across various domains.
Software Development Kits (SDKs) and APIs
Every modern operating system (iOS, Android, Windows, macOS) and web browser provides SDKs and APIs that allow developers to programmatically control the placement and manipulation of graphical elements using X and Y coordinates.
- UI Frameworks: Frameworks like React Native, Flutter, and Swift UI provide abstractions over raw pixel coordinates but ultimately resolve to them to render components.
- Game Engines: Unity, Unreal Engine, and Godot provide extensive tools for defining object positions, rotations, and scales using X, Y, and Z coordinates in their respective game worlds.
Design Software and CAD Tools
For designers and engineers, X and Y coordinates are the backbone of their creative and technical processes.
- Vector Graphics Editors: Software like Adobe Illustrator or Inkscape allows users to draw shapes and paths by defining anchor points with precise X and Y coordinates. Scaling and transforming these objects involves manipulating these underlying coordinates.
- Computer-Aided Design (CAD): In engineering and architecture, CAD software (e.g., AutoCAD, SolidWorks) uses highly accurate X, Y, and Z coordinates to design and model objects, ensuring precision in manufacturing and construction.

Spreadsheets and Data Analysis Platforms
Even everyday tools like Microsoft Excel or Google Sheets implicitly use an X, Y grid for their cells, allowing users to reference data points by their column (analogous to X) and row (analogous to Y). More advanced data analysis platforms and libraries (e.g., Python’s Pandas, R’s ggplot2) provide sophisticated means to map data variables to the X and Y axes of a plot, facilitating complex statistical analysis and visualization.
In conclusion, the simple inquiry “where is x and y on a graph” unveils a universal language of location and movement that is indispensable in the digital age. From the fundamental Cartesian system to its specialized implementations across software, design, and data, X and Y coordinates are the unseen pillars supporting our tech-driven world. Mastering this concept is not just about understanding math; it’s about gaining fluency in the grammar of digital interaction and creation.
aViewFromTheCave is a participant in the Amazon Services LLC Associates Program, an affiliate advertising program designed to provide a means for sites to earn advertising fees by advertising and linking to Amazon.com. Amazon, the Amazon logo, AmazonSupply, and the AmazonSupply logo are trademarks of Amazon.com, Inc. or its affiliates. As an Amazon Associate we earn affiliate commissions from qualifying purchases.