
In the intricate world of personal finance, investing, and business strategy, numbers tell a story. But raw numbers alone often lack the context needed for meaningful insights. This is where percentages step in, transforming isolated figures into powerful indicators of proportion, change, and performance. From calculating your savings rate to deciphering investment returns, understanding “what percent is one number of another” is not just a mathematical exercise; it’s a fundamental pillar of financial literacy. It’s the lens through which we evaluate opportunities, manage risks, and make informed decisions that shape our financial future.
This seemingly simple calculation holds the key to unlocking a deeper comprehension of your financial landscape. It allows you to benchmark your spending against your income, compare the profitability of different ventures, track the growth of your investments, and even understand the true cost of debt. Without this foundational skill, navigating the complexities of modern finance can feel like sailing without a compass. This article will demystify the core percentage calculation and demonstrate its indispensable role across various facets of your financial journey.
The Foundational Formula: Deconstructing Percentage Calculation
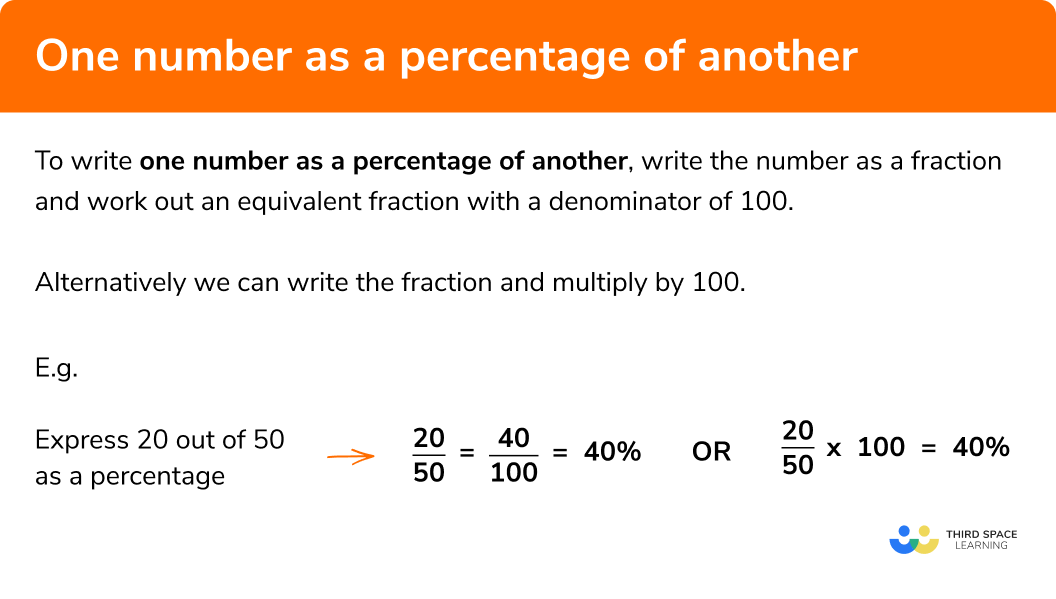
At its heart, calculating what percent one number is of another is about understanding a part’s relation to its whole. It’s a way of expressing a fraction as a proportion out of 100. Once you grasp this basic mechanic, its application across all financial scenarios becomes intuitive.
The Basic Mechanics: Part / Whole x 100
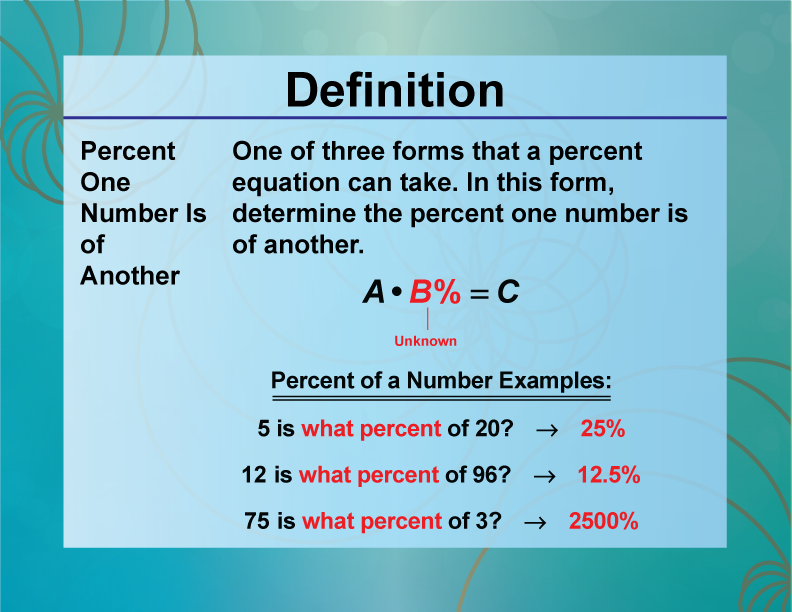
The formula is elegantly simple:
Percentage = (Part / Whole) × 100
Let’s break down each component:
- Part: This is the specific number or amount you are interested in. It represents a portion of the larger total.
- Whole: This is the total, the larger number against which the ‘part’ is being compared. It represents the complete set or amount.
- 100: Multiplying by 100 converts the decimal fraction into a percentage, making it easier to read and compare.
Consider a simple, non-financial example: If you scored 45 out of 50 on a test, to find out what percentage you got, you would calculate: (45 / 50) × 100 = 0.9 × 100 = 90%. Here, 45 is the ‘part’ (your score), and 50 is the ‘whole’ (the total possible score).
Real-World Financial Application: Savings Rate Example
Now, let’s translate this into a practical financial scenario – calculating your savings rate. Your savings rate is a critical metric for personal finance, indicating what percentage of your income you are saving.
Imagine your net monthly income (after taxes) is $4,000, and you manage to save $600 each month.
- Part: Your monthly savings, which is $600.
- Whole: Your net monthly income, which is $4,000.
Applying the formula:
Savings Rate = (Savings / Net Income) × 100
Savings Rate = ($600 / $4,000) × 100
Savings Rate = 0.15 × 100
Savings Rate = 15%
This tells you that you are saving 15% of your income. Understanding this percentage allows you to compare your saving habits against financial benchmarks (like the common recommendation to save 10-20% of your income) and set clear goals for improvement. This foundational understanding is the springboard for deeper financial analysis.
Navigating Personal Finance with Percentages
For individuals, percentages are not just theoretical concepts; they are the bedrock of effective money management. From structuring a budget to tackling debt, a firm grasp of percentage calculations empowers better financial habits and outcomes.
Budgeting and Expense Analysis
One of the most immediate applications of percentages in personal finance is in budgeting. A budget is essentially a plan for your money, and expressing spending categories as percentages of your income provides invaluable perspective.
Let’s say your net monthly income is $5,000.
- If your rent is $1,500, then housing is ($1,500 / $5,000) × 100 = 30% of your income.
- If your grocery bill is $750, then food is ($750 / $5,000) × 100 = 15% of your income.
This percentage-based analysis allows you to apply popular budgeting frameworks, such as the 50/30/20 rule:
- 50% for Needs (housing, utilities, groceries, transportation)
- 30% for Wants (dining out, entertainment, hobbies)
- 20% for Savings & Debt Repayment (retirement contributions, emergency fund, extra debt payments)
By calculating the percentage of your income going into each category, you can quickly identify if you’re overspending in certain areas, enabling you to make adjustments and reallocate funds more effectively. This systematic approach is far more insightful than merely looking at raw dollar amounts.
Debt Management and Interest Rates
Debt is an undeniable part of many people’s financial lives, and understanding the role of percentages is crucial for managing it effectively. Interest rates, for instance, are almost universally expressed as percentages.
The Annual Percentage Rate (APR) on loans (like mortgages, car loans, or credit cards) tells you the yearly cost of borrowing money. If you have a credit card with an 18% APR, this percentage helps you understand the significant cost of carrying a balance. Knowing how to calculate what portion of your monthly payment goes towards interest versus the principal balance empowers you to strategize for faster debt repayment.
For example, if you pay $100 on a loan and $20 of that is interest, then ($20 / $100) × 100 = 20% of your payment went to interest. Tracking this percentage over time can be a powerful motivator to reduce your debt and see your principal balance shrink faster.
Savings Goals and Financial Milestones
Setting and achieving financial goals, whether it’s saving for a down payment, a child’s education, or retirement, becomes significantly more manageable when viewed through the lens of percentages.
Suppose your goal is to save $50,000 for a down payment, and you’ve already accumulated $15,000.
- Percentage of Goal Achieved = ($15,000 / $50,000) × 100 = 30%
This gives you a clear, quantifiable measure of your progress. Regularly calculating this percentage helps maintain motivation and allows for realistic adjustments to your savings plan. It provides a visual roadmap, showing how much more you need to save to reach 100%. Similarly, tracking the percentage of your desired retirement nest egg you’ve accumulated offers a long-term perspective on your financial security.
Unlocking Investment Insights Through Percentages
In the realm of investments, percentages are the universal language. They allow investors to evaluate performance, manage risk, and make strategic decisions across diverse asset classes. Without a firm grasp of percentage calculations, investment analysis would be akin to reading a foreign language.
Return on Investment (ROI): The Investor’s Compass
Perhaps the most critical percentage for investors is the Return on Investment (ROI). ROI measures the profitability of an investment relative to its cost, providing a standardized metric for comparing different investment opportunities.
The formula for ROI is:
ROI = [(Current Value of Investment – Original Cost of Investment) / Original Cost of Investment] × 100
For instance, if you invested $10,000 in a stock that is now worth $12,500:
- Profit = $12,500 – $10,000 = $2,500
- ROI = ($2,500 / $10,000) × 100 = 0.25 × 100 = 25%
This 25% return allows you to objectively assess how well your investment performed. Comparing this to a bank account yielding 2% interest clearly illustrates the power of different investment vehicles. Understanding ROI is fundamental for deciding where to allocate your capital and for evaluating the success of past decisions.
Portfolio Allocation and Diversification
Smart investing often involves diversification – spreading your investments across various asset classes (like stocks, bonds, real estate, commodities) to mitigate risk. This diversification strategy is inherently percentage-based.
An investor might decide on a portfolio allocation target:
- 60% Stocks
- 30% Bonds
- 10% Real Estate Investment Trusts (REITs)
As market values fluctuate, the actual percentages of your portfolio allocated to each asset class will shift. Calculating these current percentages allows you to practice rebalancing, where you buy or sell assets to bring your portfolio back to your target allocation. For example, if your stocks grow to 70% of your portfolio, you might sell some stocks and buy more bonds to return to your 60/30/10 target, maintaining your desired risk profile.
Understanding Financial Statements: Profit Margins and Growth
Even if you’re not a business owner, understanding a company’s financial health is vital for stock investors. Key metrics on financial statements are often expressed as percentages.
- Gross Profit Margin: (Gross Profit / Revenue) × 100 – This tells you the percentage of revenue remaining after subtracting the cost of goods sold. A high gross margin indicates efficient production.
- Net Profit Margin: (Net Income / Revenue) × 100 – This reveals the percentage of revenue that translates into actual profit after all expenses, taxes, and interest are accounted for. It’s a key indicator of a company’s overall profitability.
- Revenue Growth: ([Current Year Revenue – Previous Year Revenue] / Previous Year Revenue) × 100 – This shows the percentage increase or decrease in a company’s sales year over year, indicating its growth trajectory.
By calculating and comparing these percentages for different companies or over different periods, investors gain profound insights into a business’s operational efficiency, profitability, and growth prospects, informing their investment decisions.
Advanced Applications and Common Pitfalls
While the core formula for “what percent is one number of another” is straightforward, there are nuances and common mistakes to avoid that can significantly impact financial understanding.
Understanding Percentage Change vs. Percentage of a Whole
It’s crucial to differentiate between calculating a percentage of a whole and calculating a percentage change.
- Percentage of a Whole: (Part / Whole) × 100. This answers questions like “What percentage of my income did I save?” or “What percentage of the class passed?”
- Percentage Change: ([New Value – Old Value] / Old Value) × 100. This answers questions like “By what percentage did my salary increase?” or “What was the percentage decrease in the stock price?”
For example, if your salary increased from $50,000 to $55,000:
- Percentage Increase = [($55,000 – $50,000) / $50,000] × 100 = ($5,000 / $50,000) × 100 = 0.10 × 100 = 10%.
Confusing these two can lead to misinterpretations of financial data, especially when evaluating performance or growth.
Avoiding Misinterpretations: The Base Matters
One of the most common pitfalls with percentages is failing to consider the base number (the ‘whole’). A large percentage change from a very small base can still represent a small absolute change. Conversely, a small percentage change from a very large base can represent a massive absolute change.
Consider two companies:
- Company A increases profits by 100%, from $1,000 to $2,000.
- Company B increases profits by 10%, from $1,000,000 to $1,100,000.
While Company A had a much larger percentage increase, Company B’s absolute profit increase ($100,000) is far more significant than Company A’s ($1,000). Always scrutinize the underlying numbers to understand the true impact of a percentage. Context is paramount in financial reporting and analysis.
Tools and Calculators for Accuracy
While understanding the manual calculation is essential, you don’t always need to do it by hand. Financial calculators, spreadsheet software (like Excel or Google Sheets), and numerous online tools can quickly perform these calculations for you.
- Spreadsheets: Offer formulas like
=(A2/B2)*100to automate calculations across large datasets. - Online Calculators: Dedicated percentage calculators can handle various scenarios, including tips, discounts, and percentage changes.
These tools are invaluable for efficiency and accuracy, especially with complex figures. However, they are most effective when you first understand the underlying mathematical principles – knowing what to calculate and why it’s relevant.

Conclusion
The question “what percent is one number of another?” might seem like a basic arithmetic query, but its implications in the financial world are profound. From personal budgeting and debt management to sophisticated investment analysis and business valuation, percentages serve as the universal language that translates raw data into actionable intelligence.
Mastering this fundamental concept empowers you to take control of your financial narrative. It enables you to objectively assess your spending, track your savings progress, evaluate investment returns with clarity, and discern the true health of a company. By understanding how to calculate and interpret percentages, you move beyond simply seeing numbers to truly comprehending their meaning and impact on your financial present and future. Embrace this skill, and you’ll find yourself making more informed, strategic, and confident financial decisions every step of the way.
aViewFromTheCave is a participant in the Amazon Services LLC Associates Program, an affiliate advertising program designed to provide a means for sites to earn advertising fees by advertising and linking to Amazon.com. Amazon, the Amazon logo, AmazonSupply, and the AmazonSupply logo are trademarks of Amazon.com, Inc. or its affiliates. As an Amazon Associate we earn affiliate commissions from qualifying purchases.