
In the intricate world of finance, few concepts are as ubiquitous and fundamental as percentages. From the interest rate on your mortgage to the discount on a new purchase, the return on your investment, or the allocation of your budget, understanding “what is percent of what” isn’t merely a mathematical exercise; it’s a cornerstone of financial literacy. Misinterpreting a percentage can lead to poor financial decisions, missed opportunities, or unexpected costs. This article delves into the core mechanics of percentages, demonstrating their pervasive influence across personal finance, investing, and business, and empowering you to navigate your financial landscape with greater clarity and confidence. By demystifying this essential concept, we aim to transform a potentially intimidating calculation into a powerful tool for informed financial management.
The Foundational Math: Deconstructing Percentage Calculations
At its heart, a percentage is simply a way to express a part of a whole as a fraction of 100. The term “percent” literally means “per one hundred.” This makes it an incredibly versatile tool for comparing quantities and understanding proportions, especially when dealing with money. Mastering the basic calculations is the first step towards financial acumen.
The Basic Formula: Part/Whole * 100
The most fundamental percentage calculation involves determining what percentage one number is of another. The formula is straightforward: (Part / Whole) * 100 = Percentage. For instance, if you spent $300 on groceries from a total monthly budget of $2,000, your grocery spending is ($300 / $2,000) * 100 = 15% of your budget. This simple equation underpins almost every financial percentage you’ll encounter, whether you’re calculating a profit margin, the percentage of a portfolio allocated to a specific asset, or the tax rate applied to an income bracket. Understanding which number represents the “part” and which represents the “whole” is critical, as swapping them will yield dramatically different and incorrect results. The “whole” is always the base amount against which the “part” is being measured.
Finding a Percentage of a Number: Discounts, Taxes, and Fees
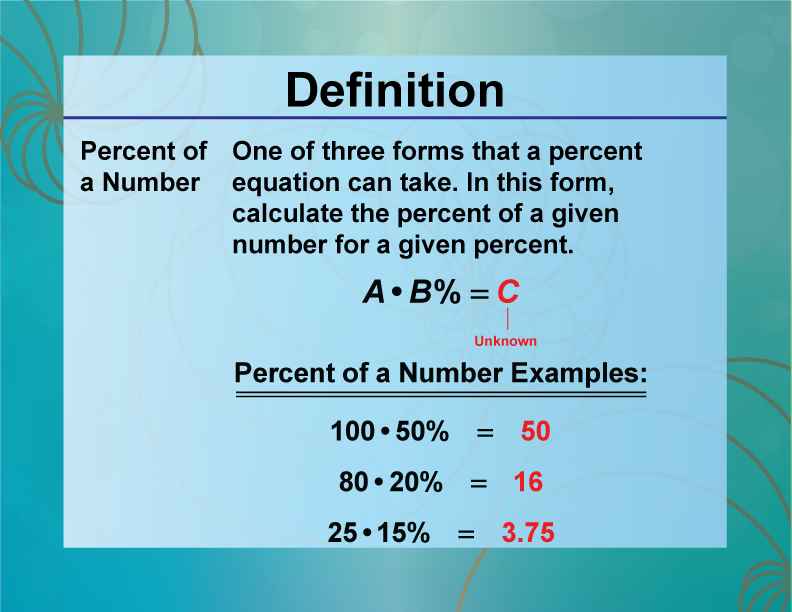
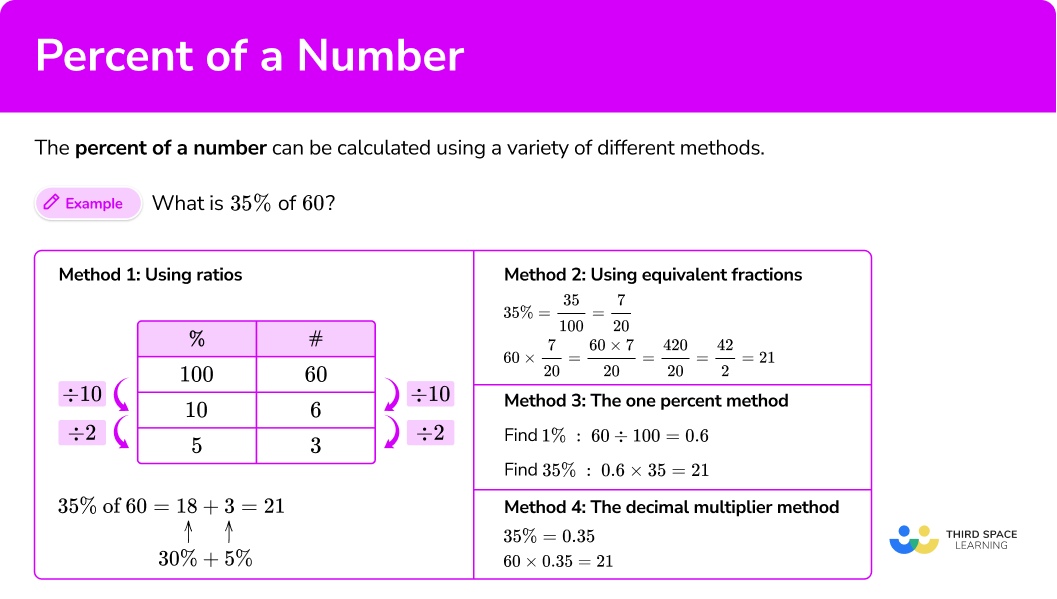
Another common application is calculating a percentage of a given number. This is crucial for understanding discounts, sales tax, commissions, and various fees. The formula here is (Percentage / 100) * Whole = Part. For example, if you want to calculate a 20% discount on an item priced at $500, you would do (20 / 100) * $500 = $100. So, the discount amount is $100. Similarly, if your local sales tax is 8% and you buy something for $100, the tax amount is (8 / 100) * $100 = $8. This calculation allows you to quickly determine the exact monetary impact of percentage-based charges or savings, helping you budget accurately and avoid surprises. Whether it’s the annual fee on a credit card, the interest accrued on a loan, or the commission paid to a real estate agent, this calculation provides the concrete dollar amount tied to a percentage.
Calculating Percentage Change: Growth, Decline, and Volatility
Beyond static proportions, percentages are vital for expressing change over time, whether it’s growth or decline. The formula for percentage change is ((New Value – Old Value) / Old Value) * 100. A positive result indicates a percentage increase, while a negative result signifies a percentage decrease. For example, if your investment portfolio grew from $10,000 to $12,000 in a year, the percentage increase is (($12,000 – $10,000) / $10,000) * 100 = 20%. Conversely, if it dropped from $12,000 to $10,000, the percentage decrease is (($10,000 – $12,000) / $12,000) * 100 = -16.67%. This particular calculation is indispensable for tracking investment performance, analyzing inflation rates, evaluating business growth or contraction, and understanding market volatility. It provides a standardized way to compare performance across different periods or assets, regardless of their absolute values.
Percentages in Personal Finance: Managing Your Everyday Money
For individuals, percentages are not just abstract numbers; they are practical tools for managing daily finances, making informed purchasing decisions, and planning for the future. Integrating percentage thinking into your personal financial habits can significantly enhance your control over your money.
Budgeting and Expense Allocation: The 50/30/20 Rule
One of the most common applications of percentages in personal finance is budgeting. Many financial advisors recommend allocation strategies based on percentages, such as the popular 50/30/20 rule. This rule suggests allocating 50% of your after-tax income to needs (housing, utilities, groceries, transportation), 30% to wants (dining out, entertainment, hobbies), and 20% to savings and debt repayment. By thinking in percentages, you can easily adapt this framework to any income level and ensure that your spending aligns with your financial priorities. For instance, if your net monthly income is $4,000, 50% for needs is $2,000, 30% for wants is $1,200, and 20% for savings is $800. This percentage-based approach makes budgeting flexible and scalable, empowering you to adjust as your income or financial goals evolve without having to recalculate every line item from scratch.
Understanding Interest Rates: Loans, Savings, and Credit Cards
Interest rates, perhaps the most impactful financial percentage for many, dictate the cost of borrowing and the earnings from saving. Whether it’s the annual percentage rate (APR) on a credit card, the interest rate on a car loan or mortgage, or the annual percentage yield (APY) on a savings account, these percentages determine how much you pay for money you borrow or how much money your savings earn. A 15% APR on a credit card means you’re paying 15% of your outstanding balance annually in interest, while a 2% APY on a savings account means your money grows by 2% each year. Understanding the difference between simple and compound interest, and how these percentages accrue over time, is paramount. Even small differences in interest rates can lead to significant variations in total payments on loans or total earnings on savings over the long term, highlighting the importance of comparing rates carefully.
Sales Tax, Discounts, and Financial Product Fees
Almost every transaction involves percentages. Sales tax is added as a percentage of the purchase price, while discounts are subtracted as a percentage. Understanding these allows you to calculate the final price of an item accurately. When a store advertises “30% off,” you can quickly determine your savings and the final price. Similarly, financial products and services often come with fees expressed as percentages, such as mutual fund expense ratios, investment advisory fees, or transaction fees. A 1% management fee on a $100,000 portfolio might seem small, but it amounts to $1,000 per year, a significant sum that directly impacts your net returns. Being adept at these calculations prevents overpaying, allows you to spot genuine deals, and helps you evaluate the true cost of financial services.
Percentages in Investing and Wealth Building: Growing Your Capital
In the realm of investments, percentages are the language of performance, risk, and portfolio management. Investors rely heavily on percentages to measure success, manage diversification, and make strategic decisions aimed at long-term wealth accumulation.
Investment Returns: ROI, CAGR, and Yields
When assessing investments, various percentage metrics are used. Return on Investment (ROI) measures the profitability of an investment relative to its cost, expressed as a percentage. Compound Annual Growth Rate (CAGR) provides a smoothed annual rate of return over multiple years, factoring in the effect of compounding. Dividend yields and bond yields express the income generated by an investment as a percentage of its current price. For example, a stock with a 4% dividend yield means it pays $4 in dividends for every $100 of stock value. Comparing these percentage metrics across different assets, such as stocks, bonds, or real estate, is crucial for evaluating their historical performance and potential future returns. A 10% annual return on a $100,000 portfolio generates $10,000 in gains, a figure vital for planning future financial milestones.
Portfolio Allocation and Diversification
Smart investing involves diversifying your assets to manage risk. This is typically done using percentage allocations. For instance, an investor might decide on a 60% stock, 30% bond, and 10% cash allocation. This means that 60% of their total investment capital is dedicated to stocks, 30% to bonds, and 10% to cash. As market values fluctuate, these percentages will change, requiring periodic rebalancing to maintain the desired risk profile. Understanding these percentage allocations is fundamental to constructing a portfolio that aligns with your risk tolerance and financial goals. A higher percentage in volatile assets like stocks implies a higher risk, while a larger percentage in stable assets like bonds suggests a more conservative approach.
Understanding Market Changes and Volatility
Market news frequently reports changes in stock indices (e.g., “The Dow Jones Industrial Average rose by 1.5% today”) or individual stock prices (e.g., “Company X shares plummeted by 7%”). These percentage changes provide a standardized way to gauge market sentiment and asset performance, regardless of the absolute price. Volatility, a measure of how much an asset’s price fluctuates, is also often expressed using statistical percentages. Understanding these percentages helps investors interpret market movements, assess risk, and make timely decisions about buying, selling, or holding investments. A 5% drop in a stock might trigger a “stop-loss” order for a particular investor, or a 10% rise might signal a time to take profits, all based on pre-defined percentage thresholds.
Percentages in Business Finance: Measuring Performance and Profitability
For businesses, percentages are indispensable tools for assessing financial health, operational efficiency, and market standing. They provide a common language for stakeholders—investors, managers, and creditors—to understand complex financial data.
Profit Margins: Gross, Operating, and Net
Businesses use various profit margins, all expressed as percentages, to evaluate their profitability at different levels.
- Gross Profit Margin: (Gross Profit / Revenue) * 100. This percentage indicates how much profit a company makes from each sale after deducting the direct costs of goods sold. A high gross margin suggests efficient production or strong pricing power.
- Operating Profit Margin: (Operating Profit / Revenue) * 100. This shows profitability after covering both direct costs and operating expenses (like salaries, rent, and marketing). It reflects the efficiency of core business operations.
- Net Profit Margin: (Net Profit / Revenue) * 100. This is the ultimate measure of profitability, indicating what percentage of revenue is left after all expenses, including taxes and interest, have been paid. These percentages are crucial for comparing a company’s performance against industry averages, competitors, and its own historical data, providing insights into its financial health and operational efficiency.
Market Share and Growth Rates
Businesses are keenly interested in their market share, which is their sales revenue expressed as a percentage of the total sales revenue within their industry or market segment. A company with a 25% market share controls a quarter of its industry’s sales. Tracking market share percentages over time helps companies understand their competitive position and growth trajectory. Similarly, revenue growth rates (percentage increase in revenue year-over-year) and customer acquisition rates (percentage of new customers) are vital percentage metrics for assessing a company’s expansion and future potential. These percentages inform strategic decisions about product development, marketing, and expansion into new markets.
Debt-to-Equity Ratios and Financial Health
Financial ratios, many of which are percentage-based, offer insights into a company’s financial structure and risk profile. The debt-to-equity ratio, for instance, expresses the proportion of debt financing relative to equity financing. While not always a direct percentage, it often leads to discussions where debt is compared as a percentage of total capital or where interest payments are a percentage of earnings. Other ratios like current ratio or quick ratio also assess liquidity, often interpreted in relation to percentage benchmarks. Investors and lenders use these percentages to evaluate a company’s leverage, its ability to meet short-term and long-term obligations, and its overall financial stability. A company with a high debt-to-equity ratio might be seen as riskier, impacting its ability to secure future loans or attract investors.
Avoiding Common Pitfalls and Misinterpretations
While percentages are powerful, they can also be misleading if not understood correctly. Misinterpretations often arise from a lack of clarity about the “whole” or comparing percentages without considering their base values.
The Importance of the “Whole” (Base Value)
The most common mistake is forgetting or misidentifying the “whole” (the base value) when interpreting a percentage. A 10% increase might sound impressive, but 10% of $100 is $10, while 10% of $1,000,000 is $100,000. The absolute impact is vastly different. Similarly, comparing a 50% market share in a niche market of $1 million to a 5% market share in a global market of $1 billion needs careful consideration of the base. Always ask: “Percentage of what?” This helps contextualize the number and understand its true significance. A 2% management fee on a large institutional fund could translate to millions of dollars, whereas a 2% fee on a small personal portfolio might be negligible in absolute terms.
Absolute vs. Relative Change
It’s crucial to distinguish between absolute change and relative (percentage) change. If your investment drops from $100 to $50, that’s an absolute loss of $50, and a 50% relative loss. If it then rises from $50 back to $100, that’s an absolute gain of $50, but a 100% relative gain. The percentages are different because the base (the “whole”) changed. People often mistakenly believe a 50% loss followed by a 50% gain brings them back to square one, but this is incorrect due to the shifting base. This distinction is particularly relevant in volatile markets where percentage swings can be dramatic and understanding the impact requires looking at both the percentage and the underlying dollar amounts.
Compounding Effects and Long-Term Impact
Percentages, especially interest rates and investment returns, often operate under the principle of compounding. Understanding how percentages compound over time is vital for long-term financial planning. A seemingly small percentage interest rate on a loan can accumulate into a substantial amount over decades, just as a modest percentage return on an investment can grow exponentially due to the power of compounding. Forgetting this long-term impact of percentages can lead to underestimating debt burdens or underestimating the potential for wealth creation through consistent savings and investments. The difference between a 7% and 8% annual return over 30 years on a significant sum can be hundreds of thousands of dollars, a testament to the profound effect of seemingly minor percentage differences when compounding is at play.

Conclusion: Empowering Your Financial Journey
The question “what is percent of what?” might seem simple, but its answer unravels the very fabric of financial decision-making. From managing your daily budget and navigating debt to making shrewd investment choices and evaluating business performance, percentages are an indispensable language of money. By mastering the core calculations, understanding their application across personal and business finance, and being mindful of common pitfalls, you equip yourself with a powerful analytical framework. This enhanced financial literacy empowers you to interpret financial information accurately, make informed choices, optimize your resources, and ultimately, steer your financial journey towards greater security and prosperity. Embrace percentages not as a mathematical hurdle, but as a crucial tool for financial empowerment.
aViewFromTheCave is a participant in the Amazon Services LLC Associates Program, an affiliate advertising program designed to provide a means for sites to earn advertising fees by advertising and linking to Amazon.com. Amazon, the Amazon logo, AmazonSupply, and the AmazonSupply logo are trademarks of Amazon.com, Inc. or its affiliates. As an Amazon Associate we earn affiliate commissions from qualifying purchases.