Understanding and visualizing linear functions is a fundamental skill in mathematics, science, engineering, and even economics. While the core principles of graphing have remained constant, the tools and methods we employ have been dramatically transformed by technology. Gone are the days when graph paper, pencils, and rulers were the sole companions of a budding mathematician. Today, a plethora of digital tools, from web-based calculators to sophisticated software, empower users to graph linear functions with unprecedented speed, accuracy, and interactivity. This article will delve into the essence of graphing linear functions, specifically focusing on how modern technology streamlines the process, enhances understanding, and opens doors to deeper analytical insights.
The Foundation: Understanding Linear Functions
Before we dive into the digital realm, it’s crucial to grasp what a linear function is and why its graphical representation holds such significance. Technology, after all, is merely an enabler; the underlying mathematical concept remains paramount.
What is a Linear Function?
At its simplest, a linear function is a mathematical relationship between two variables that, when plotted on a coordinate plane, forms a straight line. It is typically expressed in the slope-intercept form: $y = mx + b$.
- y: The dependent variable, representing the output.
- x: The independent variable, representing the input.
- m: The slope of the line, which indicates its steepness and direction. A positive slope means the line rises from left to right; a negative slope means it falls. It’s calculated as “rise over run.”
- b: The y-intercept, which is the point where the line crosses the y-axis (i.e., when x = 0).
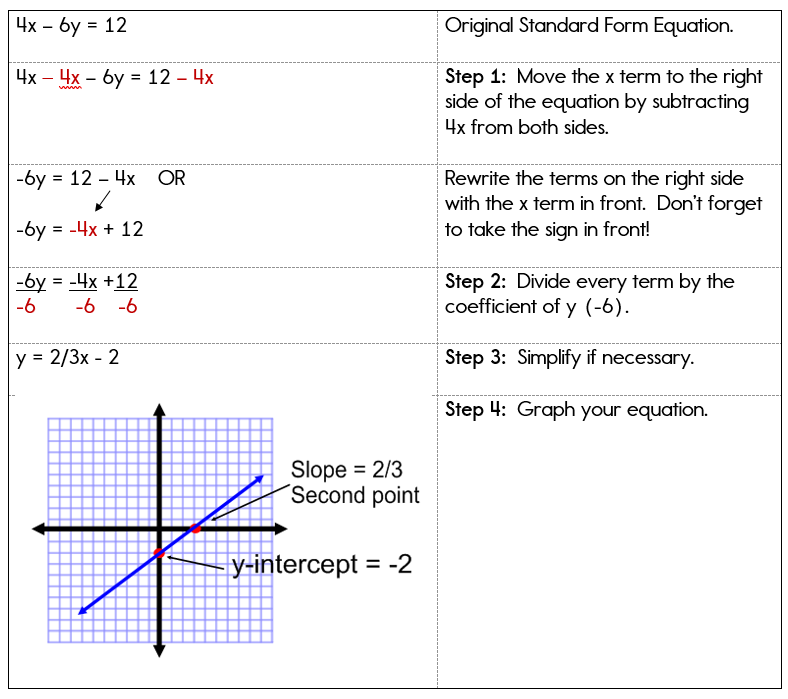
Other forms include the standard form ($Ax + By = C$) and point-slope form ($y – y1 = m(x – x1)$), but all describe the same fundamental straight-line relationship.
Why Graph Linear Functions?
Graphing linear functions provides a powerful visual representation of their behavior. It allows us to:
- Visualize Relationships: Instantly see how changes in one variable affect another.
- Identify Key Features: Easily locate the slope, y-intercept, x-intercept, and points of intersection with other functions.
- Solve Problems: Graphical solutions can often complement algebraic methods, especially when dealing with systems of linear equations.
- Predict Trends: In real-world applications (e.g., finance, physics, data analysis), linear graphs help model and predict future outcomes or understand past trends.
- Enhance Understanding: For many, a visual aid makes abstract mathematical concepts more concrete and intuitive.
Traditional Methods vs. Technological Enhancements
Historically, graphing a linear function involved a methodical, manual process. While understanding this foundational approach is valuable, technology has introduced efficiencies and capabilities that far surpass what manual methods alone can offer.
Revisiting Manual Graphing
The traditional approach to graphing typically involved one of two primary methods:
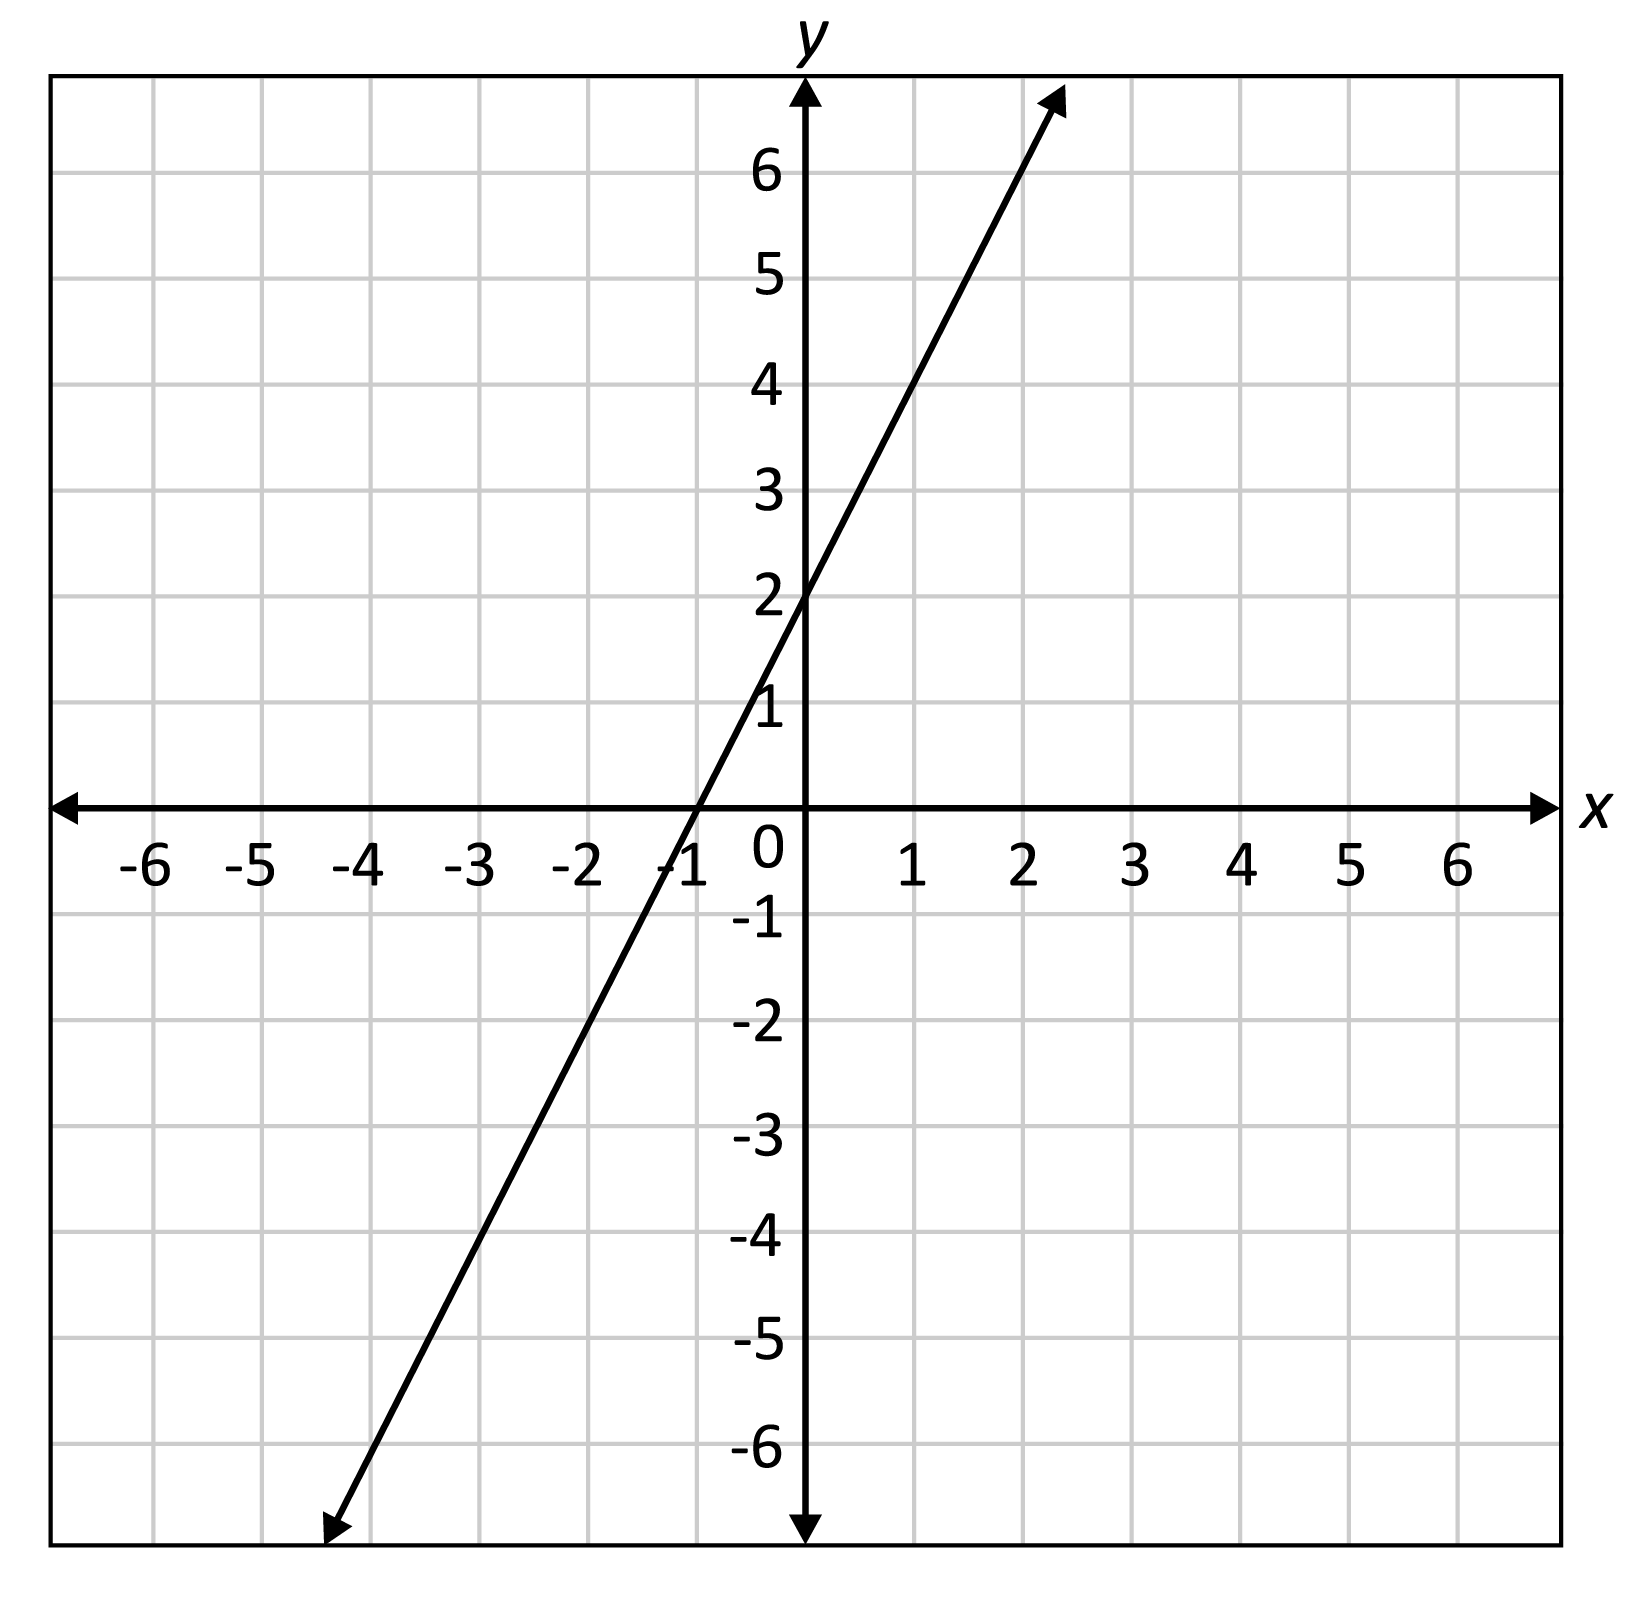
- Slope-Intercept Method: Start by plotting the y-intercept (b) on the y-axis. From this point, use the slope (m = rise/run) to find a second point. For example, if m = 2/3, move up 2 units and right 3 units from the y-intercept. Draw a straight line connecting these two points.
- Point Plotting Method: Choose several x-values, substitute them into the function ($y = mx + b$) to calculate corresponding y-values, and create a table of (x, y) coordinate pairs. Plot these points on the coordinate plane and connect them with a straight line.
These methods are crucial for conceptual understanding but can be time-consuming and prone to human error, especially when dealing with complex numbers, non-integer intercepts, or needing high precision.
The Digital Revolution in Graphing
The advent of personal computers, the internet, and mobile devices has revolutionized how we graph. Digital tools offer:
- Instantaneous Results: Generate graphs in seconds, often as you type the equation.
- Superior Accuracy: Eliminate manual plotting errors and ensure precise representations.
- Interactivity: Dynamically adjust parameters (slope, intercept) and observe real-time changes to the graph.
- Advanced Features: Zoom, pan, identify intercepts, find points of intersection, and even animate graphs.
- Accessibility: Graphing tools are often free, web-based, or available as affordable apps, making them accessible to students and professionals alike.
This shift has moved the focus from the laborious mechanics of drawing to the critical task of interpreting and analyzing the graphical output, fostering deeper mathematical insight.
Essential Tech Tools for Graphing Linear Functions
The digital landscape offers a rich variety of tools, each with its strengths. Choosing the right one depends on your specific needs, whether it’s quick visualization, detailed analysis, or integration into larger projects.
Online Graphing Calculators
These web-based applications are often the easiest entry point for graphing. They require no installation and are incredibly user-friendly.
- Desmos Graphing Calculator: Widely regarded as one of the best. Its intuitive interface allows you to type equations naturally, and it instantly generates interactive graphs. It supports multiple functions, sliders for dynamic parameter changes, and easily identifies key points.
- GeoGebra: A more comprehensive suite that integrates graphing, geometry, algebra, spreadsheets, and calculus. It’s powerful for both basic graphing and more advanced mathematical exploration, offering 2D and 3D graphing capabilities.
- Wolfram Alpha: While not strictly a graphing calculator, Wolfram Alpha can interpret natural language queries (e.g., “graph y = 2x + 3”) and provide not only the graph but also a wealth of related mathematical information, including intercepts, derivatives, and integrals.
Spreadsheet Software
Spreadsheets like Microsoft Excel, Google Sheets, or LibreOffice Calc might not be dedicated graphing calculators, but they are incredibly powerful for generating graphs, especially when you have a dataset or want to visualize a function across a range of values.
- How it Works: You create columns for x-values and y-values (calculated using the function’s formula). Then, you select these data points and use the “Insert Chart” or “Scatter Plot” feature to generate the graph.
- Advantages: Excellent for integrating graphing with data analysis, creating custom charts, and handling multiple datasets. It’s particularly useful for exploring discrete points or tabulated data that represents a linear relationship.

Dedicated Math Software
For those in more technical fields, dedicated math software offers unparalleled power and flexibility.
- MATLAB: A proprietary programming environment primarily for numerical computing, visualization, and algorithm development. It can graph any function with high precision and offers extensive customization.
- Python with Libraries (Matplotlib, NumPy): For those with programming skills, Python, combined with libraries like
Matplotlib(for plotting) andNumPy(for numerical operations), provides a highly flexible and free solution for creating static or interactive graphs. - R (ggplot2): Similar to Python, R is a statistical programming language with excellent graphing capabilities through packages like
ggplot2, offering sophisticated visualization tools.
Mobile Apps for On-the-Go Graphing
Modern smartphones and tablets are powerful enough to host sophisticated graphing applications.
- Desmos App / GeoGebra App: Mobile versions of their web counterparts, offering similar functionality and user-friendly interfaces for graphing on smaller screens.
- Photomath / Microsoft Math Solver: These apps allow you to scan a handwritten or printed equation, and they will not only solve it but also provide step-by-step solutions and a corresponding graph. Ideal for quick checks and learning.
Step-by-Step: Leveraging Tech to Graph Linear Functions
The beauty of technology lies in simplifying complex tasks. Here’s a general guide on how to graph linear functions using typical digital tools, focusing on a popular choice like Desmos.
Inputting Equations
Most online graphing calculators and software aim for intuitive input.
- Open Your Tool: Navigate to a web-based calculator (e.g., desmos.com/calculator) or open your chosen software/app.
- Locate the Input Bar: There’s usually a prominent input field or line where you can type your equations.
- Type the Equation: Enter your linear function directly. For example, to graph $y = 2x + 3$, simply type
y = 2x + 3.- Syntax: Most tools are forgiving, but ensure you use
*for multiplication if ambiguity exists (e.g.,2*xinstead of2xin some contexts, though2xis usually understood). - Common Forms: You can often input standard form (
2x + 3y = 6) or point-slope form (y - 1 = 2(x - 3)) directly, and the tool will graph them.
- Syntax: Most tools are forgiving, but ensure you use
- Instant Graphing: As you type, the graph will typically appear instantaneously on the coordinate plane.
Customizing Your Graphs
Digital tools offer extensive customization options to make your graphs clearer and more informative.
- Line Appearance: Change colors, line thickness, and line styles (solid, dashed, dotted) to differentiate multiple functions.
- Axis Labels and Ranges: Customize the x-axis and y-axis labels (e.g., “Time (seconds)”, “Distance (meters)”) and adjust the viewing window (minimum and maximum x and y values) to focus on relevant sections of the graph.
- Gridlines: Toggle major and minor gridlines for better readability.
- Annotations: Add text labels, points, or arrows to highlight specific features like intercepts or points of intersection.
- Sliders: For functions with parameters (e.g., $y = ax + b$), many tools allow you to add sliders for
aandb. This lets you dynamically change the slope and y-intercept and observe how the line transforms in real-time, providing powerful visual intuition.
Analyzing and Interpreting Graphs
Beyond just drawing the line, tech tools facilitate deeper analysis.
- Identifying Intercepts: Most tools automatically highlight x-intercepts and y-intercepts when you hover over them or click on the line.
- Finding Points of Intersection: If you graph two or more linear functions, the intersection point(s) will often be automatically identified.
- Evaluating Points: Click anywhere on the line, or enter specific x-values, to find corresponding y-values, and vice-versa.
- Zoom and Pan: Easily zoom in to examine fine details or pan across the graph to explore its behavior over a larger domain.
Exporting and Sharing Results
Once you’ve created and analyzed your graph, you’ll often want to save or share it.
- Image Export: Tools typically offer options to download the graph as an image file (PNG, JPG, SVG) for use in documents or presentations.
- Interactive Links: Some platforms, like Desmos, allow you to save your graph and share a unique URL, enabling others to interact with your live graph.
- Data Export: If you used a spreadsheet, you can export the raw data for further analysis.
Best Practices and Advanced Tips for Tech-Assisted Graphing
Leveraging technology effectively goes beyond just knowing which buttons to press; it involves strategic thinking and a deeper understanding of the tools’ capabilities.
Choosing the Right Tool for the Job
- Quick Visualizations/Learning: Desmos or GeoGebra are excellent for intuitive, interactive exploration.
- Data-Driven Graphing: Spreadsheets are ideal if your linear function arises from a dataset.
- Advanced Mathematical Exploration: Wolfram Alpha, MATLAB, or Python are better suited for complex calculations, symbolic manipulation, or integrating with programming workflows.
- On-the-Go Checks: Mobile apps like Photomath are invaluable for immediate feedback.
Beyond Basic Lines: Exploring Interactivity
Don’t just graph a static line. Utilize the interactive features:
- Experiment with Sliders: Actively change the slope and y-intercept parameters to internalize their effects on the line’s position and steepness. This is a powerful learning tool.
- Graph Systems of Equations: Input multiple linear functions to visually find their intersection point, representing the solution to a system of equations.
- Inequalities: Many tools can graph linear inequalities ($y > mx + b$) to visualize solution regions.
Troubleshooting Common Issues
Even with advanced tools, issues can arise:
- Syntax Errors: Double-check your equation input for typos, missing parentheses, or incorrect operators. Most tools provide immediate feedback on invalid syntax.
- Incorrect Viewing Window: If you don’t see your line, your viewing window might be too small or too far away. Adjust the x-axis and y-axis ranges.
- Overlapping Lines: If two lines are identical or very close, they might appear as one. Adjust colors or zoom in to differentiate them.
- Browser/App Glitches: Sometimes a simple refresh of the web page or restarting the app can resolve minor display issues.
By embracing the technological advancements in graphing, we move beyond the tedious manual plotting and instead focus on the powerful insights that visual representations of linear functions can provide. This shift not only makes mathematics more accessible and engaging but also equips individuals with critical analytical skills for a data-driven world.
In conclusion, graphing linear functions has evolved from a manual exercise to a dynamic, interactive experience, thanks to the vast array of technological tools available today. Whether you’re a student learning the fundamentals, an educator demonstrating concepts, or a professional analyzing data, these digital aids provide unprecedented efficiency, accuracy, and depth of understanding. By mastering these tools, you’re not just graphing lines; you’re unlocking a powerful method for visualizing relationships, solving problems, and making informed decisions in an increasingly complex world.
aViewFromTheCave is a participant in the Amazon Services LLC Associates Program, an affiliate advertising program designed to provide a means for sites to earn advertising fees by advertising and linking to Amazon.com. Amazon, the Amazon logo, AmazonSupply, and the AmazonSupply logo are trademarks of Amazon.com, Inc. or its affiliates. As an Amazon Associate we earn affiliate commissions from qualifying purchases.