
Understanding how to calculate percent increase is a foundational skill for anyone navigating the world of personal finance, investing, or business operations. It’s not merely a mathematical exercise; it’s a critical tool for gauging growth, evaluating performance, and making informed financial decisions. Whether you’re tracking the surge in your stock portfolio, analyzing the upward trend of your side hustle’s income, or assessing the escalating costs of your business, mastering this calculation provides clarity and empowers strategic planning. Without this insight, financial data remains a static collection of numbers, unable to tell the story of progress or setback.

Understanding the Core Concept: Why Percent Increase Matters in Finance
At its heart, percent increase quantifies the relative change between an initial value and a final value when the latter is greater. It expresses this change as a percentage of the original amount, offering a standardized way to compare growth across different scales. For instance, a $100 increase in a $1,000 investment feels different than a $100 increase in a $10,000 investment. Expressed as percentages, however, the former is a 10% increase, while the latter is a 1% increase, immediately highlighting the proportional growth.
In finance, this concept is indispensable. Investors use it to assess the performance of assets, understanding real returns beyond simple dollar amounts. Business owners apply it to track revenue growth, profit margins, and operational costs over time. Individuals leverage it to monitor salary hikes, analyze budget expenditures, or gauge the appreciation of assets like real estate. It moves beyond raw numbers to provide context, enabling comparisons between disparate financial figures and across different periods. Without the ability to calculate and interpret percent increase, identifying significant trends, setting realistic goals, and reacting appropriately to financial shifts becomes significantly more challenging. It forms the bedrock of financial analysis, allowing for a nuanced understanding of financial health and trajectory.
The Universal Formula for Percent Increase
The elegance of the percent increase calculation lies in its simplicity and universal applicability. Regardless of whether you’re analyzing stock performance, sales figures, or personal savings, the underlying formula remains consistent.
The formula for percent increase is:
Percent Increase = ((Final Value - Initial Value) / Initial Value) * 100
Let’s break down each component:
- Initial Value: This is your starting point, the original number or amount you are measuring change from. It could be last year’s revenue, the original price of an asset, or your initial investment.
- Final Value: This is the ending point, the new number or amount after the change has occurred. This could be current revenue, the present value of an asset, or your investment’s current worth.
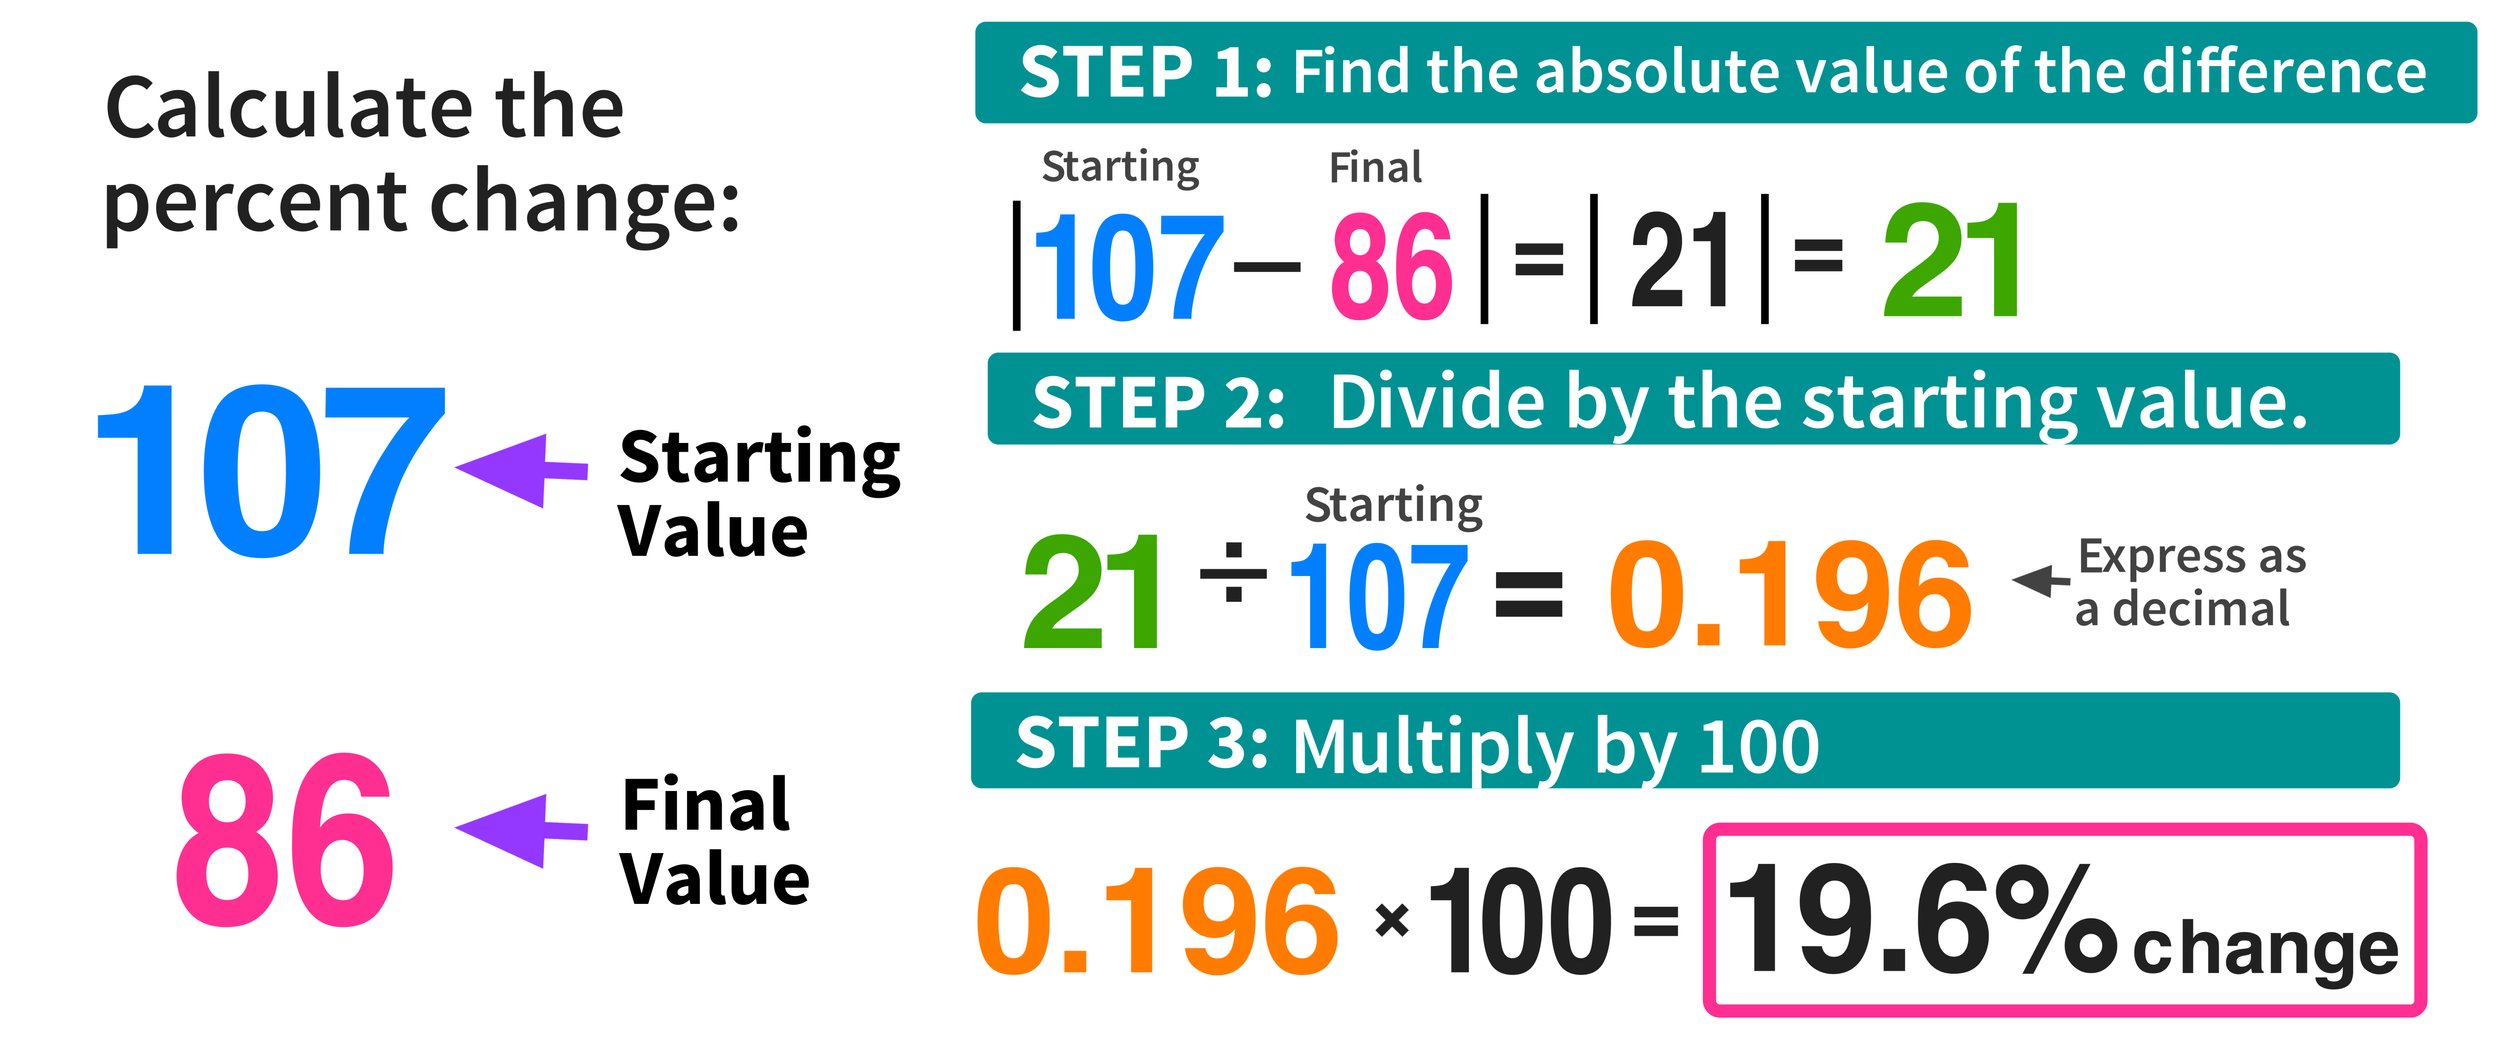
- Difference (Final Value – Initial Value): The first step is to find the absolute increase in value. This tells you how much the quantity has grown in raw terms.
- Divide by Initial Value: By dividing the difference by the initial value, you convert the absolute increase into a decimal representation of the proportional change relative to the starting point.
- Multiply by 100: Multiplying the result by 100 converts this decimal into a percentage, making it easily interpretable as a percent increase.
Step-by-Step Calculation Guide
To ensure accuracy, follow these steps methodically:
- Identify the Initial Value: Clearly define the starting numerical value.
- Example: Your investment portfolio was worth $50,000 at the start of the year.
- Identify the Final Value: Determine the numerical value after the change has occurred.
- Example: Your investment portfolio is now worth $57,500.
- Calculate the Difference: Subtract the Initial Value from the Final Value.
- Calculation: $57,500 – $50,000 = $7,500. (This is the absolute increase.)
- Divide the Difference by the Initial Value: This gives you the decimal representation of the increase.
- Calculation: $7,500 / $50,000 = 0.15.
- Multiply by 100: Convert the decimal to a percentage.
- Calculation: 0.15 * 100 = 15%.
Therefore, your investment portfolio experienced a 15% increase.
Common Pitfalls to Avoid
While the formula is straightforward, several common errors can lead to incorrect results:
- Incorrectly Identifying Initial and Final Values: Always ensure you’re subtracting the initial from the final, and dividing by the initial. Reversing these can lead to a percent decrease calculation or a meaningless result.
- Dividing by the Final Value: A frequent mistake is to divide the difference by the final value instead of the initial value. This fundamentally alters the basis of the percentage, making it an inaccurate representation of the increase relative to the starting point.
- Arithmetic Errors: Even with a simple formula, calculation mistakes can happen, especially with larger numbers or multiple steps. Double-check your subtraction and division.
- Ignoring Context for Negative Numbers: If the Final Value is less than the Initial Value, the formula will yield a negative result, indicating a percent decrease. While the formula technically works, it’s crucial to interpret it correctly in that context (e.g., a -10% increase is a 10% decrease).
- Rounding Too Early: When dealing with complex figures, avoid rounding intermediate results too aggressively. Round only at the final step to maintain precision.
By adhering to the steps and being mindful of these pitfalls, you can confidently and accurately calculate percent increase for any financial scenario.
Applications in Personal Finance and Investing
For individuals, understanding percent increase is not just an academic exercise; it’s a practical skill that directly impacts personal financial health and investment success. It empowers you to track progress, make informed decisions, and adjust your strategies effectively.
Tracking Investment Growth
Perhaps the most common application of percent increase in personal finance is evaluating investment performance. Whether it’s a stock, a mutual fund, a cryptocurrency, or an entire portfolio, knowing the percentage growth provides a clear, standardized metric.

- Example 1: Single Stock Performance
You bought 100 shares of a company at $50 per share (Initial Value = $5,000). A year later, the shares are worth $65 each (Final Value = $6,500).
Percent Increase = (($6,500 – $5,000) / $5,000) * 100 = ($1,500 / $5,000) * 100 = 0.30 * 100 = 30%.
This 30% increase allows you to compare this stock’s performance against market benchmarks or other investments in your portfolio, providing valuable context beyond the $1,500 profit. - Example 2: Real Estate Appreciation
You purchased a home for $300,000 (Initial Value). Five years later, its market value is estimated at $360,000 (Final Value).
Percent Increase = (($360,000 – $300,000) / $300,000) * 100 = ($60,000 / $300,000) * 100 = 0.20 * 100 = 20%.
This 20% appreciation over five years helps you understand the return on your real estate investment, especially when considering potential sale or refinancing.
Analyzing Income and Expense Fluctuations
Percent increase is equally valuable for monitoring your personal income and expenditures, helping you identify trends and manage your budget effectively.
- Example 1: Salary Increase
Your annual salary was $60,000 (Initial Value). After a performance review, it increased to $63,000 (Final Value).
Percent Increase = (($63,000 – $60,000) / $60,000) * 100 = ($3,000 / $60,000) * 100 = 0.05 * 100 = 5%.
Knowing you received a 5% raise provides a clear understanding of its impact relative to your previous income and helps you assess if it’s keeping pace with inflation or industry standards. - Example 2: Budgeted Expense Changes
Last month, your grocery bill was $400 (Initial Value). This month, due to price hikes, it was $460 (Final Value).
Percent Increase = (($460 – $400) / $400) * 100 = ($60 / $400) * 100 = 0.15 * 100 = 15%.
A 15% increase in a common expense like groceries is a significant signal to re-evaluate your spending habits or seek alternatives, highlighting areas where financial discipline might be needed.
Understanding Loan and Debt Increases
While often undesirable, understanding the percent increase in certain financial obligations can be critical for debt management.
- Example: Credit Card Balance Growth
You started the month with a credit card balance of $1,200 (Initial Value). Due to new purchases and interest, your balance grew to $1,350 (Final Value).
Percent Increase = (($1,350 – $1,200) / $1,200) * 100 = ($150 / $1,200) * 100 = 0.125 * 100 = 12.5%.
A 12.5% increase in your balance over a short period is a clear warning sign, prompting you to address the underlying spending or interest charges to prevent further escalation.
By consistently applying the percent increase calculation, individuals gain a more sophisticated understanding of their financial landscape, enabling proactive management rather than reactive responses.
Strategic Use in Business Finance and Entrepreneurship
For business owners and entrepreneurs, calculating percent increase is an indispensable tool for strategic planning, operational analysis, and evaluating overall business health. It moves beyond raw sales figures to reveal the true trajectory and efficiency of various business functions.
Measuring Revenue and Profit Growth
The most apparent application in business is tracking financial performance over time. Percent increase helps businesses understand their market penetration, operational efficiency, and overall financial momentum.
- Example 1: Quarterly Revenue Growth
A startup generated $50,000 in Q1 (Initial Value). In Q2, their revenue climbed to $75,000 (Final Value).
Percent Increase = (($75,000 – $50,000) / $50,000) * 100 = ($25,000 / $50,000) * 100 = 0.50 * 100 = 50%.
A 50% quarterly revenue growth rate is a powerful indicator of successful marketing campaigns, product-market fit, or expanding customer base, providing data-driven encouragement and justification for further investment. - Example 2: Annual Net Profit Increase
A small business reported $120,000 in net profit last year (Initial Value). This year, diligent cost control and increased sales led to a net profit of $144,000 (Final Value).
Percent Increase = (($144,000 – $120,000) / $120,000) * 100 = ($24,000 / $120,000) * 100 = 0.20 * 100 = 20%.
This 20% profit increase demonstrates improved operational efficiency and financial health, informing decisions about expansion, employee bonuses, or reinvestment strategies.
Evaluating Cost Escalation
Just as important as tracking growth is monitoring increases in expenses. Unchecked cost increases can quickly erode profitability, making percent increase a critical metric for financial vigilance.
- Example 1: Raw Material Costs
The cost of a key raw material for a manufacturing business was $10 per unit last year (Initial Value). Due to supply chain issues, it rose to $12 per unit this year (Final Value).
Percent Increase = (($12 – $10) / $10) * 100 = ($2 / $10) * 100 = 0.20 * 100 = 20%.
A 20% increase in a core cost demands immediate attention. It might necessitate price adjustments for products, sourcing new suppliers, or redesigning products to use less of the expensive material. - Example 2: Marketing Expenditure
A business spent $15,000 on digital advertising last quarter (Initial Value). To boost sales, they increased spending to $20,000 this quarter (Final Value).
Percent Increase = (($20,000 – $15,000) / $15,000) * 100 = ($5,000 / $15,000) * 100 ≈ 0.3333 * 100 = 33.33%.
This 33.33% increase in marketing spend should be correlated with corresponding increases in revenue or customer acquisition to assess its return on investment (ROI). If sales didn’t increase proportionally, the strategy might need adjustment.
Benchmarking Performance Against Competitors
Percent increase provides a standardized way to compare your business’s growth against industry averages or direct competitors, even if their absolute scales are vastly different.
- Example: Market Share Growth
Your company’s market share was 10% (Initial Value). Through strategic initiatives, it grew to 12% (Final Value).
Percent Increase = ((12% – 10%) / 10%) * 100 = (2% / 10%) * 100 = 0.20 * 100 = 20%.
This 20% increase in market share, despite a small absolute percentage change, signifies substantial growth relative to your previous standing, offering a clear metric for competitive analysis and investor relations.
By consistently applying percent increase calculations across various aspects of their operations, businesses can gain profound insights into their performance, identify areas for improvement, and make data-driven decisions that foster sustainable growth and profitability.
Leveraging Financial Tools for Automated Calculations
While understanding the manual calculation of percent increase is fundamental, in the fast-paced world of finance, leveraging technology for automated calculations is often more efficient and less prone to error. Various financial tools and software are designed to perform these computations instantly, allowing individuals and businesses to focus more on analysis and strategy rather than manual arithmetic.
- Spreadsheet Software (Excel, Google Sheets): These are perhaps the most ubiquitous tools for financial calculations. They allow you to input your initial and final values into cells and then use a simple formula (e.g.,
=(B2-A2)/A2*100where A2 is the initial and B2 is the final value) to automatically calculate the percent increase. Spreadsheets are excellent for tracking multiple items, visualizing trends, and building complex financial models. - Online Calculators: Numerous websites offer free, dedicated percent increase calculators. These are quick and convenient for one-off calculations, requiring only the input of the two values to provide an instant result. They’re ideal for quick checks of investment returns or expense changes.
- Financial Software and Apps: Personal finance apps (like Mint, YNAB), investment platforms (like Fidelity, Vanguard, Robinhood), and business accounting software (like QuickBooks, Xero) often have built-in dashboards and reporting features that automatically display percent changes. These tools track your data over time and present growth or decline in easily digestible formats, such as “Portfolio up 15% this quarter” or “Expenses increased 8% from last month.”
- Business Intelligence (BI) Tools: For larger businesses, advanced BI tools integrate data from various sources (sales, marketing, operations) and generate dynamic reports that include percent changes for key performance indicators (KPIs). These tools enable real-time monitoring of growth and trends across the entire organization.
While these tools simplify the process, a foundational understanding of how percent increase is calculated remains crucial. This knowledge empowers you to interpret the results correctly, spot potential data entry errors, and critically evaluate the insights provided by automated systems. Ultimately, technology serves as an accelerator, but human financial literacy remains the bedrock of sound decision-making.
aViewFromTheCave is a participant in the Amazon Services LLC Associates Program, an affiliate advertising program designed to provide a means for sites to earn advertising fees by advertising and linking to Amazon.com. Amazon, the Amazon logo, AmazonSupply, and the AmazonSupply logo are trademarks of Amazon.com, Inc. or its affiliates. As an Amazon Associate we earn affiliate commissions from qualifying purchases.