
In the dynamic world of finance and investing, accurately measuring the performance and growth of assets, businesses, or portfolios is paramount. While simple percentage growth can offer a snapshot, it often fails to capture the true, annualized rate of return, especially over multiple periods. This is where the Compound Annual Growth Rate, or CAGR, steps in as a powerful and indispensable metric. CAGR provides a smoothed, annualized rate of return over a specified investment period, assuming that profits are reinvested at the end of each period. It cuts through the volatility of year-to-year fluctuations, offering a clearer, more comparable picture of growth.
For investors, business analysts, and financial planners alike, understanding CAGR isn’t just an academic exercise; it’s a practical necessity. It allows for meaningful comparisons between different investment opportunities, provides insight into the sustained performance of a company, and aids in setting realistic financial goals. If you’ve ever wondered how to truly assess long-term growth beyond the immediate ups and downs, then demystifying CAGR is your essential first step into a more sophisticated financial analysis.
Understanding CAGR: More Than Just Simple Growth
At its core, CAGR is a conceptual return rate that, if applied consistently over each year of an investment period, would yield the final value from the initial value. It’s a hypothetical steady growth rate that bridges the beginning and end points, ignoring the actual path the investment took in between.
What is CAGR?
CAGR stands for Compound Annual Growth Rate. It represents the average annual rate at which an investment grows over a specified period, assuming the profits are reinvested at the end of each year. Unlike simple average growth, which can be misleading due to volatility, CAGR provides a geometric mean return, which is a more accurate representation of consistent growth over time. It essentially smooths out the irregular growth rates that often occur in real-world scenarios, presenting a single, easily understandable figure for the annual growth. This makes it an excellent tool for comparing the performance of different investments, companies, or even entire markets over extended periods.
For example, if a business saw its revenue grow by 10% in year one, decline by 5% in year two, and then jump by 20% in year three, a simple average of these percentages (10 – 5 + 20) / 3 = 8.33% would be inaccurate. This is because it doesn’t account for the compounding effect and the base changes each year. CAGR, on the other hand, provides a single, constant rate that, if applied to the initial revenue over those three years, would result in the final revenue figure.
Why Simple Average Isn’t Enough
The inadequacy of a simple arithmetic average becomes clear when you consider the impact of compounding. A simple average of annual returns does not reflect the actual investment performance because it doesn’t account for the compounding effect where returns themselves generate further returns.
Consider an investment of $1,000 that grows by 50% in year one (to $1,500) and then declines by 30% in year two (to $1,050).
- Simple Average Return: (50% + (-30%)) / 2 = 10%
- Actual Overall Growth: $1,050 from $1,000 = 5% over two years. An average of 2.47% per year (CAGR).
The simple average vastly overstates the actual growth because it doesn’t reflect that the 30% decline in year two was applied to the already grown $1,500, not the initial $1,000. This example highlights why a metric that incorporates compounding is essential for realistic financial analysis.
The Power of Compounding
The concept of compounding is fundamental to understanding CAGR. Compounding refers to the process where the earnings from an investment are reinvested to generate additional earnings. It’s often referred to as “interest on interest” or “returns on returns.” Over time, this snowball effect can significantly amplify wealth. CAGR implicitly incorporates this power by assuming that returns are compounded annually. It provides the constant rate required for an initial investment to grow to a final value through compounding over a specific number of periods. Without an understanding of compounding, the true value and utility of CAGR cannot be fully appreciated.
The CAGR Formula Demystified
Calculating CAGR might seem intimidating at first glance due to its mathematical notation, but it’s quite straightforward once you break down its components. The formula translates the concept of annual compounding into a measurable figure.
Breaking Down the Components
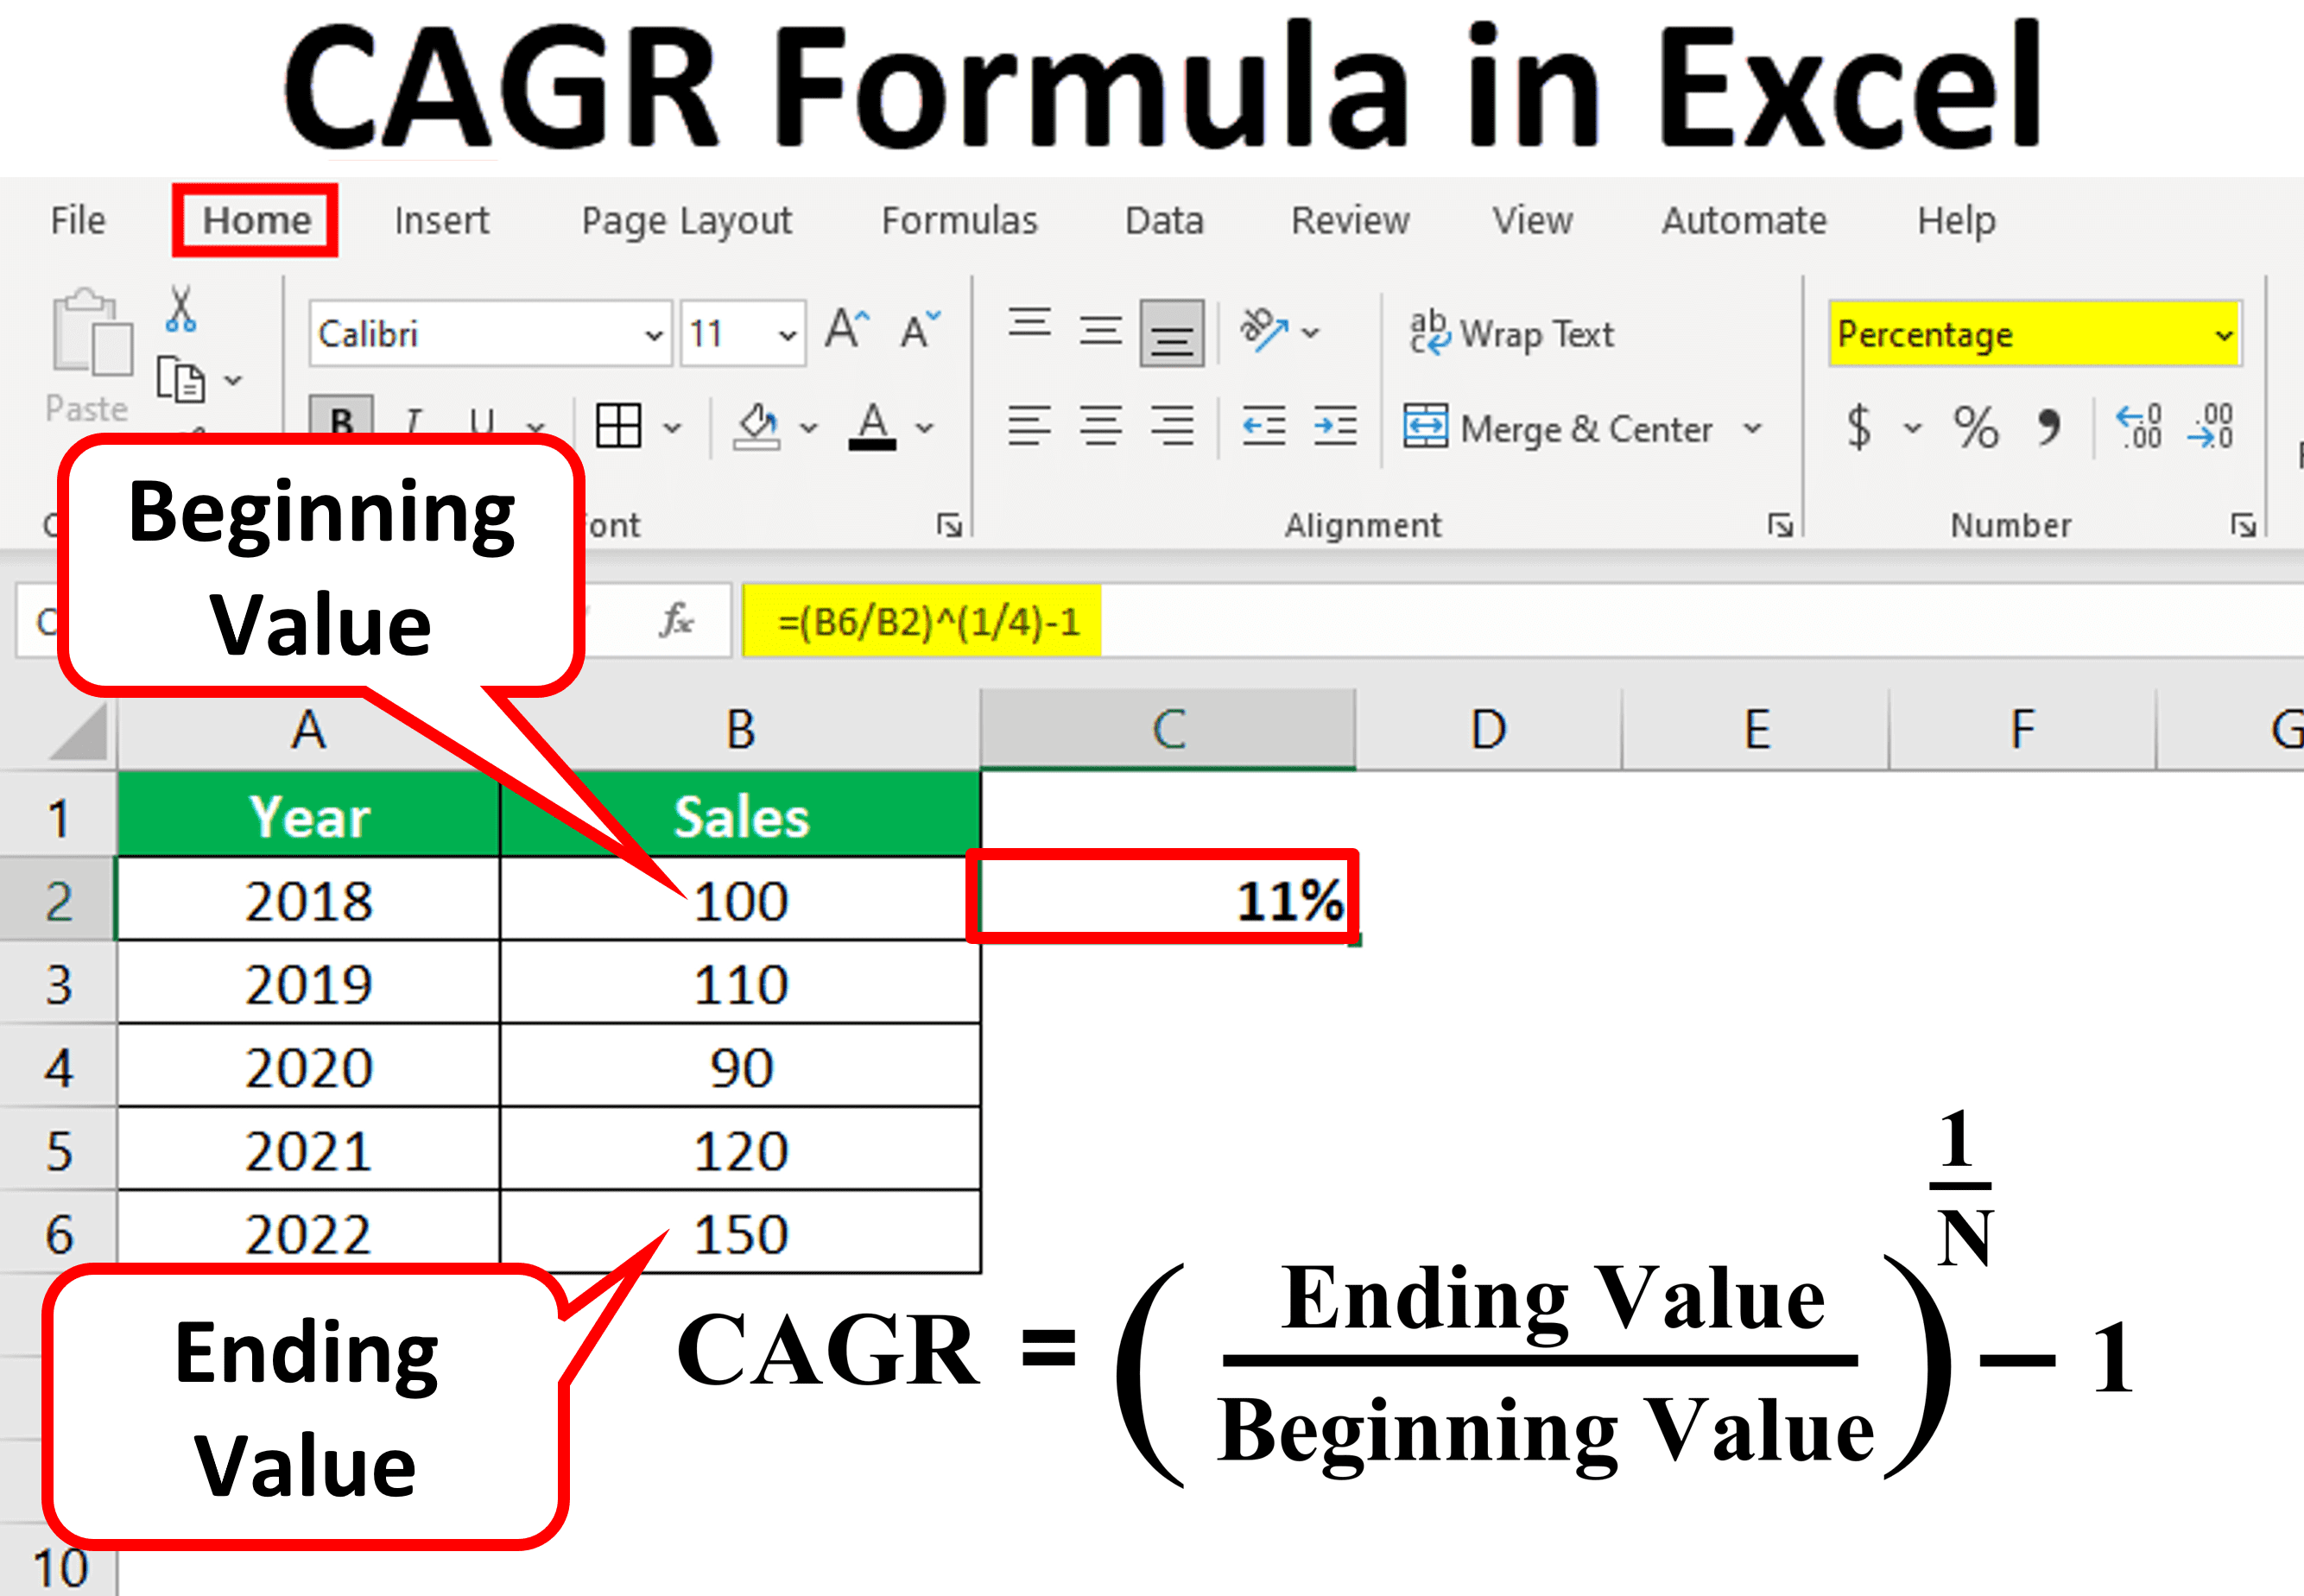
The CAGR formula is as follows:
CAGR = (Ending Value / Beginning Value)^(1 / Number of Years) – 1
Let’s unpack each element:
- Ending Value (EV): This is the final value of the investment, business metric, or portfolio at the end of the specified period. It could be the final portfolio balance, the company’s revenue in the last year, or the ending market value of an asset.
- Beginning Value (BV): This is the initial value of the investment, business metric, or portfolio at the start of the specified period. It’s the starting point from which growth is measured.
- Number of Years (n): This represents the total duration of the investment or the period over which you are calculating the growth rate. It’s the number of compounding periods, typically expressed in years. If the period is in months, you would divide the total months by 12 to get ‘n’ in years.
Step-by-Step Calculation Guide
To calculate CAGR, follow these systematic steps:
- Identify the Beginning Value (BV) and Ending Value (EV): Clearly define the start and end points of your analysis.
- Determine the Number of Years (n): Count the total number of periods (usually years) between the Beginning Value and the Ending Value.
- Divide the Ending Value by the Beginning Value: This gives you the total growth factor over the entire period.
- Raise the Result to the Power of (1 / Number of Years): This step annualizes the total growth factor, effectively reversing the compounding process to find the annual rate.
- Subtract 1 from the Result: This final step converts the annualized growth factor into a percentage growth rate.
Practical Example: Calculating CAGR
Let’s illustrate with a concrete example. Suppose you invested $10,000 in a mutual fund five years ago, and its current value is $16,105.10.
- Beginning Value (BV): $10,000
- Ending Value (EV): $16,105.10
- Number of Years (n): 5 years
Now, let’s apply the formula:
- Step 1: Divide EV by BV
$16,105.10 / $10,000 = 1.61051 - Step 2: Raise to the power of (1/n)
$(1.61051)^{(1/5)}$
$(1.61051)^{0.2}$
This calculation yields approximately $1.1000$ (using a calculator for the fifth root). - Step 3: Subtract 1
$1.1000 – 1 = 0.1000$ - Step 4: Convert to a percentage
$0.1000 * 100 = 10%$
So, the Compound Annual Growth Rate (CAGR) for your investment is 10%. This means that, on average, your investment grew by 10% each year over the five-year period, assuming all profits were reinvested.
Applying CAGR in Real-World Investing and Finance
CAGR is not just a theoretical concept; it has widespread practical applications across various financial domains, making it a critical tool for informed decision-making.

Evaluating Investment Performance
One of the primary uses of CAGR is to evaluate and compare the performance of different investments. When comparing two mutual funds, individual stocks, or even different asset classes over the same period, CAGR provides a standardized metric. A higher CAGR generally indicates better performance over that specific timeframe. It’s especially useful for assessing investments that experience volatile returns year-over-year, as it smooths out the fluctuations to present a consistent growth rate. However, it’s crucial to compare investments over identical timeframes to ensure a fair assessment.
Assessing Business Growth
For business analysts and company management, CAGR is an invaluable tool for understanding and communicating a company’s historical growth trajectory. It can be applied to various financial metrics such as:
- Revenue CAGR: Shows the average annual growth in sales.
- Profit CAGR: Indicates the average annual growth in earnings.
- Market Share CAGR: Measures the growth of a company’s share within its market.
By analyzing these CAGRs over different periods (e.g., 3-year, 5-year, 10-year), stakeholders can gain insights into the company’s sustained competitive advantage, market penetration, and overall operational efficiency. It’s often used in investor presentations and financial reports to highlight long-term trends.
Forecasting Future Growth
While CAGR is a historical metric, it can serve as a basis for forecasting future growth. If a company has consistently achieved a certain CAGR in its revenue or earnings, it might be reasonable (with careful consideration of market conditions and strategic plans) to project a similar growth rate for the near future. However, this is where the limitations of CAGR must be acknowledged. Past performance is not indicative of future results, and relying solely on historical CAGR for projections without adjusting for changing market dynamics or internal company shifts can be misleading. It’s best used as one data point among many in a comprehensive forecasting model.
Personal Finance Applications
In personal finance, CAGR can be a powerful tool for planning and tracking progress towards long-term financial goals.
- Retirement Planning: You can use an assumed CAGR for your retirement portfolio to estimate how much it might grow over several decades, helping you determine if you are on track to meet your retirement savings goals.
- Savings Goals: Whether saving for a down payment on a house, a child’s education, or a significant purchase, applying an estimated CAGR to your savings can help you project when you might reach your target amount.
- Debt Reduction: Although CAGR is typically for growth, the underlying principle of compounding works in reverse for debt. Understanding how interest compounds annually on loans can emphasize the importance of early debt repayment.
Advantages and Limitations of Using CAGR
Like any financial metric, CAGR offers distinct advantages but also comes with important limitations that users must understand to avoid misinterpretations.
Key Benefits
- Smoothes Volatility: One of the most significant advantages of CAGR is its ability to smooth out the year-to-year volatility and fluctuations that characterize many investments. It provides a single, consistent growth rate, making performance easier to understand and compare.
- Annualized Return: It expresses growth as an annual rate, which is intuitive and standard in financial reporting. This allows for direct comparison between investments of different durations, as long as the ‘n’ is clearly defined.
- Ease of Comparison: By providing a standardized annualized rate, CAGR enables investors to compare the performance of vastly different investments (e.g., a stock, a bond, a real estate investment) over the same period.
- Reflects Compounding: It accurately reflects the effect of compounding, which is crucial for long-term investment analysis.
Important Caveats
Despite its utility, CAGR is not without its drawbacks:
- Assumes Consistent Growth: CAGR presents a hypothetical constant growth rate, implying that the investment grew at that rate every single year. In reality, investments rarely grow consistently; they experience ups and downs. CAGR does not reflect the actual intermediate performance or volatility. A fund with a 10% CAGR could have had a smooth 10% gain each year, or it could have experienced 50% gain one year and a 20% loss the next, ending at the same value.
- Sensitive to Start/End Points: The calculated CAGR is highly dependent on the chosen beginning and ending values. Selecting a period that starts during a market trough and ends at a peak can artificially inflate the CAGR, making the performance appear better than it was on average. Conversely, starting at a peak and ending at a trough can suppress the CAGR. It’s crucial to select meaningful periods and consider multiple timeframes.
- Doesn’t Reflect Cash Flows: CAGR only considers the initial and final values. It does not account for any additional cash inflows (e.g., new investments) or outflows (e.g., withdrawals) that occur during the period. For scenarios with irregular cash flows, other metrics like XIRR (Extended Internal Rate of Return) are more appropriate.
- Ignores Risk: CAGR is a measure of return, but it says nothing about the risk taken to achieve that return. An investment with a high CAGR might also carry a significantly higher level of risk.
When to Use Other Metrics
Given its limitations, there are scenarios where other financial metrics might be more suitable:
- Irregular Cash Flows: For portfolios or projects with multiple deposits and withdrawals throughout the period, the Extended Internal Rate of Return (XIRR) is a far more accurate metric than CAGR, as it explicitly accounts for the timing and amount of these cash flows.
- Volatility Analysis: If understanding the fluctuation of returns is critical, metrics like Standard Deviation (to measure risk) or Sharpe Ratio (risk-adjusted return) should be used in conjunction with CAGR.
- Short-Term Performance: For very short periods (e.g., less than a year), simple percentage change is usually sufficient, as the compounding effect is minimal.
- True Average Return (Arithmetic vs. Geometric): While CAGR is a geometric mean and generally preferred for investment returns, an Arithmetic Mean might be useful for understanding the average annual return for a series of independent events, though less so for compounded investments.
Tools and Resources for Calculating CAGR
Fortunately, you don’t need a specialized calculator or advanced mathematical skills to compute CAGR. Several readily accessible tools can perform the calculation for you quickly and accurately.
Spreadsheet Software (Excel, Google Sheets)
Microsoft Excel and Google Sheets are perhaps the most common and versatile tools for financial calculations, including CAGR. The formula can be directly implemented using cell references:
=(Ending_Value/Beginning_Value)^(1/Number_of_Years) - 1
For example, if your Beginning Value is in cell A1, Ending Value in A2, and Number of Years in A3, the formula would be:
=(A2/A1)^(1/A3) - 1
You can then format the cell containing the formula as a percentage. These spreadsheets also offer financial functions, though a direct CAGR function is not always explicit. The power function (POWER) or exponentiation operator (^) makes it simple.
Online Calculators
Many financial websites provide free, user-friendly online CAGR calculators. You typically just need to input the beginning value, ending value, and the number of periods (years), and the calculator will instantly display the CAGR. These are excellent for quick, one-off calculations and for those who are less familiar with spreadsheet formulas.

Financial Software
More sophisticated financial analysis software and investment platforms often integrate CAGR calculations into their reporting features. For instance, brokerage platforms might display the CAGR of your portfolio, and business intelligence tools can automatically calculate and visualize the CAGR of various company metrics over different timeframes. These tools simplify the process further, often allowing you to analyze large datasets and visualize trends more effectively.
In conclusion, the Compound Annual Growth Rate (CAGR) is a foundational metric in the financial world. It offers a powerful, standardized, and insightful way to measure average annual growth over multi-year periods, smoothing out volatility and highlighting the impact of compounding. While it serves as an excellent benchmark for comparing investment performance and assessing business growth, it’s crucial to be aware of its assumptions and limitations. By understanding how CAGR is calculated, when to use it, and when to consider alternative metrics, individuals and professionals can make more informed financial decisions and gain a clearer perspective on long-term value creation.
aViewFromTheCave is a participant in the Amazon Services LLC Associates Program, an affiliate advertising program designed to provide a means for sites to earn advertising fees by advertising and linking to Amazon.com. Amazon, the Amazon logo, AmazonSupply, and the AmazonSupply logo are trademarks of Amazon.com, Inc. or its affiliates. As an Amazon Associate we earn affiliate commissions from qualifying purchases.