
In the dynamic world of finance, few metrics capture the collective pulse of the American economy quite like the S&P 500. For investors, economists, and even the casually curious, the question “What’s the S&P 500 today?” isn’t just about a number; it’s a window into the health of corporate America, a gauge of investor sentiment, and often, a leading indicator of broader economic trends. Its daily fluctuations are dissected, debated, and drive decisions worth billions, making it an indispensable barometer for anyone navigating the financial markets.
Understanding the S&P 500’s performance on any given day requires more than just knowing its current value. It demands an appreciation for what the index represents, the myriad forces that move it, and how those movements translate into real-world implications for personal finance and investment strategies. This article delves into the significance of today’s S&P 500, offering insights into its composition, the factors dictating its daily trajectory, and how informed investors can interpret its signals.

Understanding the S&P 500: A Brief Primer
Before dissecting its daily movements, it’s crucial to grasp the fundamental nature of the S&P 500 index. Often cited alongside the Dow Jones Industrial Average and the Nasdaq Composite, the S&P 500 holds a unique position due to its broad representation and market-cap weighting.
What is the S&P 500 Index?
The S&P 500, short for the Standard & Poor’s 500, is a stock market index that represents 500 of the largest publicly traded companies in the United States, selected by a committee at S&P Dow Jones Indices. Unlike the Dow, which is price-weighted and composed of just 30 stocks, the S&P 500 is market-capitalization-weighted. This means that companies with larger market caps (share price multiplied by the number of outstanding shares) have a greater impact on the index’s value. For instance, giants like Apple, Microsoft, Amazon, and Google (Alphabet) carry significant weight, meaning their individual stock movements can noticeably sway the entire index.
The companies included in the S&P 500 span across all major sectors of the U.S. economy, including technology, healthcare, financials, consumer discretionary, industrials, and more. This broad diversification makes it an excellent proxy for the overall health of the U.S. stock market and, by extension, the broader economy. It’s often referred to as a “bellwether” because its performance is seen as a reliable indicator of economic strength or weakness.
Why its Daily Movement Matters
The daily fluctuation of the S&P 500 isn’t just an abstract number; it has tangible implications. For active traders, daily movements represent opportunities for short-term gains or losses. For long-term investors, while daily swings are less critical, a consistent trend in one direction or another can signal a shift in market sentiment or economic fundamentals that might necessitate a portfolio review.
Moreover, a significant portion of retirement savings and investment portfolios in the U.S. is directly or indirectly tied to the S&P 500. Index funds and Exchange-Traded Funds (ETFs) that track the S&P 500 are immensely popular, offering broad market exposure and diversification. Therefore, if the S&P 500 falls by a certain percentage today, millions of investors might see a corresponding, albeit proportional, dip in the value of their holdings. Conversely, a strong upward day can boost confidence and portfolio values across the board. Its performance also influences corporate borrowing costs, consumer confidence, and even governmental policy discussions, underscoring its pivotal role in the financial ecosystem.
Navigating the Market: How to Find “Today’s” S&P 500 Data
In an age of instant information, getting real-time updates on the S&P 500 is straightforward. However, knowing where to look and what metrics to focus on is key to truly understanding “today’s” performance.
Reliable Sources for Real-Time Quotes
Accessing accurate and timely S&P 500 data is critical for any investor. Fortunately, a wealth of resources exists:
- Financial News Outlets: Reputable financial news websites like Bloomberg, Reuters, The Wall Street Journal, CNBC, and Yahoo Finance offer comprehensive, real-time data for the S&P 500. They often provide charts, news headlines influencing market movements, and expert commentary.
- Brokerage Platforms: If you have an investment account with a broker like Fidelity, Charles Schwab, E*TRADE, or Vanguard, their trading platforms typically provide direct access to real-time S&P 500 data, often integrated with your portfolio view.
- Dedicated Financial Data Sites: Websites like Google Finance and TradingView offer robust charting tools and real-time quotes, allowing users to customize their data view and track historical performance alongside current figures.
- Mobile Apps: Most financial news outlets and brokerage firms offer mobile applications that deliver real-time S&P 500 data directly to your smartphone, ensuring you’re always connected to market movements.
When checking these sources, always ensure they specify “real-time” data, as some free platforms might have a 15-20 minute delay, which can be significant during volatile trading hours.
Key Metrics to Observe
While the headline number of the S&P 500 is important, a deeper dive into specific metrics provides a more nuanced understanding of today’s trading action:
- Current Price/Points: This is the most immediate figure, indicating the index’s value at the current moment.
- Net Change and Percentage Change: These figures show how much the index has risen or fallen since the previous day’s close, both in absolute points and as a percentage. The percentage change is often the most cited figure in news reports as it normalizes the movement, making it easier to compare across different periods.
- Daily High and Low: These numbers indicate the highest and lowest points the S&P 500 reached during the current trading day. They offer context for how much volatility the market has experienced.
- Volume: For the underlying stocks, volume indicates the number of shares traded. While less directly applicable to the index itself, high trading volume on a significant price move (up or down) often lends more credibility to the trend, suggesting broad participation.
- Open and Close Prices: The opening price sets the tone for the day, while the closing price is the official benchmark against which the next day’s performance is measured.
- Year-to-Date (YTD) and 52-Week Range: These provide crucial context, showing the index’s performance since the start of the year and its range over the past year. This helps gauge whether today’s movement is part of a larger trend or an anomaly.
By looking beyond just the current price and considering these complementary metrics, investors can form a more complete picture of the S&P 500’s performance today and its implications.
The Forces Shaping Today’s S&P 500 Performance
The S&P 500’s daily movements are rarely arbitrary. They are the cumulative result of countless decisions made by millions of investors, influenced by a complex web of economic, corporate, and geopolitical factors. Understanding these drivers is key to interpreting “what’s the S&P 500 today.”
Macroeconomic Indicators
Broad economic data releases can have an immediate and profound impact on market sentiment and, consequently, the S&P 500.
- Inflation and Interest Rates: The Federal Reserve’s monetary policy, particularly decisions regarding interest rates, is a dominant factor. Higher interest rates typically make borrowing more expensive for businesses and consumers, potentially slowing economic growth and reducing corporate profits, which can weigh on stock prices. Inflation data, such as the Consumer Price Index (CPI), directly influences the Fed’s decisions.
- Gross Domestic Product (GDP): GDP reports, which measure the total economic output of a country, provide a snapshot of economic growth. Strong GDP growth often signals a healthy economy, bolstering corporate earnings and investor confidence, while weak GDP can trigger sell-offs.
- Employment Figures: Data like the monthly jobs report (non-farm payrolls, unemployment rate) are closely watched. Robust job growth indicates a strong labor market and consumer spending, which are positive for corporate revenues.
- Consumer Confidence and Retail Sales: These indicators reflect consumer spending habits and sentiment, which are vital components of economic activity. Strong consumer spending is a significant driver of corporate profits.
Corporate Earnings and Guidance
While macroeconomic factors set the stage, the performance of the 500 individual companies within the index is paramount.
- Earnings Reports: During earnings season, companies release their quarterly financial results. Strong earnings per share (EPS) and revenue figures, especially when they beat analyst expectations, can send individual stocks higher, positively impacting the S&P 500. Conversely, misses can lead to declines.
- Forward Guidance: Beyond past performance, companies’ outlooks for future earnings and revenues (guidance) are often even more critical. A company with a strong earnings report but weak guidance can still see its stock fall, dragging down the index if it’s a heavily weighted constituent.
- Sector-Specific News: News affecting specific sectors, such as new regulations for tech companies or drug approvals for pharmaceutical firms, can cause significant movements within those sectors and, by extension, influence the broader S&P 500.
Geopolitical Events and Global Sentiment
The interconnectedness of the global economy means that events far beyond U.S. borders can send ripples through the S&P 500.
- Geopolitical Conflicts: Wars, trade disputes, and political instability in major regions can disrupt supply chains, impact commodity prices, and create uncertainty, leading investors to seek safer assets and often causing stock market declines.
- Global Economic Health: Economic slowdowns or crises in major trading partners (e.g., China, Europe) can reduce demand for U.S. goods and services, affecting multinational corporations in the S&P 500.
- Commodity Prices: Significant fluctuations in oil prices, for instance, can impact energy companies directly and manufacturing/transportation costs for others, influencing their profitability and stock valuations.
Technical Factors and Market Psychology
Beyond fundamental data, market mechanics and human emotion play a significant role in daily S&P 500 movements.
- Technical Analysis: Traders often use charts and technical indicators (e.g., moving averages, support and resistance levels) to identify trends and predict future price movements. A breach of a key technical level can trigger automated buying or selling.
- Investor Sentiment: Fear and greed are powerful forces. Positive news can create a “fear of missing out” (FOMO) rally, while negative news can trigger panic selling, regardless of underlying fundamentals. News headlines, analyst upgrades/downgrades, and social media trends can quickly shift sentiment.
- Flows of Capital: Large institutional investors, pension funds, and hedge funds constantly rebalance their portfolios. Significant inflows into or outflows from equity markets can have a substantial impact on the S&P 500’s daily performance.
Interpreting Today’s Movements and Their Implications for Your Portfolio
Understanding what drives the S&P 500 is one thing; translating that knowledge into actionable insights for your personal financial strategy is another. It’s crucial to adopt a measured perspective, differentiating between short-term noise and long-term trends.
Short-Term Volatility vs. Long-Term Trends
The S&P 500’s daily movements are often characterized by volatility. A 1% swing in either direction is not uncommon and can be triggered by a single piece of economic data, a corporate earnings surprise, or a geopolitical headline. For most long-term investors, these daily fluctuations are simply market noise. Panicking or making rash decisions based on one day’s performance is often counterproductive.
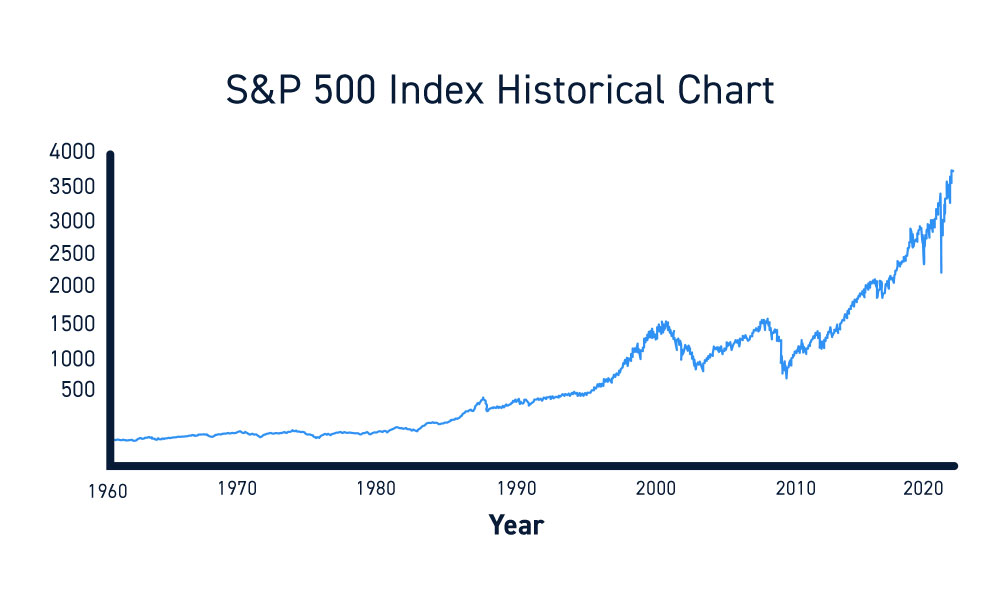
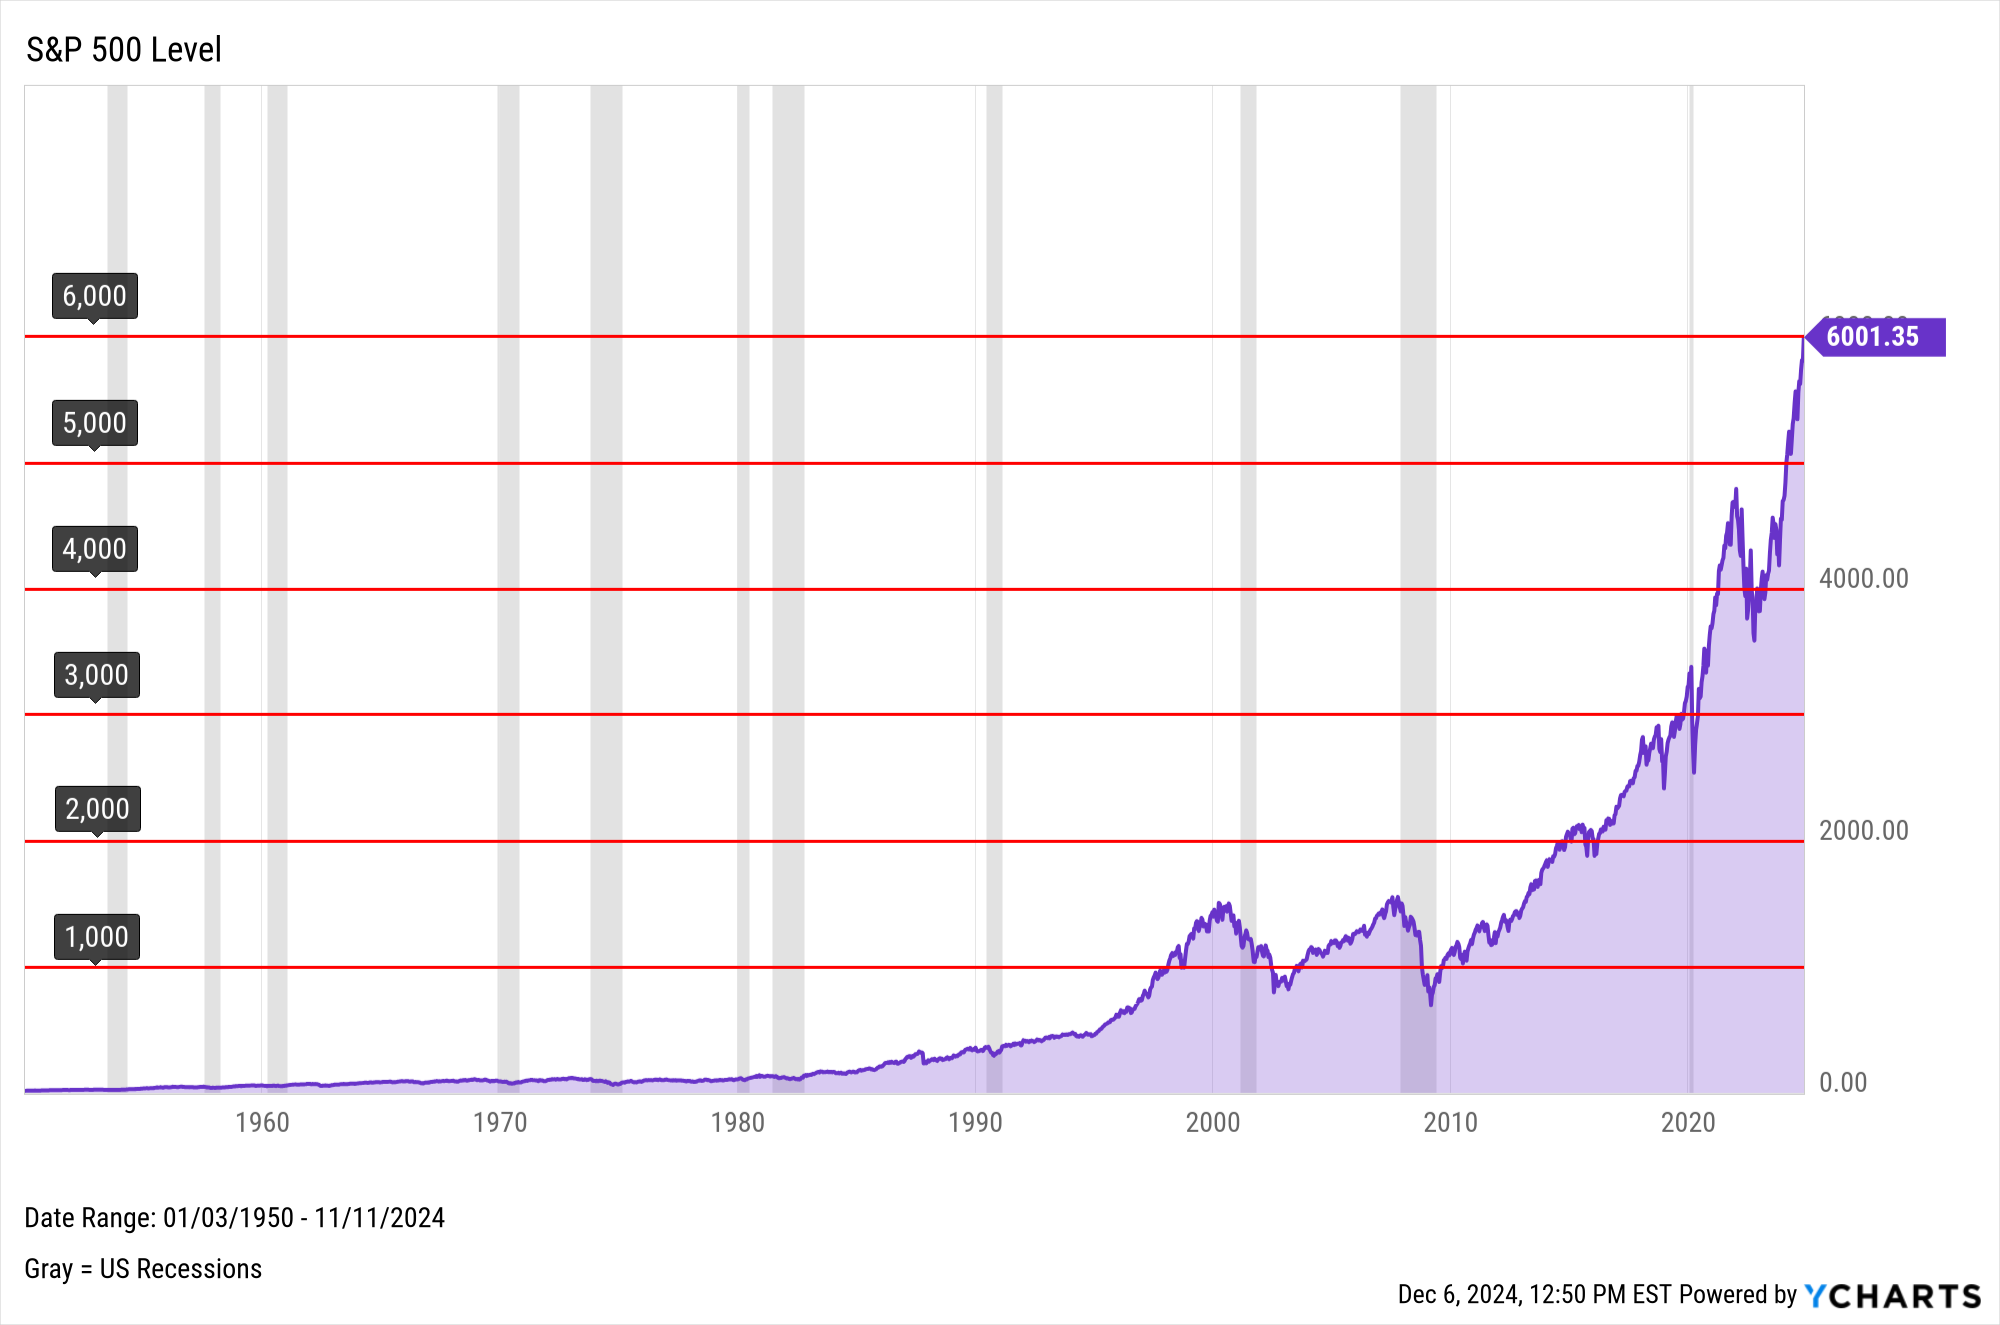
Historically, the S&P 500 has demonstrated a strong upward bias over the long run, despite numerous short-term corrections and bear markets. Looking at a 10-year, 20-year, or even 50-year chart reveals a consistent trend of growth, reflecting the enduring innovation and productivity of American businesses. Therefore, while “what’s the S&P 500 today” is a valid question, it should be viewed within the broader context of multi-year performance. A dip today might be an opportunity for a long-term investor to buy more shares at a lower price.
S&P 500 as an Investment Vehicle
For many, the S&P 500 isn’t just an economic indicator; it’s a direct investment.
- Index Funds and ETFs: The most common way to invest directly in the S&P 500 is through low-cost index funds or ETFs. These funds passively track the performance of the index by holding shares of all 500 companies in the same proportion as their market cap. Examples include SPDR S&P 500 ETF (SPY), iShares Core S&P 500 (IVV), and Vanguard S&P 500 ETF (VOO). These offer instant diversification across sectors and companies with minimal effort and expense.
- Direct Equity Exposure: While less common for direct S&P 500 tracking, investors can also buy individual stocks of companies within the index. This allows for greater customization and potential for alpha (outperforming the index), but also carries higher risk and requires more research.
- Futures and Options: For sophisticated traders, S&P 500 futures and options contracts allow for leveraged bets on the index’s future direction. These instruments are highly risky and generally not recommended for retail investors without extensive experience.
Strategic Considerations for Investors
For those whose portfolios are tied to the S&P 500, certain strategies can help navigate its daily gyrations:
- Diversification: While the S&P 500 itself is diversified, a truly robust portfolio might also include international stocks, bonds, real estate, and other asset classes to reduce overall risk, especially during periods when the U.S. market might underperform.
- Dollar-Cost Averaging (DCA): Investing a fixed amount of money at regular intervals (e.g., monthly) regardless of market conditions. This strategy automatically buys more shares when prices are low and fewer when prices are high, smoothing out the average purchase price over time and mitigating the risk of trying to “time the market.”
- Rebalancing: Periodically adjusting your portfolio back to its target asset allocation. If the S&P 500 has had a strong run, your equity allocation might become overweight. Rebalancing involves selling some appreciated S&P 500 exposure and reallocating to underperforming assets or those that are underweight, helping to manage risk and lock in gains.
- Long-Term Perspective: The most crucial strategy for S&P 500 investors is maintaining a long-term outlook. Market corrections and bear markets are inevitable parts of the investment cycle. Investors who stay disciplined and avoid making emotional decisions during downturns are typically rewarded over decades. Focus on your financial goals, not the daily headlines.
In conclusion, “what’s the S&P 500 today” is a question rich with meaning and implications. It serves as a vital indicator of market health, a guide for economic assessment, and a cornerstone for countless investment strategies. By understanding its composition, the forces that shape its daily movements, and how to interpret these signals with a long-term perspective, investors can move beyond mere curiosity and leverage this powerful index to inform their financial decisions and build lasting wealth.
aViewFromTheCave is a participant in the Amazon Services LLC Associates Program, an affiliate advertising program designed to provide a means for sites to earn advertising fees by advertising and linking to Amazon.com. Amazon, the Amazon logo, AmazonSupply, and the AmazonSupply logo are trademarks of Amazon.com, Inc. or its affiliates. As an Amazon Associate we earn affiliate commissions from qualifying purchases.