
Understanding the current standing of the Nasdaq index is a daily ritual for millions of investors, financial analysts, and market watchers around the globe. More than just a simple number, the Nasdaq represents a dynamic snapshot of the technology sector’s pulse, a barometer for innovation, and a critical component in the broader financial landscape. While its precise value fluctuates second by second during trading hours, grasping what that number signifies and why it moves is fundamental for anyone engaging with the financial markets.
Understanding the Nasdaq: More Than Just a Number
When people ask, “What is the Nasdaq at today?”, they are typically referring to the Nasdaq Composite Index. This index comprises over 3,000 common equities listed on the Nasdaq stock market, making it one of the most comprehensive indices globally. Unlike the Dow Jones Industrial Average, which is price-weighted and composed of only 30 large companies, or the S&P 500, which focuses on 500 large-cap U.S. companies, the Nasdaq Composite is market-capitalization-weighted and heavily skewed towards technology and growth-oriented companies. This unique composition makes it a particularly sensitive indicator for the performance of the tech sector, biotechnology, telecommunications, and other innovative industries.

The Nasdaq Composite vs. Nasdaq 100
It’s crucial to distinguish between the Nasdaq Composite and the Nasdaq 100. While both track companies listed on the Nasdaq exchange, they serve different purposes. The Nasdaq Composite provides a broad overview of all common stocks traded on the exchange. In contrast, the Nasdaq 100 is a more selective index, representing the 100 largest non-financial companies listed on the Nasdaq. This subset includes many of the world’s most influential technology giants, such as Apple, Microsoft, Amazon, Google (Alphabet), and Meta (Facebook). As a result, movements in the Nasdaq 100 often have a more pronounced impact on broader market sentiment, particularly regarding the performance of dominant tech players. When market commentators discuss the “Nasdaq’s performance,” they are often referring to the Nasdaq 100 due to its concentration of highly liquid, widely followed companies.
A Hub for Innovation
The Nasdaq exchange itself was founded in 1971 as the world’s first electronic stock market. Its origins laid the groundwork for modern trading, emphasizing speed, transparency, and efficiency. Over the decades, it has become synonymous with growth companies, pioneering startups, and disruptive technologies. Companies choose to list on the Nasdaq not just for capital but also for the prestige associated with being part of an exchange that champions innovation. This environment cultivates a unique ecosystem where emerging technologies and rapidly expanding businesses find a home, making the Nasdaq indices highly responsive to technological advancements, consumer trends, and shifts in digital landscapes. Consequently, tracking its daily movements offers direct insights into the health and future prospects of the global innovation economy.
Key Factors Influencing Nasdaq’s Daily Performance
The daily fluctuations of the Nasdaq are the result of a complex interplay of micro and macroeconomic factors, investor sentiment, and global events. Understanding these drivers is essential for making informed investment decisions and interpreting market signals.
Earnings Reports and Company News
Individual company performance, particularly among the largest constituents, exerts significant influence on the Nasdaq’s daily movements. Quarterly earnings reports, which detail a company’s financial health, revenue, and profit, can cause substantial swings. If a major tech company like Apple or Microsoft reports stronger-than-expected earnings, it can lift the entire index, signaling robust demand and profitability within the sector. Conversely, disappointing results, revised guidance, or negative news (e.g., regulatory challenges, product recalls, data breaches) from a single influential company can drag the index down. Analyst ratings, mergers and acquisitions, and new product announcements also play a crucial role, often leading to immediate price adjustments.
Macroeconomic Indicators
Broader economic data points provide the backdrop against which company performance is judged. Key macroeconomic indicators that significantly influence the Nasdaq include:
- Gross Domestic Product (GDP): Strong GDP growth suggests a healthy economy, which typically translates to higher corporate earnings and investor confidence.
- Inflation Data (CPI, PPI): Rising inflation can erode purchasing power and corporate profit margins. It also often prompts central banks to raise interest rates, which can be particularly detrimental to growth stocks.
- Employment Figures: Low unemployment rates and strong job growth indicate a robust economy with consumer spending potential, generally positive for equities.
- Consumer Confidence: High consumer confidence often leads to increased spending, benefiting companies across various sectors, especially those reliant on discretionary spending.
- Manufacturing and Service PMIs: These indices offer insights into the health of various economic sectors, indicating expansion or contraction.
These indicators are closely watched, and any deviation from expectations can trigger rapid market reactions, as they inform future economic outlooks and monetary policy decisions.
Interest Rates and Monetary Policy
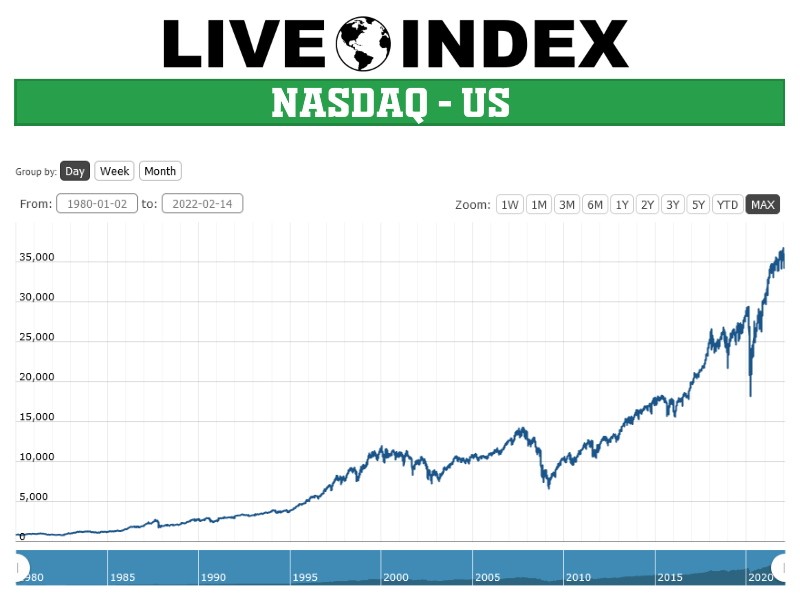
The Federal Reserve’s monetary policy, particularly its stance on interest rates, is a powerful determinant of the Nasdaq’s direction. Technology and growth stocks, which constitute a large portion of the Nasdaq, are highly sensitive to interest rate changes. This is because their valuations often rely on projections of future earnings. When interest rates rise, the “discount rate” used to calculate the present value of those future earnings increases, making future profits less valuable in today’s terms. Higher rates also increase the cost of borrowing for companies, impacting investment and expansion plans, and make bonds a more attractive, lower-risk alternative to stocks. Conversely, a dovish Fed stance and lower interest rates tend to fuel equity valuations, especially for growth stocks, as capital becomes cheaper and alternative investments offer lower returns.
Investor Sentiment and Global Events
Psychology plays a significant role in market movements. Investor sentiment, driven by fear or greed, can amplify market reactions to news and data. A surge in optimism can lead to irrational exuberance, while widespread pessimism can trigger sell-offs. Global geopolitical events—such as trade wars, political instability, conflicts, or pandemics—can introduce significant uncertainty, causing investors to retreat from riskier assets like growth stocks and seek safety. Unexpected global economic downturns or crises in major economies can also have a ripple effect, impacting supply chains, consumer demand, and overall market stability, leading to declines in indices like the Nasdaq.
Why Tracking the Nasdaq Matters for Investors
For investors, staying abreast of the Nasdaq’s daily performance is not merely an academic exercise; it’s a vital part of managing their portfolios, understanding market dynamics, and identifying potential opportunities or risks.
Gauging Market Health and Tech Sector Trends
The Nasdaq serves as a primary barometer for the health and vitality of the technology sector, which often acts as a leading indicator for broader economic trends. A robust Nasdaq suggests strong innovation, corporate growth, and investor confidence in future technological advancements. Conversely, a significant decline can signal headwinds for tech companies, perhaps due to overvaluation, regulatory concerns, or a shift in market preferences. By tracking its movements, investors can discern whether the market is favoring growth stocks, value stocks, or other sectors, helping them to align their portfolios with prevailing trends.
Informing Investment Decisions
While daily fluctuations should not dictate every investment move, understanding the Nasdaq’s trajectory can inform strategic decisions. For those invested in tech stocks, ETFs, or mutual funds with a heavy tech weighting, tracking the index provides direct insight into the performance of their holdings. It helps investors assess whether individual stock movements are company-specific or part of a broader sectoral trend. For instance, if the Nasdaq is broadly down, but a specific tech stock is up, it might indicate strong company-specific news that defies the general market sentiment. Conversely, if the Nasdaq is soaring, but a tech stock is stagnant, it might warrant a deeper look into the company’s fundamentals.
Long-Term Perspective vs. Daily Fluctuations
It’s crucial to balance the daily “what’s the Nasdaq at today?” question with a long-term investment perspective. While daily numbers are engaging and provide real-time feedback, successful investing often involves looking beyond day-to-day volatility. Long-term investors focus on fundamental company strength, industry growth, and macroeconomic trends that play out over months and years, rather than hours. Daily movements can be influenced by transient news or algorithmic trading. However, consistent tracking over time helps investors identify sustained trends, understand market cycles, and adjust their strategies thoughtfully, rather than reacting impulsively to every dip or surge. The daily number serves as a checkpoint within a much larger journey.
How to Monitor the Nasdaq’s Current Value
In today’s interconnected financial world, accessing real-time Nasdaq data is easier than ever. Numerous platforms and tools are available to help investors stay informed.
Reliable Financial Platforms
Most major financial news websites and brokerage platforms provide real-time or near real-time data for the Nasdaq Composite and Nasdaq 100. Reputable sources include Bloomberg, Reuters, Yahoo Finance, Google Finance, CNBC, The Wall Street Journal, and your personal brokerage account dashboard. These platforms typically display the index’s current price, its change in points and percentage for the day, its opening and closing prices, daily high and low, and often interactive charts that show historical performance. Many also offer pre-market and after-hours trading data, providing an even broader view of market sentiment outside of standard trading hours.
Interpreting Real-Time Data
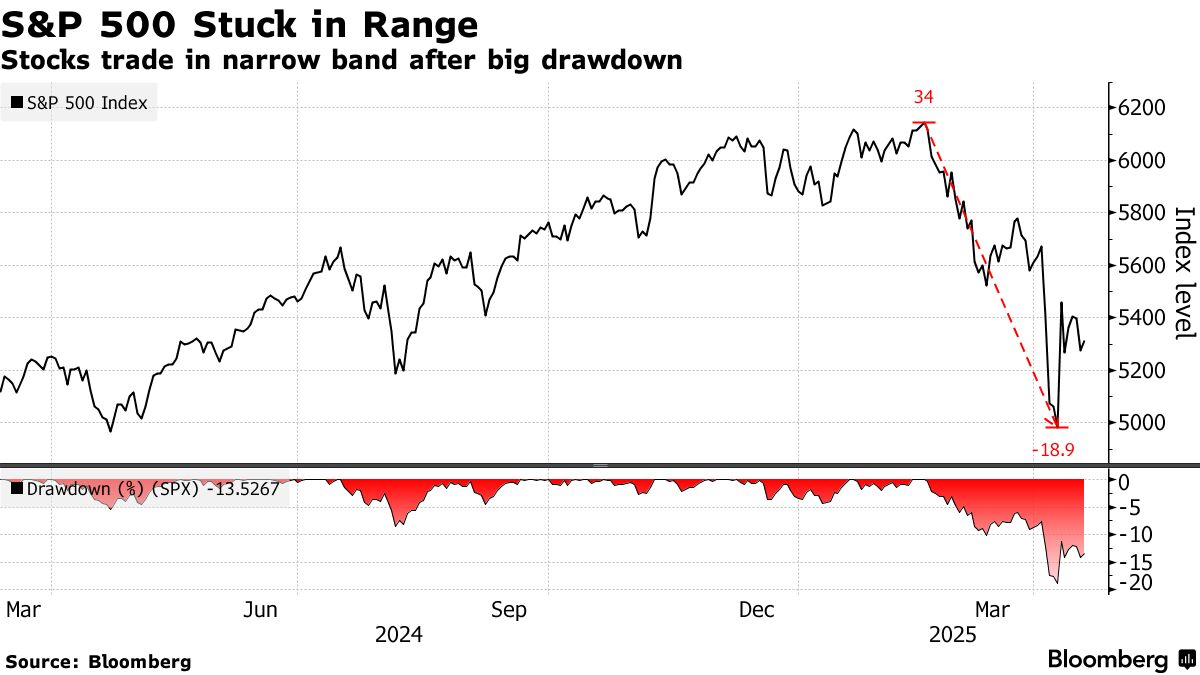
When observing the Nasdaq’s current value, it’s important to look beyond just the raw number. Pay attention to the percentage change for the day, as this gives a more accurate sense of the magnitude of the movement. A 100-point move on a 15,000-point index is less significant than a 100-point move on a 1,000-point index. Also, consider the volume of trading—high volume accompanying a significant price move can indicate a stronger conviction behind that movement. Look at analyst commentary and news headlines that often accompany price movements to understand the underlying causes. Finally, always cross-reference data from multiple sources to ensure accuracy, and remember that real-time data can have slight delays depending on the platform and data feed.
The question “What is the Nasdaq at today?” is more than just a query about a stock market index; it’s a gateway into understanding the intricate dynamics of the global economy, the relentless march of technological innovation, and the ever-shifting tides of investor sentiment. By diligently tracking its movements and understanding the forces behind them, investors can cultivate a more informed and strategic approach to their financial journey.
aViewFromTheCave is a participant in the Amazon Services LLC Associates Program, an affiliate advertising program designed to provide a means for sites to earn advertising fees by advertising and linking to Amazon.com. Amazon, the Amazon logo, AmazonSupply, and the AmazonSupply logo are trademarks of Amazon.com, Inc. or its affiliates. As an Amazon Associate we earn affiliate commissions from qualifying purchases.