
In the dynamic world of finance, where values constantly fluctuate, understanding the magnitude and direction of change is paramount. Whether you’re a seasoned investor tracking portfolio performance, a small business owner analyzing quarterly profits, or an individual managing a personal budget, the ability to accurately measure percentage change is an indispensable skill. It transforms raw numbers into actionable insights, revealing growth trends, identifying areas of concern, and enabling informed decision-making. This guide will demystify the concept, provide a clear, step-by-step methodology, and illustrate its critical applications across personal finance, investing, and business finance.
The Fundamental Role of Percentage Change in Finance
At its core, percentage change quantifies the relative difference between two values, expressed as a percentage of the initial value. While a simple numerical difference can tell you how much a value has changed, percentage change tells you how significant that change is in relation to its starting point. This distinction is crucial in finance, where context is everything.
Understanding Growth, Decline, and Volatility
Imagine a stock price moving from $10 to $12. A $2 increase. Now imagine another stock moving from $100 to $102. Also a $2 increase. While the absolute change is identical, their significance is vastly different. The first stock experienced a 20% increase, while the second saw only a 2% rise. Percentage change highlights this disparity, allowing for meaningful comparisons across different scales and asset classes. It helps financial professionals and individuals alike to:
- Assess Growth: Quickly identify which investments, revenue streams, or personal savings accounts are growing most rapidly.
- Pinpoint Decline: Understand the severity of losses in investments, market downturns, or budget overruns.
- Gauge Volatility: In investment markets, percentage change is key to understanding how much an asset’s price typically swings, which is a critical factor in risk assessment.
Why Simple Differences Aren’t Enough
Relying solely on absolute differences can be misleading. A $1,000 increase in a $10,000 investment portfolio is a substantial 10% gain. The same $1,000 increase in a $1,000,000 corporate balance sheet is a mere 0.1% increase, barely a ripple. Percentage change standardizes these comparisons, allowing you to evaluate performance on a level playing field, regardless of the initial scale. This is vital when comparing investment returns, analyzing economic indicators like inflation, or comparing the growth rates of companies of different sizes. It provides a relative measure that is far more insightful than an absolute figure alone.
The Core Formula and Its Components
Calculating percentage change is straightforward once you understand its fundamental formula. It requires two key pieces of information: an initial value and a final value.
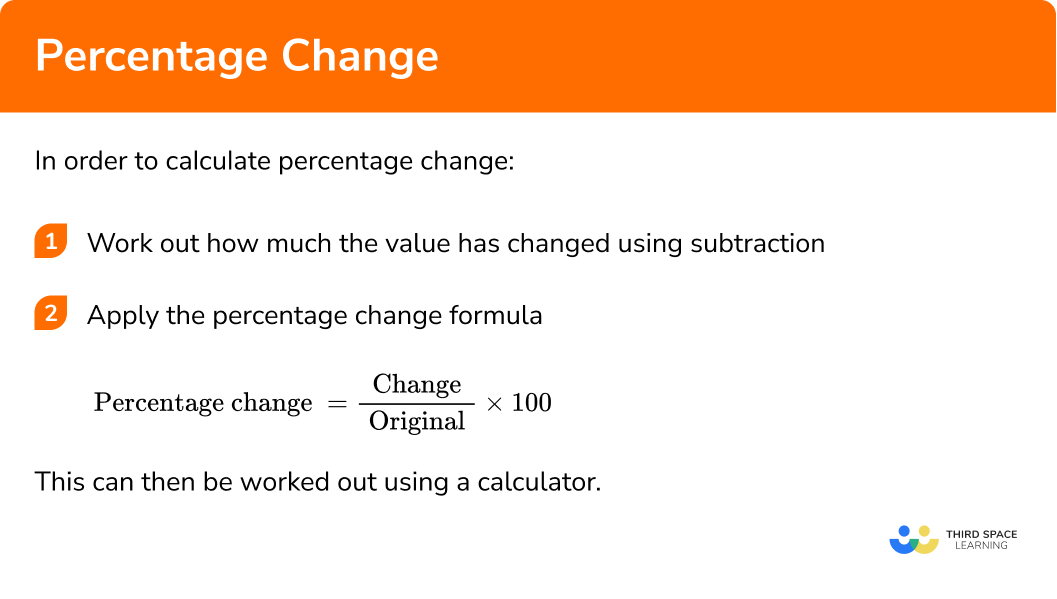
The basic formula for percentage change is:
Percentage Change = ((Final Value – Initial Value) / Initial Value) * 100
Let’s break down each component:
Initial Value vs. Final Value: Setting the Stage
- Initial Value (Old Value): This is the starting point, the baseline against which you are measuring the change. For instance, if you’re tracking your investment portfolio’s growth over a year, the initial value would be its worth at the beginning of the year. If you’re analyzing a company’s revenue growth, it’s the revenue from the previous period.
- Final Value (New Value): This is the ending point, the value after the change has occurred. Following the previous examples, this would be your portfolio’s worth at the end of the year, or the company’s revenue in the current period.
Accurately identifying these two values is the first crucial step to ensure your calculation yields meaningful results.
Step-by-Step Calculation: From Difference to Percentage
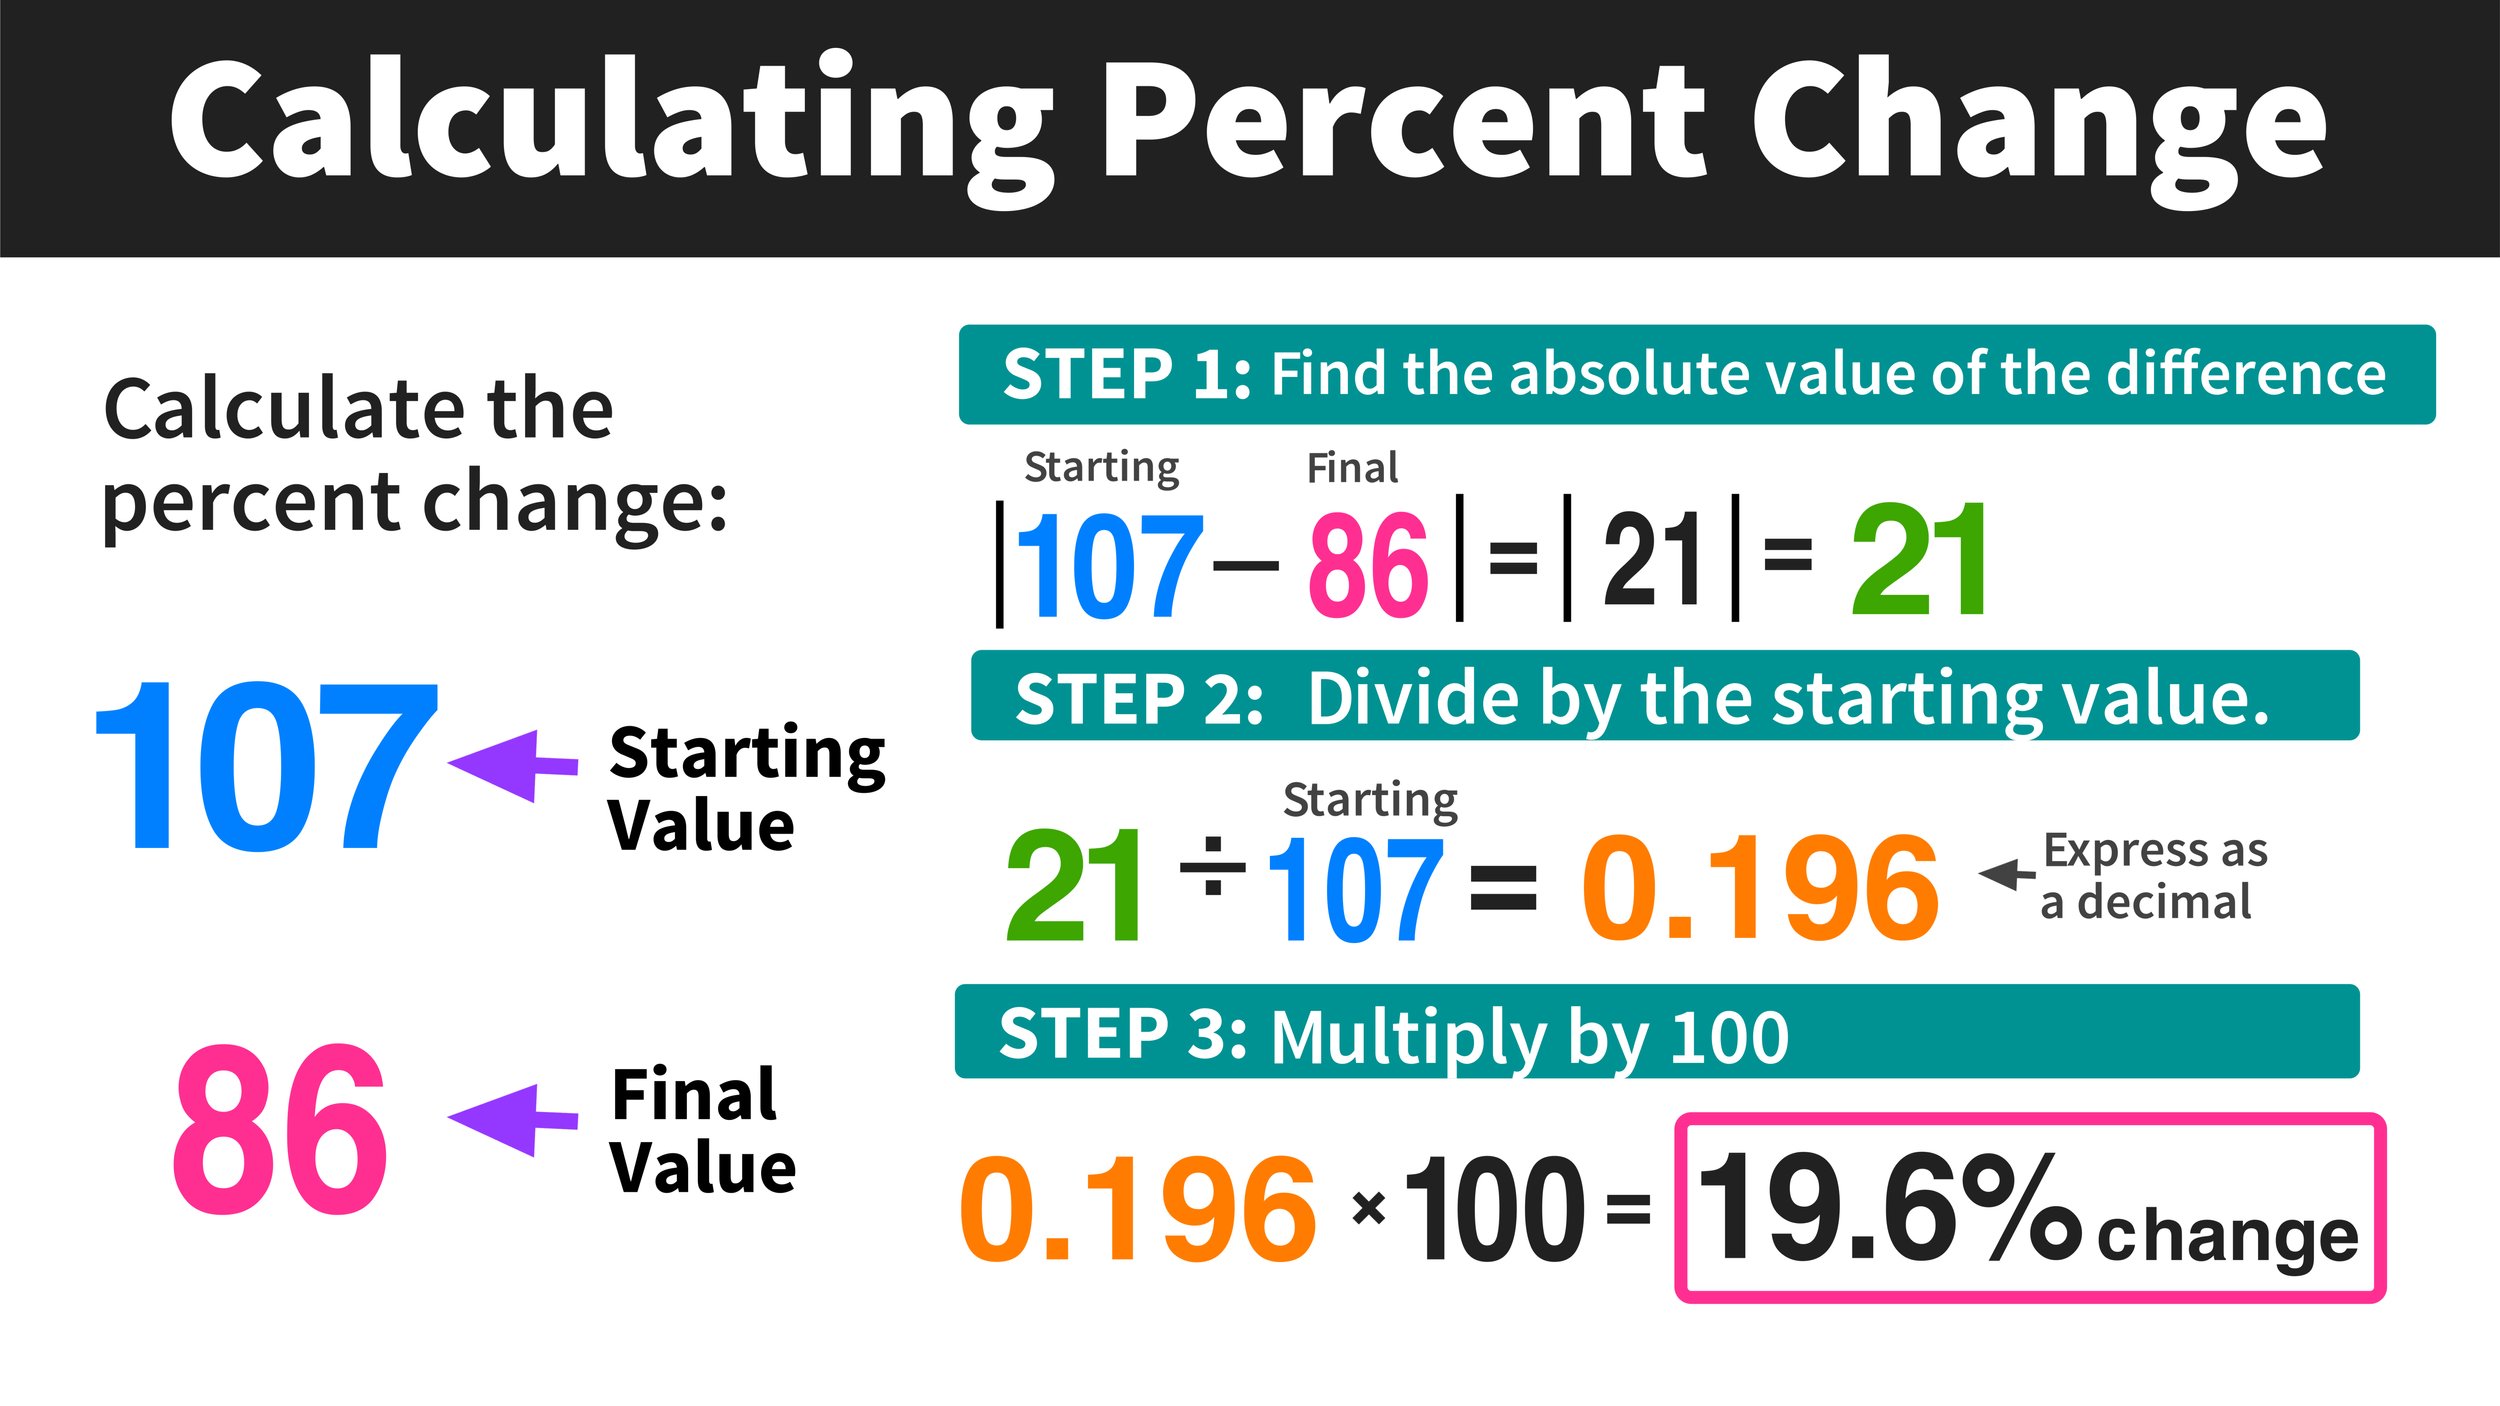
Let’s walk through an example: Suppose your investment portfolio was valued at $50,000 at the start of the year (Initial Value) and grew to $57,500 by the end of the year (Final Value).
-
Find the Difference: Subtract the Initial Value from the Final Value.
$57,500 (Final Value) – $50,000 (Initial Value) = $7,500 (Change)
This $7,500 represents the absolute increase in your portfolio’s value. -
Divide by the Initial Value: Divide the change by the Initial Value.
$7,500 / $50,000 = 0.15
This decimal represents the proportional change. -
Multiply by 100: Convert the decimal to a percentage by multiplying by 100.
0.15 * 100 = 15%
Thus, your investment portfolio experienced a 15% increase over the year.
Handling Negative Changes and Increases
The beauty of this formula is its versatility in handling both increases and decreases.
- For an Increase: If the Final Value is greater than the Initial Value, the result will be a positive percentage, indicating growth. (As in our portfolio example, a +15%).
- For a Decrease: If the Final Value is less than the Initial Value, the numerator (Final Value – Initial Value) will be negative, resulting in a negative percentage. This clearly indicates a decline. For example, if a stock dropped from $100 to $80:
$((80 – 100) / 100) * 100 = (-20 / 100) * 100 = -0.20 * 100 = -20%
This tells you the stock experienced a 20% decrease.
The negative sign is essential; it differentiates a loss from a gain, providing complete clarity on the direction of the change.
Practical Applications in Personal Finance
For individuals, mastering percentage change is not just an academic exercise; it’s a practical skill that empowers better financial management, clearer goal setting, and improved financial literacy.
Tracking Investment Returns and Portfolio Performance
One of the most common and vital applications of percentage change in personal finance is assessing investment performance. Whether you hold stocks, bonds, mutual funds, or real estate, understanding the percentage return allows you to:
- Compare Investments: A 5% return on one investment versus a 3% on another immediately shows which is performing better relatively, regardless of the initial capital invested.
- Evaluate Portfolio Growth: Regularly calculating the percentage change in your overall portfolio value helps you track progress toward long-term financial goals, like retirement or a down payment on a home.
- Calculate Compound Interest Effect: Understanding annual percentage growth allows you to visualize the power of compounding over time. For example, knowing your savings account yields 1.5% annually helps you project future balances.
Analyzing Budget Fluctuations and Spending Habits
Personal budgeting benefits immensely from percentage change analysis. It allows you to move beyond simply seeing how much you spent and instead understand the proportional impact of changes in your spending.
- Identify Spending Creep: If your grocery bill jumped from $400 to $480 in a month, that’s a 20% increase. This percentage highlights a significant shift that might warrant investigation, rather than just noting an $80 difference.
- Track Income Changes: A 5% raise might sound small in dollar terms, but understanding its percentage impact on your overall income provides a clearer picture of your financial advancement.
- Categorize Expenses: By calculating the percentage change in spending categories (e.g., entertainment, utilities, housing) month-over-month or year-over-year, you can identify trends, control overspending, and reallocate funds more effectively.
Understanding Salary Increases and Inflation’s Impact
Percentage change helps put financial changes into perspective against broader economic realities.
- Evaluate Real Salary Growth: A 3% salary increase sounds positive. However, if inflation (the general increase in prices) for that same period was 4%, your “real” purchasing power actually decreased by 1%. Percentage change helps you see the net effect after accounting for inflation.
- Cost of Living Adjustments (COLAs): COLAs are typically expressed as a percentage, reflecting how much wages need to increase to keep pace with inflation. Understanding how to calculate and interpret these percentages is key to advocating for fair compensation and maintaining your living standard.
- Retirement Planning: When projecting future retirement income needs, financial planners use expected inflation rates (percentage increases) to estimate how much money will be required to maintain a certain lifestyle decades from now.
Business Finance and Investment Analysis
In the realm of business and professional investment, percentage change transitions from a useful tool to an absolute necessity. It forms the backbone of financial reporting, performance analysis, and strategic decision-making.
Evaluating Revenue Growth and Profit Margins
For businesses, measuring percentage change is fundamental to understanding operational health and market position.
- Revenue Growth: Comparing current quarter’s revenue to the previous quarter or year allows businesses to calculate percentage growth, a key indicator of market penetration and sales effectiveness. A 15% year-over-year revenue growth is a strong positive signal to investors and stakeholders.
- Profit Margins: Gross profit margin, operating profit margin, and net profit margin are all expressed as percentages. Tracking the percentage change in these margins over time reveals efficiency improvements or cost control issues. A declining percentage margin, even with increasing revenue, signals potential problems.
- Cost Analysis: Percentage change helps businesses analyze increases or decreases in various cost centers (e.g., raw materials, labor, marketing spend). A sudden 10% jump in manufacturing costs, for example, would trigger an immediate review.
Assessing Stock Performance and Market Volatility
Investors and analysts rely heavily on percentage change to navigate the complexities of the stock market.
- Stock Price Fluctuations: Daily, weekly, or annual percentage changes in stock prices are the primary metric for tracking individual stock performance. A stock that gains 25% in a year is easily identifiable as a strong performer.
- Index Performance: Market indices like the S&P 500 or NASDAQ are measured by their percentage change. A “down day” for the market means these indices have seen a negative percentage change.
- Portfolio Benchmarking: Investors often compare the percentage return of their portfolio against a relevant benchmark index. If your portfolio grew 10% but the S&P 500 grew 15% in the same period, your portfolio underperformed the market by 5 percentage points.
- Dividend Yields: Expressed as a percentage, dividend yield is the annual dividend payment per share divided by the share price, indicating the return on investment from dividends alone.
Comparing Financial Ratios Across Periods
Financial ratios, such as debt-to-equity, current ratio, or return on assets, provide insights into a company’s financial health. Tracking the percentage change of these ratios over multiple reporting periods (e.g., quarterly, annually) reveals trends and shifts in a company’s financial structure and efficiency. A decreasing debt-to-equity ratio, for instance, might show a company is becoming less reliant on borrowing, which could be a positive percentage trend for investors. Conversely, a significant percentage increase in a leverage ratio could signal increased risk.
Common Pitfalls and Best Practices
While simple in concept, misinterpreting or miscalculating percentage change can lead to erroneous conclusions. Adhering to best practices is crucial for accurate financial analysis.
The Importance of Consistent Timeframes
When comparing percentage changes, ensure you are using consistent timeframes. Comparing a quarter-over-quarter growth with a year-over-year growth is like comparing apples and oranges.
- Example: A 2% monthly increase in revenue might seem small, but annualized, it could represent a significant 26.8% yearly increase (compounding monthly). Conversely, a 20% growth over five years is far less impressive than 20% in a single year.
- Best Practice: Always specify the period over which the change is measured (e.g., “Q3 2023 saw a 5% revenue increase over Q2 2023,” or “ABC Company reported a 12% year-over-year profit growth”).
Avoiding Misinterpretation: Context is Key
A percentage change, by itself, doesn’t always tell the whole story. Context is vital.
- Small Bases: A 100% increase sounds phenomenal, but if a company’s revenue went from $1,000 to $2,000, it’s still a small operation. Conversely, a 5% increase on a $1 billion revenue base is a much larger absolute gain.
- Outliers and One-Time Events: Be mindful of changes influenced by non-recurring events. A sudden spike in earnings due to an asset sale might show a large percentage increase, but it doesn’t reflect sustainable operational growth.
- Best Practice: Always look at the absolute values alongside the percentage change. Investigate the underlying reasons for significant shifts and consider the baseline from which the change occurred.

Utilizing Financial Tools for Accuracy
While manual calculation is good for understanding the concept, for complex financial analysis involving numerous data points, leveraging financial tools is highly recommended.
- Spreadsheets (Excel, Google Sheets): These are invaluable for automating percentage change calculations, especially for large datasets. Functions like
= (B2-A2)/A2can be copied across hundreds of cells, reducing errors. - Financial Calculators and Software: Many online financial calculators and dedicated financial software (e.g., QuickBooks, specific investment platforms) have built-in functions to automatically calculate percentage changes for various metrics, from investment returns to budget variances.
- Best Practice: Double-check your formulas and data entry. A single misplaced value can propagate errors throughout your analysis. Utilize validation features in spreadsheets to ensure data integrity.
In conclusion, measuring percentage change is more than just a mathematical exercise; it’s a fundamental financial literacy skill. From managing personal wealth to steering corporate strategy, its consistent and accurate application provides clarity, enables meaningful comparisons, and ultimately empowers smarter financial decisions in an ever-evolving economic landscape. By mastering this concept, you gain a powerful lens through which to view and interact with the world of money.
aViewFromTheCave is a participant in the Amazon Services LLC Associates Program, an affiliate advertising program designed to provide a means for sites to earn advertising fees by advertising and linking to Amazon.com. Amazon, the Amazon logo, AmazonSupply, and the AmazonSupply logo are trademarks of Amazon.com, Inc. or its affiliates. As an Amazon Associate we earn affiliate commissions from qualifying purchases.