In the complex landscape of personal finance, investing, and business management, understanding how numbers change is paramount. One of the most fundamental yet powerful metrics at your disposal is the percentage of decrease. It’s not just a mathematical concept; it’s a lens through which we can evaluate performance, identify trends, measure efficiency, and make informed financial decisions. Whether you’re tracking a drop in your monthly expenses, analyzing a stock’s decline, or assessing a business’s revenue contraction, mastering the calculation and interpretation of percentage decrease is indispensable. This guide will walk you through the process, providing insights and practical applications strictly within the realm of money and finance.

Understanding the Fundamentals of Percentage Decrease in Finance
At its core, the percentage of decrease quantifies the proportional reduction between an original value and a new, smaller value. In finance, this reduction can represent a loss, an improvement in efficiency, a price adjustment, or a decline in performance. Without this metric, we’d only see absolute differences, which often lack the necessary context to truly understand the significance of a change.
What is Percentage Decrease?
Percentage decrease is a ratio that expresses the magnitude of a decline as a proportion of the original amount, multiplied by 100 to convert it into a percentage. For instance, if your investment portfolio was worth $10,000 last year and is now worth $8,000, the absolute decrease is $2,000. However, stating it as a 20% decrease ($2,000 / $10,000 * 100) provides a much clearer picture of the proportional impact, allowing for easier comparison across different financial scenarios, regardless of their absolute scales.
This concept is crucial across various financial applications:
- Personal Finance: Tracking reductions in utility bills, grocery spending, or debt balances.
- Investing: Analyzing the depreciation of an asset, a stock’s price correction, or a bond’s yield decrease.
- Business Finance: Monitoring declines in sales revenue, profit margins, operational costs, or market share.
The ability to accurately calculate and interpret this figure empowers individuals and organizations to react swiftly to unfavorable trends or celebrate successful cost-cutting initiatives.
Why This Metric Matters for Your Money
The significance of percentage decrease extends far beyond mere arithmetic; it’s a vital tool for financial literacy and strategic planning.
- For Personal Budgeting: It allows you to set tangible goals for expense reduction (e.g., “I want to decrease my restaurant spending by 15% this quarter”). It provides a clear metric to gauge whether your efforts to save money or cut costs are effective.
- For Investment Analysis: When an asset’s value drops, knowing the percentage decrease helps investors understand the severity of the decline relative to its original value. This context is critical for deciding whether to hold, buy more, or sell, especially during market downturns. It’s also crucial for calculating capital losses for tax purposes.
- For Business Performance Evaluation: Businesses rely on this metric to identify areas of concern (e.g., a 10% decrease in quarterly revenue might trigger a strategic review) or celebrate successes (e.g., a 5% decrease in Cost of Goods Sold due to supply chain optimization). It aids in forecasting, budgeting, and making operational adjustments to improve profitability.
- For Debt Management: Tracking the percentage decrease in your outstanding loan balances provides motivation and a clear indicator of progress towards becoming debt-free.
In essence, percentage decrease transforms raw data into actionable insights, providing the context needed to make prudent financial decisions.
The Essential Formula and Step-by-Step Calculation
The formula for calculating percentage decrease is straightforward, yet its correct application is critical. Understanding each component ensures accuracy in your financial analysis.
Deconstructing the Percentage Decrease Formula
The formula is expressed as:
Percentage Decrease = ((Original Value - New Value) / Original Value) * 100
Let’s break down each part:
- Original Value: This is the starting point, the baseline against which you are measuring the change. In finance, this could be last year’s revenue, your initial investment amount, or last month’s utility bill.
- New Value: This is the ending point, the amount after the decrease has occurred. It could be this year’s revenue, your current investment value, or this month’s utility bill.
- Original Value – New Value: This first step calculates the absolute amount of the decrease. It shows you exactly how much the value has dropped in monetary terms.
- Divide by Original Value: This step converts the absolute decrease into a decimal ratio, indicating the proportion of the decrease relative to the starting point.
- Multiply by 100: This final step converts the decimal ratio into a percentage, making it easier to understand and compare.
A Practical Guide to Calculating Financial Decreases
Let’s apply this formula with practical financial examples to solidify your understanding.
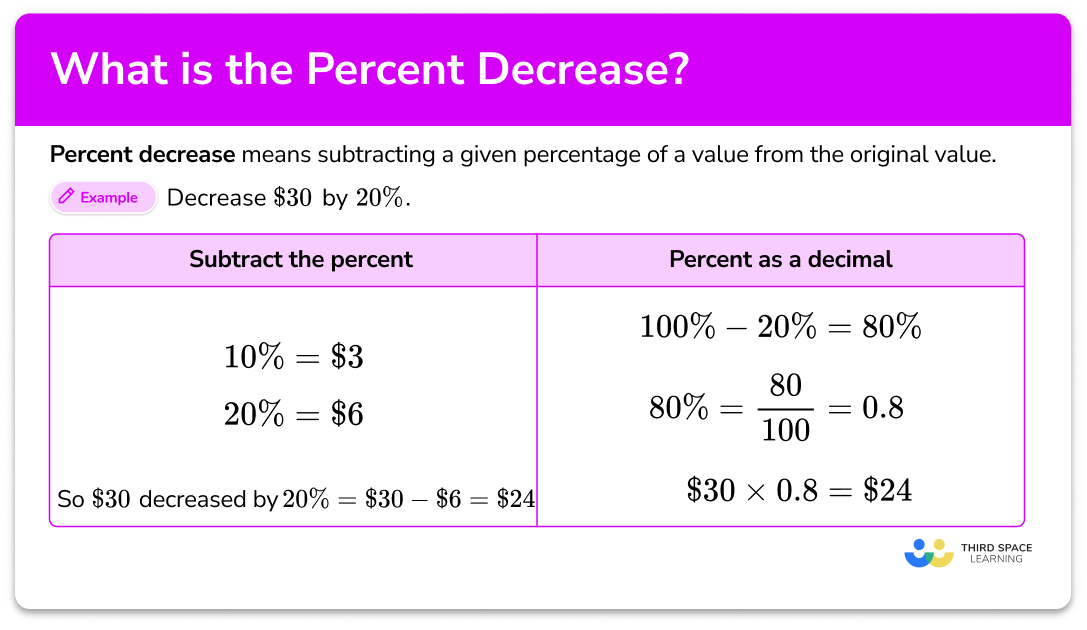
Example 1: Decrease in Monthly Expenses (Personal Finance)
Imagine your electricity bill for last month was $150 (Original Value), but due to energy-saving efforts, this month’s bill is $120 (New Value).
- Identify Original Financial Value: $150
- Determine the New Financial Value: $120
- Calculate the Absolute Decrease: $150 – $120 = $30
- Divide by the Original Value: $30 / $150 = 0.2
- Convert to a Percentage: 0.2 * 100 = 20%
You successfully decreased your electricity bill by 20%.
Example 2: Stock Price Decline (Investing)
Suppose you bought shares of a company at $50 per share (Original Value), and now the price has dropped to $42.50 per share (New Value).
- Identify Original Financial Value: $50
- Determine the New Financial Value: $42.50
- Calculate the Absolute Decrease: $50 – $42.50 = $7.50
- Divide by the Original Value: $7.50 / $50 = 0.15
- Convert to a Percentage: 0.15 * 100 = 15%
Your stock has experienced a 15% decrease in value.
Example 3: Quarterly Revenue Drop (Business Finance)
A small business generated $200,000 in revenue last quarter (Original Value), but due to market changes, this quarter’s revenue is $180,000 (New Value).
- Identify Original Financial Value: $200,000
- Determine the New Financial Value: $180,000
- Calculate the Absolute Decrease: $200,000 – $180,000 = $20,000
- Divide by the Original Value: $20,000 / $200,000 = 0.1
- Convert to a Percentage: 0.1 * 100 = 10%
The business experienced a 10% decrease in quarterly revenue.
These examples illustrate how the same formula provides invaluable insights across diverse financial contexts.

Real-World Applications Across Personal and Business Finance
The versatility of percentage decrease makes it a fundamental metric for anyone managing money, from individuals to large corporations. Its application helps in assessing current states, projecting future scenarios, and making corrective actions.
Optimizing Personal Finances: Budgeting and Expense Reduction
For personal finance, percentage decrease is your ally in the quest for financial freedom and efficiency.
- Tracking Debt Reduction: If you start with a $10,000 credit card debt and manage to pay it down to $7,500, you’ve achieved a 25% decrease in your debt load. This tangible progress can be a huge motivator.
- Monitoring Living Expenses: By comparing utility bills, grocery receipts, or entertainment spending month-over-month or year-over-year, you can identify areas where you’ve successfully cut back or where more effort is needed. A 10% decrease in your food budget might free up funds for savings or investments.
- Assessing Lifestyle Changes: If you downsized your car from one costing $500/month in payments and insurance to one costing $350/month, you’ve achieved a 30% decrease in transportation costs, directly impacting your disposable income.
Savvy Investing: Analyzing Portfolio and Stock Declines
In the volatile world of investing, understanding percentage decrease is critical for risk management and performance evaluation.
- Understanding Market Corrections: When a stock market “corrects,” it often means a 10% or more decrease from a recent peak. Knowing this percentage helps investors put the downturn into perspective and decide if it’s a temporary dip or a more serious issue.
- Evaluating Individual Stock Performance: If a stock you own drops from $100 to $80, it’s a 20% decrease. This figure, combined with market analysis, helps you assess the health of the company or the sector it operates in.
- Portfolio Drawdown: Investors often measure the largest percentage drop from a peak to a trough in their portfolio value, known as a “drawdown.” Understanding this percentage is key to assessing risk tolerance and historical performance.
Business Acumen: Monitoring Revenue, Costs, and Profitability
For businesses, percentage decrease is an essential tool for diagnostics, strategic planning, and operational improvements.
- Sales and Revenue Performance: A decrease in quarterly sales by 5% compared to the previous quarter or the same quarter last year signals a need for marketing adjustments, product innovation, or sales force training.
- Cost Control and Efficiency: If the Cost of Goods Sold (COGS) decreases by 8% due to more efficient manufacturing processes or better supplier negotiations, it directly boosts profit margins. This percentage helps quantify the impact of operational changes.
- Employee Churn: A decrease in the percentage of employee turnover can indicate improved workplace satisfaction and reduced recruitment costs, positively impacting the bottom line.
- Profit Margin Analysis: If a company’s gross profit margin falls from 40% to 35%, it represents a 12.5% decrease relative to the original margin, indicating potential issues with pricing, production costs, or sales mix.
These financial applications underscore that percentage decrease is not merely an academic exercise but a practical instrument for navigating the complexities of economic reality.
Interpreting Results and Avoiding Common Financial Missteps
Calculating the percentage of decrease is only half the battle; understanding what the numbers truly signify and avoiding common errors are equally important for robust financial analysis.
Beyond the Numbers: What a Decrease Percentage Tells You
A percentage decrease provides critical context and flags potential issues or successful initiatives.
- Trend Identification: Consistent percentage decreases in a certain category (e.g., utility bills) over several periods indicate a positive trend in cost efficiency. Conversely, consistent decreases in revenue signal a concerning trend requiring intervention.
- Performance Benchmarking: Comparing your investment portfolio’s 5% decrease during a market correction to the overall market’s 10% decrease tells you that your portfolio performed relatively well, possibly due to diversification.
- Impact Assessment: A 15% decrease in your loan’s interest rate has a clear and quantifiable impact on your monthly payments and total interest paid over the life of the loan.
- Decision-Making Catalyst: A significant percentage decrease in a product’s sales might prompt a business to discontinue it, revise its pricing, or launch a new marketing campaign. For personal finance, a percentage decrease in income might necessitate a budget overhaul.
Pitfalls to Avoid in Financial Calculations
Even with a simple formula, missteps can lead to incorrect conclusions.
- Dividing by the Wrong Value: Always divide by the original value, not the new value. Dividing by the new value will give you an inflated or incorrect percentage of change. For example, if a stock goes from $100 to $50, the decrease is 50% ($50/$100). If you mistakenly divide by the new value ($50/$50), you might think it’s 100%, which is incorrect.
- Ignoring Context: A 10% decrease in spending might be great if it’s on discretionary items, but concerning if it’s on essential health insurance premiums (which might mean reduced coverage). Always consider the qualitative factors alongside the quantitative.
- Misinterpreting Small Percentages: A 0.5% decrease might seem negligible, but if it applies to an asset worth millions (like a large real estate portfolio), the absolute monetary decrease can be substantial. Similarly, a small percentage decrease in a recurring cost can lead to significant savings over time.
- Confusing Percentage Decrease with Percentage Point Decrease: If an interest rate drops from 5% to 4%, it’s a 1 percentage point decrease. However, the percentage decrease of the rate itself is (5-4)/5 = 20%. These are different metrics and should not be conflated.
Leveraging Technology for Accuracy
While manual calculation is good for understanding, for complex or repetitive financial analyses, leverage tools:
- Spreadsheets (Excel, Google Sheets): These are invaluable. You can set up formulas once and apply them to thousands of data points, ensuring consistency and reducing human error. Financial templates often have built-in functions for these calculations.
- Financial Software: Many personal finance apps and business accounting software packages automatically track and report percentage changes in various financial categories, offering dashboards that visualize these trends.
Utilizing technology not only saves time but also significantly enhances the accuracy and depth of your financial analysis.
Strategic Use of Percentage Decrease for Future Financial Growth
Mastering percentage decrease isn’t just about understanding past performance; it’s a proactive tool for shaping future financial success. By setting targets and continuously monitoring progress, you can steer your financial journey effectively.
Setting Financial Goals with Decrease Targets
Strategic financial planning often involves setting clear, measurable goals. Percentage decrease provides the framework for these targets.
- Debt Elimination: Instead of vaguely wanting to “pay down debt,” set a goal: “I aim to decrease my credit card debt by 25% this year.” This concrete target allows you to track progress monthly and adjust your spending or payment strategies as needed.
- Expense Optimization: “I will work to decrease my household’s discretionary spending by 10% over the next six months to boost my emergency fund.” Such a goal makes budgeting efforts quantifiable and provides a clear benchmark for success.
- Business Efficiency: A company might set a target to “decrease manufacturing waste by 15% next quarter,” which directly translates into reduced costs and improved profitability. Or, a marketing team might aim to “decrease customer acquisition cost by 20% through targeted campaigns.”
These targets, rooted in percentage decrease, offer clarity, motivation, and a quantifiable way to measure progress towards broader financial objectives.
Continuous Monitoring and Adjustment
Financial landscapes are dynamic, and static analysis rarely suffices. The power of percentage decrease truly shines when applied in a continuous monitoring cycle.
- Regular Review: Periodically (weekly, monthly, quarterly) recalculate percentage decreases for key financial metrics. For personal finance, this means reviewing bank statements and budget categories. For businesses, it involves examining financial reports, sales data, and operational metrics.
- Identify Trends Early: By consistently tracking, you can spot emerging negative trends (e.g., a gradual percentage decrease in passive income) before they escalate into major problems. Conversely, you can quickly identify and capitalize on positive trends.
- Informed Adjustments: If you’re not hitting your targeted percentage decrease for savings, you can adjust your budget immediately. If a marketing campaign isn’t decreasing customer churn as expected, you can pivot your strategy. This proactive adjustment based on clear data is crucial for agility in financial management.
- Performance Reporting: For businesses, regular reporting of percentage decreases (and increases) in key performance indicators (KPIs) to stakeholders (investors, board members) fosters transparency and accountability.
By embedding percentage decrease into your ongoing financial review process, you transform it from a simple calculation into a powerful strategic asset. It empowers you to be an active manager of your finances, capable of understanding past performance, navigating current challenges, and strategically planning for a more prosperous future.
In conclusion, the ability to accurately find and interpret the percentage of decrease is a cornerstone of financial literacy. It equips you with the analytical prowess to manage personal finances more effectively, make smarter investment decisions, and steer business operations toward greater efficiency and profitability. By understanding its formula, applying it correctly, and continuously monitoring your financial data, you unlock a deeper understanding of your financial world and gain the insight needed to thrive.
aViewFromTheCave is a participant in the Amazon Services LLC Associates Program, an affiliate advertising program designed to provide a means for sites to earn advertising fees by advertising and linking to Amazon.com. Amazon, the Amazon logo, AmazonSupply, and the AmazonSupply logo are trademarks of Amazon.com, Inc. or its affiliates. As an Amazon Associate we earn affiliate commissions from qualifying purchases.