In the world of personal finance, business, and investing, percentages are the ubiquitous language of comparison, growth, and decline. From understanding the discount on a new purchase to calculating your investment returns, or even deciphering the intricate details of a loan’s interest rate, the ability to “get the percentage” is not merely a mathematical exercise—it’s a critical life skill. It empowers individuals and businesses to make informed decisions, identify opportunities, and mitigate risks. This comprehensive guide will demystify percentages, breaking down their core mechanics and illustrating their indispensable role across various financial landscapes. We’ll explore the fundamental calculations, delve into real-world applications, and equip you with the tools and insights needed to master this essential financial concept.

The Foundational Role of Percentages in Finance
At its heart, a percentage is a way to express a number as a fraction of 100. It provides a standardized way to compare quantities and understand proportions, making complex financial data digestible and actionable. Without a clear understanding of percentages, interpreting everything from market reports to personal budget breakdowns becomes an exercise in frustration.
What Exactly Is a Percentage?
The word “percent” originates from the Latin “per centum,” meaning “by the hundred.” When we say “20 percent,” we are essentially saying “20 out of every 100.” This simple concept is foundational to virtually all financial analysis. Mathematically, a percentage is calculated by dividing a part by the whole and then multiplying the result by 100.
The basic formula is:
Percentage = (Part / Whole) × 100%
For example, if you spent $30 on groceries from a $200 budget, your grocery spending is (30 / 200) × 100% = 0.15 × 100% = 15% of your budget. This allows for immediate comparison and understanding of the proportion.
The Core Formulas: Calculating Part of a Whole
Beyond the basic definition, understanding how to calculate a percentage of a whole is crucial. This often involves working backward or forward with percentages.
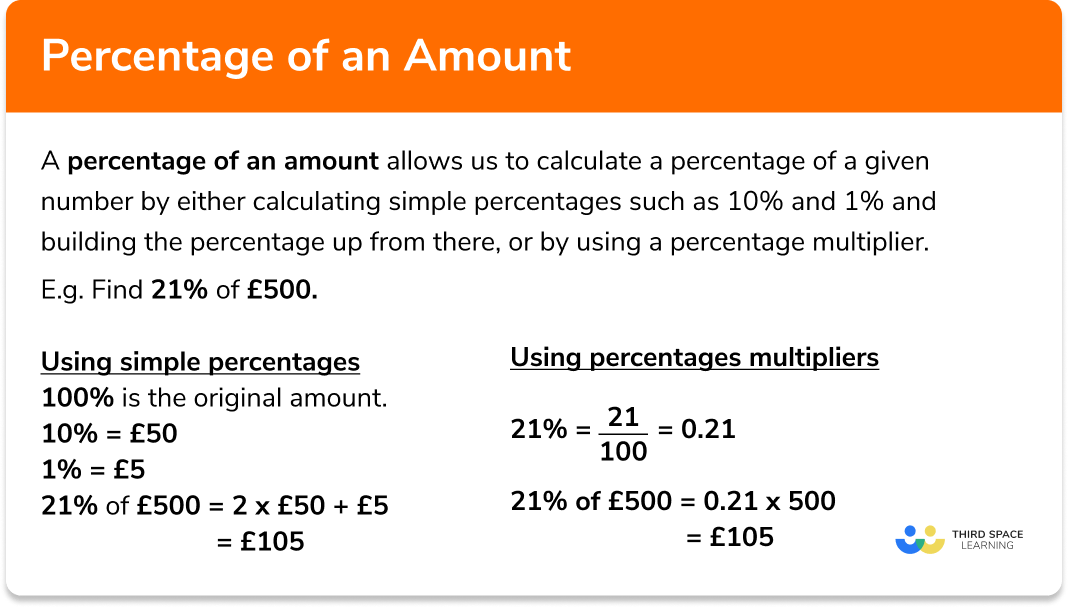
- Finding a percentage of a number: To find X% of a number Y, you convert the percentage to a decimal (divide by 100) and then multiply it by the number.
- Example: What is 15% of $500? (15 / 100) × 500 = 0.15 × 500 = $75. This calculation is vital for discounts, taxes, and commissions.
- Finding the whole when you know the part and the percentage: If you know that a certain amount represents a percentage of an unknown total, you can find the total by dividing the part by the percentage (expressed as a decimal).
- Example: If $75 represents 15% of an original amount, what was the original amount? 75 / 0.15 = $500. This is useful for reverse engineering sales prices or understanding original investment values.
Unpacking Percentage Change: Growth and Decline
One of the most powerful applications of percentages in finance is measuring change over time. Whether it’s the growth of an investment, the inflation rate, or a decrease in sales, percentage change provides a relative measure that’s often more meaningful than raw numbers.
The formula for percentage change is:
Percentage Change = [(New Value – Old Value) / Old Value] × 100%
- Percentage Increase: If the new value is greater than the old value, the result will be positive, indicating a percentage increase.
- Example: Your stock portfolio grew from $10,000 to $12,000. Percentage Increase = [($12,000 – $10,000) / $10,000] × 100% = ($2,000 / $10,000) × 100% = 0.20 × 100% = 20%.
- Percentage Decrease: If the new value is less than the old value, the result will be negative, indicating a percentage decrease.
- Example: A product’s price dropped from $50 to $40. Percentage Decrease = [($40 – $50) / $50] × 100% = (-$10 / $50) × 100% = -0.20 × 100% = -20%. (Often reported as “a 20% decrease”).
Understanding percentage change is fundamental for tracking performance, evaluating economic indicators, and making projections.
Everyday Financial Applications of Percentages
Percentages permeate our daily financial lives, often without us consciously recognizing their pervasive influence. From the moment we consider a purchase to the long-term planning of our savings, percentages are at play.
Decoding Discounts, Markups, and Sales Tax
Shopping is a prime example of daily percentage use.
- Discounts: A common scenario is a sale offering “25% off.” To calculate the savings, you find 25% of the original price and subtract it. If an item is $80 with a 25% discount, the discount is 0.25 × $80 = $20. The final price is $80 – $20 = $60.
- Markups: Businesses use markups to determine selling prices. If a product costs a retailer $50 and they apply a 30% markup, the markup amount is 0.30 × $50 = $15. The selling price would be $50 + $15 = $65.
- Sales Tax: Almost every purchase is subject to sales tax, which is calculated as a percentage of the item’s price. If your purchase is $100 and the sales tax is 8%, the tax is 0.08 × $100 = $8. Your total bill would be $100 + $8 = $108.
Mastering these basic calculations allows you to quickly assess the true cost or savings of any transaction.
Understanding Interest Rates: Simple vs. Compound Growth
Interest rates are arguably one of the most critical percentage applications, profoundly impacting loans, savings, and investments.
- Simple Interest: This is calculated only on the principal amount of a loan or deposit. The formula is:
Simple Interest = Principal × Rate × Time
Where Rate is the annual interest rate expressed as a decimal, and Time is in years. For example, $1,000 at 5% simple interest for 3 years would yield $1,000 × 0.05 × 3 = $150 in interest. - Compound Interest: Often dubbed the “eighth wonder of the world,” compound interest is calculated on the initial principal and also on the accumulated interest from previous periods. This “interest on interest” effect can lead to exponential growth over time.
The formula for future value with compound interest is:
A = P (1 + r/n)^(nt)
Where A = the future value of the investment/loan, including interest, P = the principal investment amount (the initial deposit or loan amount), r = the annual interest rate (as a decimal), n = the number of times that interest is compounded per year, t = the number of years the money is invested or borrowed for.
Understanding the difference between simple and compound interest is crucial for evaluating savings accounts, credit card debt, mortgages, and investment vehicles.
Budgeting and Expense Allocation: The Percentage Approach
Budgeting becomes far more intuitive when framed in percentages. Instead of just tracking dollar amounts, allocating percentages to different categories gives you a clear proportional view of your spending and saving habits.
- 50/30/20 Rule: A popular budgeting guideline suggests allocating 50% of your income to needs, 30% to wants, and 20% to savings and debt repayment. These percentages provide an easy framework to manage your money.
- Tracking Expense Ratios: Businesses use percentages to analyze cost structures. What percentage of revenue goes to salaries? What percentage to marketing? This provides insights into efficiency and profitability. On a personal level, knowing what percentage of your income goes to housing versus transportation helps you identify areas for adjustment.

Leveraging Percentages in Investing and Business
Beyond daily transactions, percentages are the backbone of sophisticated financial analysis in investing and business management. They provide critical metrics for performance evaluation, risk assessment, and strategic planning.
Measuring Investment Returns: ROI and Yields
Investors heavily rely on percentages to gauge the success of their portfolios.
- Return on Investment (ROI): This fundamental metric measures the profitability of an investment relative to its cost.
ROI = [(Current Value of Investment – Cost of Investment) / Cost of Investment] × 100%
A positive ROI means profit, while a negative ROI indicates a loss. ROI helps investors compare different investment opportunities on an apples-to-apples basis. - Yields: Various types of yields (e.g., dividend yield, bond yield) express the income generated by an investment as a percentage of its price.
Dividend Yield = (Annual Dividends Per Share / Price Per Share) × 100%
This helps income-focused investors understand the income-generating capacity of their assets.
Analyzing Profitability: Gross and Net Margins
For businesses, profitability percentages are vital for assessing financial health and operational efficiency.
- Gross Profit Margin: This indicates the percentage of revenue left after deducting the cost of goods sold (COGS).
Gross Profit Margin = [(Revenue – COGS) / Revenue] × 100%
A high gross margin suggests efficient production or strong pricing power. - Net Profit Margin: This is the ultimate measure of a company’s profitability, showing the percentage of revenue remaining after all expenses, including taxes and interest, have been deducted.
Net Profit Margin = (Net Profit / Revenue) × 100%
This metric is crucial for comparing the profitability of companies within the same industry and for tracking a company’s performance over time.
Financial Ratios: A Percentage-Based Lens for Business Health
Many critical financial ratios are expressed as percentages, offering quick insights into a company’s liquidity, solvency, efficiency, and profitability.
- Current Ratio: Although often presented as a decimal, it’s (Current Assets / Current Liabilities). If expressed as a percentage of current liabilities, it shows how much of current assets are available to cover short-term debts.
- Debt-to-Equity Ratio: (Total Debt / Shareholder Equity) × 100%. This percentage indicates the proportion of equity and debt used to finance a company’s assets, revealing its financial leverage and risk.
- Operating Expense Ratio: (Operating Expenses / Revenue) × 100%. This shows how efficiently a company manages its overheads.
These ratios, and many others, allow analysts and investors to quickly assess a company’s financial standing and compare it against industry benchmarks.
Tools and Techniques for Accurate Percentage Calculations
While the underlying principles of percentage calculation are straightforward, practical application often benefits from the right tools and strategies. Accuracy is paramount in finance, as small errors can lead to significant discrepancies.
The Power of Spreadsheets: Excel and Google Sheets
For anyone dealing with multiple calculations, financial modeling, or tracking data over time, spreadsheet software like Microsoft Excel or Google Sheets is indispensable.
- Automated Calculations: Spreadsheets allow you to input formulas once and apply them across thousands of data points, dramatically reducing manual error.
- “Percent Style” Formatting: Cells can be formatted to automatically display numbers as percentages, making data interpretation clearer.
- Built-in Functions: Excel and Google Sheets offer various functions that simplify percentage-related calculations, from calculating growth rates to conditional formatting based on percentage thresholds.
- Data Visualization: Percentages are perfect for pie charts and bar graphs in spreadsheets, offering visual insights into data distribution and changes.
Learning basic spreadsheet functions is an invaluable skill for anyone looking to manage their finances or business operations effectively.
Quick Mental Math Strategies
While precise calculations often require a calculator or spreadsheet, developing mental math shortcuts for percentages can be incredibly useful for quick estimations and on-the-spot decisions.
- Finding 10%: To find 10% of a number, simply move the decimal point one place to the left (e.g., 10% of $250 is $25).
- Finding 5%: Find 10% and then divide by two (e.g., 5% of $250 is $25 / 2 = $12.50).
- Finding 1%: Move the decimal point two places to the left (e.g., 1% of $250 is $2.50).
- Combining strategies: To find 15%, find 10% and 5% and add them together. To find 20%, find 10% and multiply by two.
These techniques allow for rapid assessment of discounts, tips, and quick financial estimations without relying on external tools.
Avoiding Common Percentage Pitfalls
Despite their apparent simplicity, percentages can be tricky.
- Percentage Points vs. Percentage Change: A common error is confusing a “percentage point” change with a “percentage change.” If an interest rate goes from 5% to 6%, that’s a 1 percentage point increase, not a 1% increase (which would be 1% of 5%, or 0.05%). The actual percentage change is [(6-5)/5]*100% = 20%.
- Sequential Percentage Changes: If an item is discounted by 20% and then another 10%, it’s not a 30% discount. A $100 item discounted by 20% is $80. A further 10% discount on $80 is $8, bringing the price to $72. This is an overall 28% discount, not 30%. Always calculate sequential changes on the new base amount.
- Misinterpreting the “Whole”: Ensure you are dividing by the correct “whole” or base value, especially when calculating changes.
Mindfulness of these common mistakes ensures accurate financial interpretation and avoids costly miscalculations.
Why Percentage Mastery Matters for Your Financial Future
The ability to accurately “get the percentage” transcends mere arithmetic; it’s a cornerstone of financial literacy. In an increasingly data-driven world, where financial information is constantly presented in percentage terms, understanding these concepts is non-negotiable for personal well-being and professional success.
Empowering Informed Financial Decisions
From selecting the best credit card interest rate to evaluating a mortgage offer, comparing investment performance, or negotiating a salary increase, percentages provide the context necessary for sound decision-making. They allow you to quantify risk, predict outcomes, and understand the true cost or benefit of financial choices. A confident grasp of percentages enables you to critically assess financial claims, identify misleading statistics, and protect yourself from unfavorable terms.
Building Financial Literacy and Confidence
Mastering percentages builds confidence in your financial capabilities. It transforms intimidating numbers into understandable proportions, allowing you to take control of your financial narrative. Whether you’re managing a household budget, planning for retirement, starting a business, or making significant investments, the ability to effortlessly navigate percentage calculations empowers you to engage more deeply with your money and make strategic choices that align with your long-term goals. In essence, understanding “how you get the percentage” is not just about a mathematical formula; it’s about unlocking a clearer, more powerful perspective on your entire financial life.
aViewFromTheCave is a participant in the Amazon Services LLC Associates Program, an affiliate advertising program designed to provide a means for sites to earn advertising fees by advertising and linking to Amazon.com. Amazon, the Amazon logo, AmazonSupply, and the AmazonSupply logo are trademarks of Amazon.com, Inc. or its affiliates. As an Amazon Associate we earn affiliate commissions from qualifying purchases.