
For anyone engaged with the stock market, whether a seasoned day trader or a long-term investor, understanding the precise number of trading days in a year is more than just a trivial calendar query—it’s a foundational element of financial literacy. It impacts everything from trading strategies and investment planning to risk assessment and the scheduling of economic data releases. While a calendar year boasts 365 (or 366) days, the financial markets operate on a much more condensed schedule, taking into account weekends and a host of public holidays.
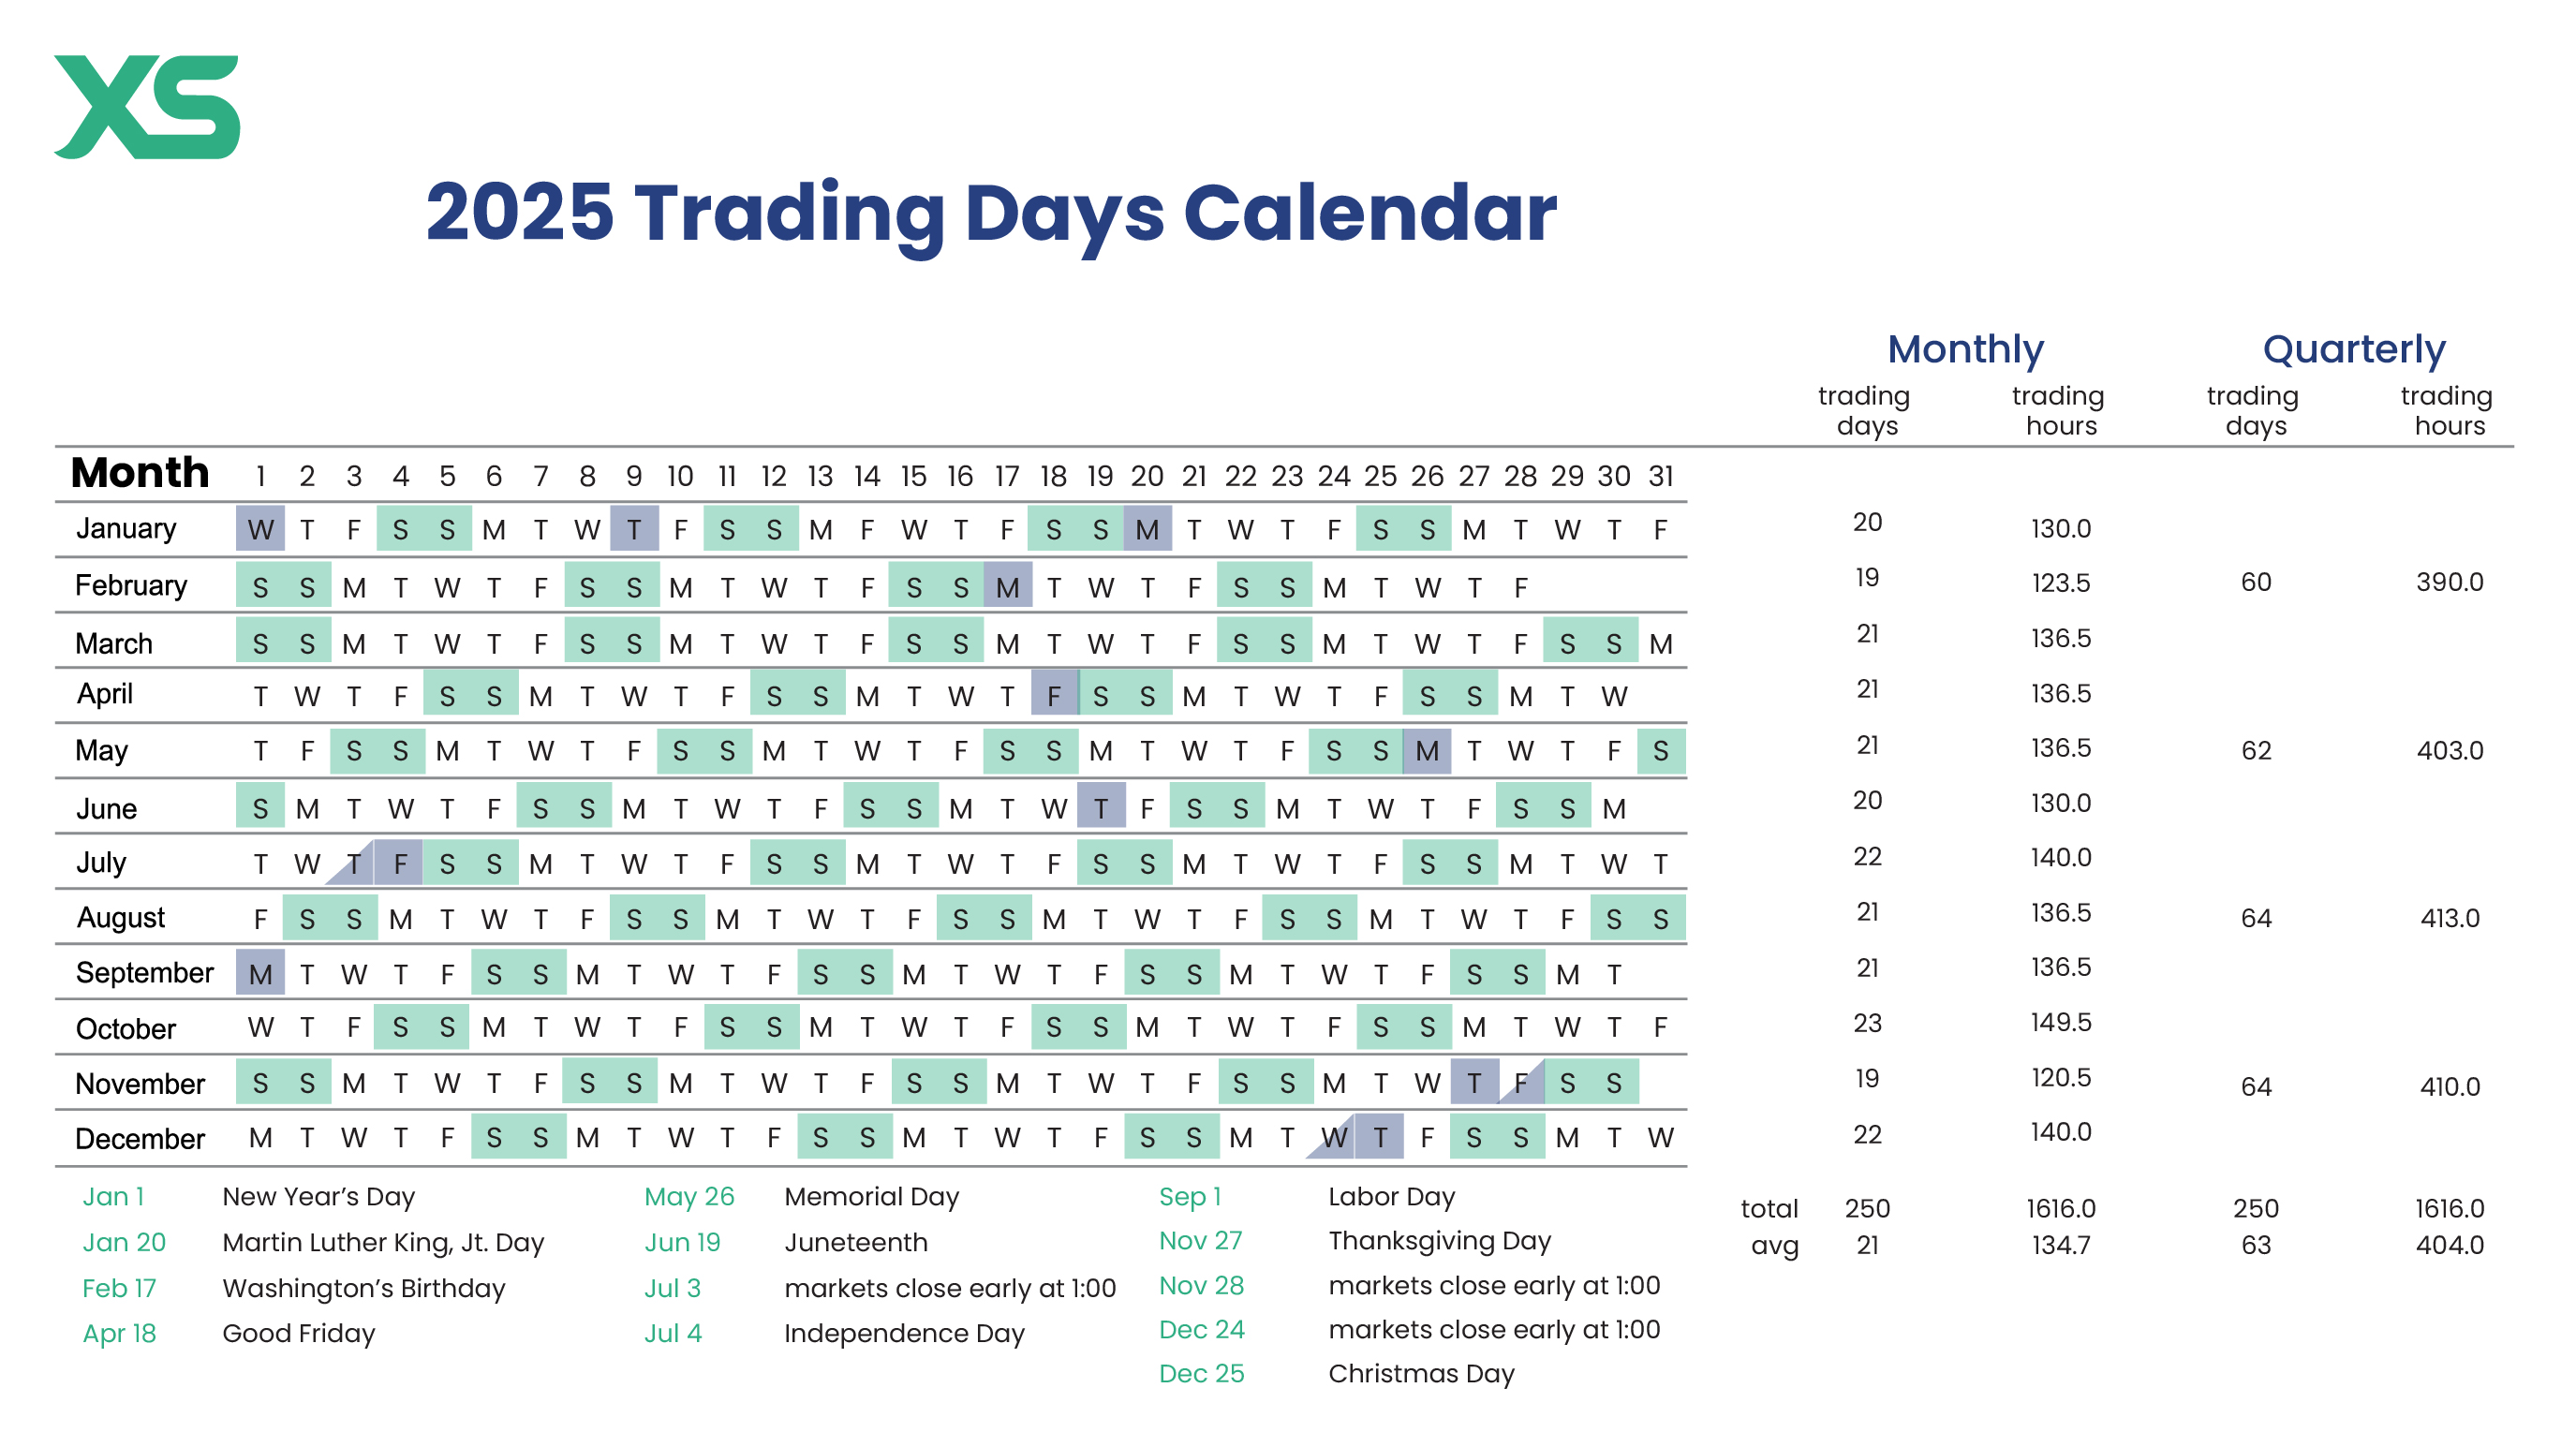
In the major U.S. stock markets, such as the New York Stock Exchange (NYSE) and Nasdaq, the average number of trading days hovers around 250 to 252 days per year. This figure is not static; it fluctuates slightly year-to-year based on how weekends align with public holidays, but it provides a critical benchmark for all market participants. This article delves into how this number is derived, why its exactitude matters, and the broader implications for those navigating the intricate world of finance. We’ll explore the various factors that shape the market calendar, from statutory holidays to global variations, offering insights that can enhance your investment approach and financial planning.
The Core Count: Calculating Trading Days in Major U.S. Markets
The journey to ascertain the exact number of stock trading days begins with the full calendar year and systematically subtracts periods when the markets are closed. This meticulous process ensures clarity for all financial activities.
Starting with the Calendar: Total Days and Weekends
A standard year consists of 365 days, with leap years adding an extra day (366 days) every four years. The first and most significant subtraction from this total are weekends. Both the NYSE and Nasdaq adhere to a five-day trading week, Monday through Friday, mirroring standard business operations. Consequently, Saturdays and Sundays are non-trading days.
Over the course of a year, there are approximately 52 weeks. Since each week contains two weekend days, this accounts for roughly 104 weekend days (52 weeks * 2 days/week). Subtracting these 104 days from the annual total brings us down to around 261 trading days. However, this is merely an initial estimate, as numerous public holidays also lead to market closures.
Unpacking U.S. Market Holidays: A Comprehensive List
Beyond weekends, U.S. financial markets observe a specific set of holidays, during which regular trading sessions are suspended. These closures are critical to note as they punctuate the trading calendar, influencing market activity and investor sentiment around these periods. The standard list of observed holidays for the U.S. equity markets typically includes:
- New Year’s Day: January 1st. If it falls on a weekend, the holiday is usually observed on the preceding Friday or following Monday.
- Martin Luther King, Jr. Day: Third Monday in January.
- Presidents’ Day (Washington’s Birthday): Third Monday in February.
- Good Friday: The Friday before Easter Sunday. The only religious holiday observed by the U.S. stock markets.
- Memorial Day: Last Monday in May.
- Juneteenth National Independence Day: June 19th. If it falls on a weekend, it’s observed on the nearest weekday.
- Independence Day: July 4th. Again, observed on the nearest weekday if it falls on a weekend.
- Labor Day: First Monday in September.
- Thanksgiving Day: Fourth Thursday in November.
- Christmas Day: December 25th. Observed on the nearest weekday if on a weekend.
Counting these 9-10 fixed holidays each year, and adjusting for weekend observances, removes additional days from the trading calendar. For instance, if New Year’s Day falls on a Saturday, the market might be closed on the preceding Friday. If it falls on a Sunday, the market might be closed on the following Monday. These adjustments are crucial for pinpointing the exact number of trading days in any given year. Taking these holidays into account typically brings the number of trading days down from the initial 261 to the aforementioned 250-252 range.
The Nuance of Half-Day Trading Sessions
While full market closures are straightforward, the U.S. stock market also has a few instances of shortened, or “half-day,” trading sessions. These typically occur on the day before a major holiday, allowing market participants to conclude business early. Common examples include:
- The day before Independence Day (if July 4th is on a Tuesday, Wednesday, Thursday, or Friday).
- The day after Thanksgiving (Black Friday).
- Christmas Eve (if it falls on a weekday and the market is open).
During these half-day sessions, trading typically concludes at 1:00 PM ET, rather than the usual 4:00 PM ET close. Although these are still counted as “trading days,” the reduced hours can significantly impact trading volume, liquidity, and the strategies employed by short-term traders. Volume often thins out in the afternoon, leading to potentially choppier price action or a lack of significant movement. For investors, it’s important to be aware of these shortened sessions, especially if they plan to execute trades or observe market reactions to news on these specific dates.
Why This Number Matters: Implications for Investors and Traders
The precise number of trading days is far from an arbitrary detail; it holds significant implications for various market participants, influencing decision-making, risk management, and overall financial strategy.
Strategic Planning for Active Traders
For active traders—day traders, swing traders, and those who frequently adjust their portfolios—the market calendar is a critical tool. Knowing the exact trading days allows them to:
- Optimize Trading Schedules: Plan their trading activity around market open and close dates. Non-trading days mean no opportunity for market action, requiring traders to either close positions or manage overnight/weekend risk.
- Anticipate Volatility and Liquidity: Holidays and half-days often precede or follow periods of reduced liquidity, which can lead to increased volatility when the market reopens. Understanding these patterns helps traders adjust their position sizing and stop-loss orders.
- Manage Options and Futures Expirations: Derivatives contracts have specific expiration dates, and knowing whether those dates fall on a trading day or holiday is paramount for timely execution or rolling over positions.
- Factor in “Holiday Drifts”: Some historical data suggests certain pre-holiday or post-holiday market behaviors (e.g., pre-holiday rallies), which active traders may attempt to capitalize on.
For these participants, every trading day represents an opportunity, and every non-trading day necessitates careful pre-planning and risk assessment to avoid unexpected market gaps or adverse movements upon reopening.
Long-Term Investor Perspectives and Portfolio Management
While long-term investors are less concerned with daily market fluctuations, the trading calendar still plays a role in their strategic thinking:
- Dividend Schedules: Companies declare dividends with specific record dates and payment dates. Investors need to be aware of trading days to ensure they own shares by the ex-dividend date to qualify for payments.
- Rebalancing and Contributions: Many long-term investors have a schedule for portfolio rebalancing or making regular contributions (e.g., monthly contributions to a retirement account). Knowing the market calendar helps ensure these actions are executed on trading days, especially if linked to specific market conditions or account types.
- Understanding Market Cycles: The annual count of trading days informs how long-term market performance metrics are calculated. For example, a “year-to-date” return is measured across trading days, not calendar days.
- Strategic Entry/Exit Points: Although infrequent, long-term investors might plan larger strategic moves (e.g., selling a large block of stock, making a significant new investment) and will want to ensure the market is open and liquid on their chosen date.
For long-term investors, the trading day count primarily provides context for performance measurement and helps in scheduling intermittent, larger-scale portfolio adjustments, ensuring they align with market operational times.
Impact on Financial Reporting and Market Analysis
The market calendar profoundly influences corporate and economic reporting, which in turn drives market analysis:
- Earnings Reports: Public companies often release their quarterly and annual earnings reports either before market open or after market close on a trading day. Analysts and investors closely follow these schedules, and knowing the trading calendar is essential for anticipating market reactions.
- Economic Data Releases: Key economic indicators (e.g., CPI, unemployment figures, GDP reports) are meticulously scheduled by government agencies. These releases almost always occur on trading days, typically before the market opens, to allow sufficient time for digestion and reaction.
- Fiscal Year-Ends: While a company’s fiscal year doesn’t always align with the calendar year, their financial reporting cycles are nevertheless tied to the availability of trading days for public disclosure and market response.
- Analyst Projections and Research: Financial analysts and research firms operate on the market calendar, preparing their reports and recommendations in sync with trading opportunities and disclosures. Non-trading days are often used for in-depth research without the pressure of live market action.
Ultimately, the market’s trading schedule dictates the rhythm of financial information flow, ensuring that critical data is disseminated and reacted to within a structured and predictable framework.
Beyond the U.S.: Global Market Differences and Extended Trading
While our focus has been primarily on U.S. markets, it’s important to recognize that the global financial landscape presents a diverse array of trading calendars and operational nuances. Furthermore, the concept of a “trading day” itself has expanded beyond traditional market hours.
International Markets: Varying Calendars and Cultures
Each country’s stock exchange operates according to its own national holidays and cultural observances. Consequently, the number of trading days can vary significantly around the world:
- European Markets: Exchanges like the London Stock Exchange (LSE), Euronext (Paris, Amsterdam, Brussels), and the Frankfurt Stock Exchange (Xetra) observe a mix of national public holidays and some regional or religious holidays (e.g., Easter Monday, Boxing Day). Their total trading days might be slightly different from the U.S.
- Asian Markets: Exchanges in Tokyo, Hong Kong, Shanghai, and Mumbai have unique holiday calendars, often including major cultural festivals (e.g., Lunar New Year in East Asia, Diwali in India). These can lead to multi-day closures that significantly impact trading volumes and market sentiment across the region.
- Middle Eastern Markets: Some markets, like those in Dubai or Saudi Arabia, operate on a Sunday-Thursday week, with Friday and Saturday being their weekend. This fundamental shift completely alters their trading day count relative to Western markets.
For investors with diversified international portfolios or those engaged in global macro trading, understanding these disparate calendars is crucial. A holiday in one major market can affect global liquidity and correlation, even if other markets remain open.
Pre-Market and After-Hours Trading: Extending the “Day”
The traditional 9:30 AM to 4:00 PM ET trading window for U.S. equities doesn’t fully capture all market activity. Electronic trading allows for pre-market trading (typically 4:00 AM to 9:30 AM ET) and after-hours trading (typically 4:00 PM to 8:00 PM ET) on regular trading days.
While these extended hours don’t add to the “number of trading days,” they significantly extend the opportunity for price discovery and order execution. Many corporate earnings reports and major news announcements are released outside regular trading hours, making pre-market and after-hours sessions critical for initial market reactions. However, these sessions typically have lower liquidity and wider bid-ask spreads, presenting both opportunities and risks for traders. Understanding when these extended hours are active—and that they are not available on full market holidays—is key to a comprehensive market strategy.
The Psychology of Market Closures and Gaps
Non-trading days, especially extended holiday weekends or multi-day national closures, create unique psychological and structural dynamics in the market:
- Overnight Risk and Gaps: During market closures, significant geopolitical events, economic data, or company-specific news can break. When the market reopens, prices may “gap” up or down significantly from the previous close, bypassing typical risk management tools like stop-loss orders.
- Reduced Liquidity and Volume: As observed with half-day sessions, periods leading into and out of holidays often see reduced trading volume. This can lead to exaggerated price movements on light volume or simply a lack of clear direction.
- Time for Reflection: Paradoxically, non-trading days offer investors a chance to step back, re-evaluate their strategies, conduct research, and distance themselves from the immediate emotional pull of market movements. This reflective period can be invaluable for making rational long-term decisions.
Understanding the implications of market closures, both in terms of potential financial impact and psychological benefits, is an integral part of becoming a well-rounded investor.
Maximizing Non-Trading Days: Strategic Considerations and Risk Management
While market closures halt direct trading activity, they don’t necessarily signal a complete pause in an investor’s or trader’s financial journey. In fact, these periods offer unique opportunities for strategic reflection, planning, and risk mitigation.
Using Off-Days for Research and Reassessment
For many, non-trading days—whether it’s a weekend or a public holiday—are ideal for stepping away from the live ticker and engaging in deeper analysis:
- Portfolio Review: Take time to review your current holdings, assess their performance against benchmarks, and ensure they still align with your financial goals and risk tolerance.
- Fundamental Research: Dive into company financial reports, earnings call transcripts, industry trends, and economic forecasts that you might not have time for during the trading week. Understanding the fundamentals behind your investments is crucial.
- Technical Analysis Practice: For traders, off-days are excellent for backtesting strategies, reviewing past chart patterns, and refining technical indicators without the pressure of live market movements.
- Educational Development: Read investment books, watch educational webinars, or catch up on financial news and analyses. Continuous learning is a hallmark of successful investors.
- Financial Planning: Use the downtime to review your overall financial plan, budget, retirement savings, and other personal finance goals. This holistic view ensures your investment strategy is integrated with your broader financial well-being.
By proactively using these breaks, investors can return to the market more informed, confident, and prepared, transforming seemingly unproductive days into valuable strategic sessions.
Preparing for Volatility and Overnight Risk
Non-trading days, especially extended ones, introduce inherent risks, primarily due to events occurring when markets are closed. Smart preparation can mitigate these:
- Evaluate Open Positions: Before a holiday closure, active traders should critically assess any open positions. Consider whether to reduce exposure, take profits, or implement tighter stop-losses to protect against potential weekend/holiday gaps.
- Stay Informed: Even when markets are closed, major news—geopolitical developments, central bank announcements from other regions, or unexpected corporate disclosures—can break. Keeping an eye on global news can provide an early indication of how markets might react upon reopening.
- Consider Options for Hedging: For larger portfolios, options contracts or other derivatives can be used to hedge against potential downside risk during extended closures. This requires advanced planning and understanding of complex instruments.
- Cash Management: Ensure you have adequate liquidity for any planned transactions or to capitalize on potential post-holiday market movements.
Effective risk management during non-trading periods is about anticipation and proactive decision-making, rather than reactive panic.
Diversification and Hedging Strategies for Closed Markets
While individual stock positions face “gap risk” during closures, a well-diversified portfolio inherently manages some of this. However, strategic considerations extend further:
- Asset Class Diversification: Investing across different asset classes (stocks, bonds, real estate, commodities) means that even if one market is closed or experiences volatility, others may not be directly affected, providing a buffer.
- Geographic Diversification: As discussed, global markets operate on different schedules. An event that impacts a U.S. holiday might see reactions in open European or Asian markets, offering insights into potential U.S. market opening behavior.
- Alternative Investments: Some alternative investments, like certain types of real estate or private equity, are not directly tied to public market trading hours, offering a different rhythm of liquidity and return.
- Futures and Forex: For sophisticated traders, futures markets (which often have extended trading hours even during some holidays) and the 24/5 forex market can offer continuous opportunities or hedging vehicles, though they come with their own set of risks and complexities.
The strategic deployment of diversification and hedging techniques ensures that an investor’s financial well-being is not solely dependent on the opening and closing bell of their primary market.

Conclusion: Embracing the Full Financial Calendar
The question “how many stock trading days in a year?” opens a door to a deeper understanding of market mechanics, strategic planning, and risk management within the financial world. We’ve established that for major U.S. equity markets, the answer typically lies between 250 and 252 days, a figure derived by subtracting weekends and a defined list of public holidays from the calendar year. This number is not static, varying slightly based on how holidays align with the week.
Understanding this trading rhythm is indispensable for every market participant. For active traders, it dictates daily strategies, liquidity expectations, and risk exposure. For long-term investors, it provides context for performance analysis, dividend schedules, and strategic rebalancing. Moreover, acknowledging global market variations and the rise of extended trading hours paints a fuller picture of continuous market activity. Crucially, non-trading days are not simply voids but valuable opportunities for research, reassessment, and refining investment strategies, ultimately contributing to more informed and resilient financial decisions.
By recognizing the structure and nuances of the market calendar, investors can navigate the ebbs and flows with greater confidence, transforming what might seem like mundane schedule details into powerful tools for achieving their financial aspirations.
aViewFromTheCave is a participant in the Amazon Services LLC Associates Program, an affiliate advertising program designed to provide a means for sites to earn advertising fees by advertising and linking to Amazon.com. Amazon, the Amazon logo, AmazonSupply, and the AmazonSupply logo are trademarks of Amazon.com, Inc. or its affiliates. As an Amazon Associate we earn affiliate commissions from qualifying purchases.