
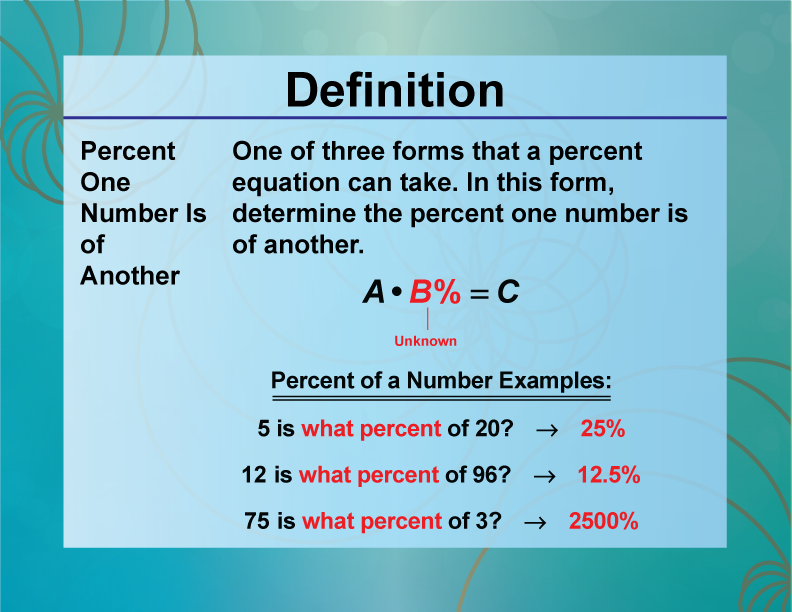
In the intricate world of finance, few metrics are as ubiquitous and insightful as percentages. From personal budgeting to corporate financial statements and global economic analyses, understanding “what percent of the” various components contribute to a whole is fundamental. Percentages provide a universal language for comparison, allocation, and evaluation, enabling individuals, businesses, and policymakers to make informed decisions. They distill complex data into digestible figures, revealing underlying trends, efficiencies, and areas of concern. This article delves into the critical role of percentages across different facets of finance, offering a comprehensive guide to interpreting and leveraging these powerful numerical tools for greater financial literacy and strategic success.
The Foundation of Financial Literacy: Understanding Key Percentages
At the heart of personal finance lies the ability to manage one’s income and expenses effectively. Percentages offer a clear framework for this, translating raw numbers into actionable insights about spending habits, savings rates, and debt burdens. By quantifying financial flows as proportions, individuals gain a crucial perspective on their financial health and trajectory.
Budgeting and Income Allocation: The 50/30/20 Rule and Beyond
One of the most widely cited percentage-based budgeting strategies is the 50/30/20 rule, popularized by Senator Elizabeth Warren. This simple yet powerful guideline suggests allocating:
- 50% of your after-tax income to Needs: This includes essential expenses like housing, utilities, groceries, transportation, and minimum loan payments. The principle here is that these critical outflows should not exceed half of your disposable income.
- 30% to Wants: This category encompasses discretionary spending that enhances quality of life but isn’t strictly necessary. Examples include dining out, entertainment, hobbies, vacations, and subscription services. Managing this percentage is key to striking a balance between enjoying life and achieving financial goals.
- 20% to Savings and Debt Repayment: This crucial segment is dedicated to building wealth and reducing liabilities. It includes contributions to retirement accounts (401k, IRA), emergency funds, investments, and any debt payments above the minimum required, such as accelerating mortgage or student loan repayment.
While the 50/30/20 rule serves as an excellent starting point, it’s not a one-size-fits-all solution. Life circumstances, income levels, and financial goals vary widely. For instance, someone living in a high cost-of-living area might find their “needs” pushing past 50%, requiring adjustments in other categories. Conversely, high-earners may find they can comfortably save and invest a much larger percentage. The underlying lesson, however, remains: consistently monitoring “what percent of the” your income is allocated to different categories is vital for maintaining financial control and progressing towards objectives like homeownership, retirement, or financial independence. Customizing these percentages to reflect personal realities, while adhering to the core principle of prioritizing savings and debt reduction, is where the true power of this framework lies.
Debt Management: What Percent of Your Income Goes to Debt?
Beyond budgeting for regular expenses, understanding your debt-to-income (DTI) ratio is paramount for assessing financial stability and eligibility for new loans. Lenders frequently scrutinize DTI, which represents “what percent of the” your gross monthly income is consumed by monthly debt payments.
- Front-end DTI (Housing Ratio): This calculates the percentage of your gross income that goes towards housing costs (mortgage principal and interest, property taxes, homeowner’s insurance). Lenders often prefer this to be below 28%.
- Back-end DTI (Total Debt Ratio): This includes all monthly debt obligations—housing costs plus credit card payments, car loans, student loan payments, and any other regular debt—as a percentage of your gross monthly income. Most lenders look for a back-end DTI below 36% for prime borrowers, although this can extend up to 43% or even 50% for certain loan programs like FHA.
A high DTI ratio signals financial strain, potentially limiting access to new credit or making existing debt unmanageable. Conversely, a low DTI indicates robust financial health, suggesting that a significant portion of income remains available after servicing debts, providing flexibility and security. Proactively managing this percentage involves strategies like increasing income, reducing unnecessary spending to pay down debt faster, and consolidating high-interest debts. Regularly evaluating “what percent of the” your earnings are dedicated to debt service is a critical step in achieving debt freedom and enhancing overall financial well-being.
Strategic Investing: Percentage-Based Portfolio Construction
In the realm of investing, percentages are the bedrock of strategic planning, risk management, and performance evaluation. They guide decisions on how to allocate capital across different asset classes, gauge risk exposure, and track returns effectively. Understanding these percentages is essential for building a resilient and growth-oriented investment portfolio.
Asset Allocation: The Cornerstone of Long-Term Growth
Asset allocation refers to the process of dividing an investment portfolio among different asset categories, such as stocks, bonds, and cash equivalents. The specific percentages allocated to each asset class are not arbitrary; they are strategically chosen based on an investor’s time horizon, risk tolerance, and financial goals.
- Stocks (Equities): Typically offer higher growth potential but come with greater volatility. The percentage allocated to stocks often reflects an investor’s capacity and willingness to take on risk.
- Bonds (Fixed Income): Generally provide more stability and income, acting as a buffer during market downturns, albeit with lower growth potential than stocks.
- Cash Equivalents: Offer liquidity and capital preservation, useful for short-term needs or as a temporary holding during market uncertainty.
A common heuristic for asset allocation is the “110 minus your age” rule for determining “what percent of the” your portfolio should be in stocks. For example, a 30-year-old might aim for 80% stocks (110 – 30), while a 60-year-old might target 50% stocks (110 – 60). This rule suggests that younger investors, with a longer time horizon to recover from market fluctuations, can afford to take on more risk, while older investors approaching retirement should prioritize capital preservation. However, this is a guideline, not a strict rule, and personal circumstances always dictate the best approach. Diversification—spreading investments across various sectors, geographies, and company sizes—further refines this strategy, ensuring that “what percent of the” your capital is exposed to any single risk factor is minimized.
Risk Tolerance and Age-Based Percentages
Risk tolerance is a crucial, deeply personal factor influencing asset allocation. It refers to an investor’s psychological capacity to endure potential losses in exchange for higher returns. While age-based rules provide a general framework, an individual’s unique comfort level with risk can significantly alter these percentages.
- Aggressive Investors: Those with a high risk tolerance, often younger, might allocate 80-100% of their portfolio to stocks, including higher-growth, higher-risk options like small-cap or emerging market equities. They understand that “what percent of the” their portfolio might temporarily decline is a trade-off for potentially superior long-term gains.
- Moderate Investors: A balanced approach, perhaps 60% stocks and 40% bonds, is common for those seeking a blend of growth and stability.
- Conservative Investors: Individuals nearing retirement or with a low risk tolerance might opt for a higher percentage of bonds and cash (e.g., 40% stocks, 60% bonds), prioritizing capital preservation and income generation over aggressive growth.
Furthermore, factors like job security, emergency fund size, and future income prospects also play a role. An individual with a stable job and a robust emergency fund might be more comfortable with a higher stock allocation, even if they are older, because “what percent of the” their immediate financial security relies on the stock market is relatively low. Rebalancing the portfolio periodically to maintain these target percentages is equally important. As market values shift, one asset class might grow to represent a larger percentage of the portfolio than intended. Rebalancing brings it back into alignment, ensuring the risk profile remains consistent with the investor’s goals.
Business Finance Insights: Percentages for Profitability and Growth
For businesses, percentages are indispensable tools for analyzing operational efficiency, profitability, and financial health. They provide a standardized way to compare performance over time, against industry benchmarks, and with competitors, answering crucial questions about “what percent of the” revenue translates into profit or how efficiently assets are being utilized.
Profit Margins: Gross, Operating, and Net

Profit margins are among the most critical financial ratios, revealing “what percent of the” revenue a company retains after various costs are deducted. They offer a layered view of profitability:
- Gross Profit Margin: This is the percentage of revenue remaining after subtracting the cost of goods sold (COGS). It indicates how efficiently a company produces its goods or services. A declining gross margin could signal rising production costs or aggressive pricing strategies.
- *Formula: (Revenue – COGS) / Revenue * 100%*
- Operating Profit Margin: This goes a step further, showing the percentage of revenue left after deducting COGS and operating expenses (like salaries, rent, marketing, and R&D). It reflects the efficiency of a company’s core operations before accounting for interest and taxes.
- *Formula: Operating Income / Revenue * 100%*
- Net Profit Margin: The ultimate measure of profitability, this percentage indicates “what percent of the” total revenue is left as profit for shareholders after all expenses, including COGS, operating expenses, interest, and taxes, have been paid. It represents the bottom line and is a key indicator of a company’s overall financial health and management effectiveness.
- *Formula: Net Income / Revenue * 100%*
Monitoring these margins over time and comparing them to industry averages helps businesses identify strengths, weaknesses, and areas for improvement. A high net profit margin, for example, suggests effective cost control and strong pricing power, while a low or declining margin might necessitate a review of operational strategies or a search for cost efficiencies.
Expense Ratios and Operational Efficiency
Beyond profit margins, various expense ratios provide deeper insights into a company’s operational efficiency, revealing “what percent of the” revenue or assets are being consumed by specific types of costs.
- Selling, General, and Administrative (SG&A) Expense Ratio: This ratio measures SG&A expenses as a percentage of revenue, indicating the efficiency of administrative and marketing efforts. A high percentage might suggest bloated overhead or inefficient sales processes.
- Research and Development (R&D) Expense Ratio: For tech or pharmaceutical companies, this ratio (R&D as a percentage of revenue) is crucial, showing the investment in future innovation.
- Inventory Turnover Ratio: While not a direct percentage, it often translates into insights about the percentage of capital tied up in inventory. A low turnover suggests inefficient inventory management, whereas a high turnover indicates efficient sales and less capital tied up in goods.
- Asset Turnover Ratio: Measures “what percent of the” sales revenue is generated for every dollar of assets. A higher ratio generally indicates more efficient use of assets to generate sales.
These ratios are invaluable for internal management and external stakeholders. They allow managers to pinpoint areas where costs are out of line or where resources could be better deployed. For investors, they offer a window into a company’s operational discipline and its ability to convert resources into sales and profits, providing a comprehensive picture of its financial acumen beyond just the top and bottom lines.
Economic Perspectives: Percentages Shaping Global Wealth
On a macroeconomic scale, percentages are indispensable for understanding national and global economic trends, wealth distribution, and the impact of policies. They allow economists and policymakers to quantify complex phenomena, compare economies, and identify challenges and opportunities.
Income Inequality and Wealth Distribution
Discussions about economic equity frequently revolve around percentages, particularly “what percent of the” total income or wealth is held by different segments of the population.
- Gini Coefficient: While not a percentage itself, this widely used measure of income inequality often translates into discussions about wealth distribution. A Gini coefficient of 0 represents perfect equality (everyone has the same income), while 1 represents perfect inequality (one person has all the income). Countries and regions are often compared by their Gini scores.
- Income Share of Top X%: A more direct percentage measure, this tracks “what percent of the” total national income is earned by the wealthiest 1%, 10%, or 20% of the population. Similarly, wealth concentration analyzes “what percent of the” total wealth (assets minus liabilities) is owned by these top echelons.
These percentages are critical indicators for social and economic policy. High levels of income and wealth inequality can lead to social unrest, reduced economic mobility, and slower overall economic growth. Policymakers use these statistics to evaluate the effectiveness of tax systems, social welfare programs, and educational initiatives aimed at promoting a more equitable distribution of economic prosperity. Understanding these percentages helps to frame debates about progressive taxation, minimum wage policies, and access to opportunities.
Inflation and Its Impact on Purchasing Power
Inflation, defined as the rate at which the general level of prices for goods and services is rising, and consequently, the purchasing power of currency is falling, is almost always expressed as a percentage.
- Consumer Price Index (CPI): The most common measure of inflation, the CPI calculates the average change over time in the prices paid by urban consumers for a market basket of consumer goods and services. The year-over-year percentage change in the CPI reflects the annual inflation rate. For example, if the CPI increases by 3% in a year, it means that, on average, prices have risen by “what percent of the” their previous value.
- Core Inflation: This measure excludes volatile items like food and energy prices to provide a clearer picture of underlying inflationary trends.
High inflation erodes the value of savings and income, as “what percent of the” your money can buy decreases over time. For investors, understanding inflation percentages is crucial for assessing real (inflation-adjusted) returns. For central banks, managing inflation within a target percentage range (often around 2%) is a primary mandate, achieved through monetary policy tools like interest rate adjustments. Individuals, businesses, and governments all track inflation percentages closely to inform wage negotiations, pricing strategies, and fiscal policies, recognizing its profound impact on economic stability and individual financial security.
Leveraging Percentages for Financial Planning and Decision-Making
Ultimately, the power of percentages lies in their practical application to financial planning and decision-making. They transform abstract financial concepts into concrete, measurable goals and provide a roadmap for achieving them.
Retirement Planning: Saving the Right Percentage
Retirement planning is perhaps one of the most critical areas where percentage-based goals are indispensable. The question, “what percent of the” your income should you save for retirement, is central to ensuring a comfortable post-work life.
- General Guidelines: Financial advisors often recommend saving between 10-15% of your gross income for retirement throughout your career. However, this percentage can vary based on your age when you start saving, your desired retirement lifestyle, and your expected retirement age. Someone starting later might need to save 20% or more.
- Catch-up Contributions: For those over 50, government programs like 401(k)s and IRAs allow for “catch-up” contributions, enabling them to save a higher percentage of their income to make up for lost time.
Consistency in saving a defined percentage, compounded over decades, is far more impactful than intermittent large contributions. Regularly reviewing “what percent of the” your income is going into retirement savings ensures you remain on track, making adjustments as life circumstances change.
Emergency Funds: How Much is Enough?
An emergency fund, a liquid reserve of cash, is a cornerstone of personal financial security. The common advice for “what percent of the” your monthly expenses should be covered by this fund typically ranges from three to six months.
- Three to Six Months: This benchmark provides a buffer against unexpected events like job loss, medical emergencies, or significant home repairs. For individuals with stable employment and multiple income streams, three months might suffice.
- Six to Twelve Months: For those with less stable income (e.g., freelancers, commission-based sales) or dependents, a larger fund covering six to twelve months of expenses is often recommended.
The exact percentage of your income or expenses allocated to your emergency fund is a personal decision, but the principle is universal: having readily accessible cash that covers “what percent of the” your essential living costs for an extended period offers invaluable peace of mind and prevents the need to resort to high-interest debt during crises.
In conclusion, percentages are far more than just mathematical constructs; they are the bedrock of financial understanding, guiding decisions from the individual household budget to the boardrooms of multinational corporations and the chambers of central banks. By consistently asking and answering “what percent of the” our income, expenses, investments, or economic indicators reveal, we unlock deeper insights, foster greater control, and pave the way for informed choices that lead to sustained financial success and stability. Mastering the language of percentages is, therefore, an indispensable skill for anyone navigating the complexities of the financial world.
aViewFromTheCave is a participant in the Amazon Services LLC Associates Program, an affiliate advertising program designed to provide a means for sites to earn advertising fees by advertising and linking to Amazon.com. Amazon, the Amazon logo, AmazonSupply, and the AmazonSupply logo are trademarks of Amazon.com, Inc. or its affiliates. As an Amazon Associate we earn affiliate commissions from qualifying purchases.