
In the dynamic world of finance, where trends shift, investments fluctuate, and personal wealth evolves, understanding growth is paramount. One of the most fundamental yet powerful metrics for quantifying this growth is the percent increase. Far from being a mere academic exercise, calculating percent increase is an indispensable skill for anyone navigating personal finance, investing, business strategy, or economic analysis. It allows us to measure change in a standardized, comparable way, translating raw numerical shifts into actionable insights. Whether you’re tracking the performance of your stock portfolio, analyzing revenue growth for your business, evaluating a salary offer, or simply trying to understand the impact of inflation, mastering the calculation and interpretation of percent increase is a cornerstone of financial literacy. This guide will demystify the process, offering a clear, professional, and engaging roadmap to confidently figure percent increase in any financial scenario.

Understanding the Fundamentals of Percent Increase in Finance
At its core, percent increase measures the relative change between two values over time, expressed as a percentage of the initial value. It provides a standardized way to understand how much a quantity has grown, independent of the absolute magnitude of the numbers involved. This makes it an incredibly versatile tool across various financial applications.
What is Percent Increase?
Percent increase is a mathematical concept used to quantify the magnitude of growth or appreciation of a value over a period. It answers the question: “By what percentage has a value gone up?” Unlike absolute increase, which simply states the numerical difference (e.g., “it went up by $100”), percent increase provides context by relating that difference back to the starting point. For instance, a $100 increase on an initial value of $1,000 is a 10% increase, whereas a $100 increase on an initial value of $10,000 is only a 1% increase. This distinction is crucial for making informed financial comparisons and decisions. Without understanding the base from which growth originates, the raw numbers can be misleading.
Why It Matters in Financial Contexts
The significance of percent increase in financial contexts cannot be overstated. It serves as a universal language for performance evaluation and comparison.
- Investment Performance: Investors frequently use percent increase to gauge the return on investment (ROI) for stocks, bonds, mutual funds, and other assets. A stock that rose from $50 to $60 experienced a 20% increase, while another rising from $100 to $110 only had a 10% increase, making the former a better performer in terms of percentage growth.
- Business Growth Analysis: Businesses track percent increase in revenue, profit margins, customer acquisition, and market share to understand their trajectory and identify areas of success or concern. A 15% year-over-year revenue increase is a strong indicator of expansion and operational effectiveness.
- Personal Finance Planning: Individuals use it to track the growth of their savings accounts, the increase in their salary over time, or the appreciation of real estate assets. Understanding the percent increase in your income versus the percent increase in your expenses can highlight your financial health.
- Economic Indicators: Economists and policymakers rely on percent increase to measure inflation (the percentage increase in the general price level of goods and services), GDP growth (the percentage increase in a country’s total economic output), and unemployment rate changes. These figures inform economic policy and market expectations.
In essence, percent increase transforms raw data into meaningful insights, enabling better decision-making for individuals, businesses, and governments alike.
The Core Formula for Calculating Percent Increase
The process of calculating percent increase is straightforward, relying on a simple yet powerful formula. Mastering this formula is the first step towards confidently analyzing financial data.
Breaking Down the Formula
The fundamental formula for calculating percent increase is:
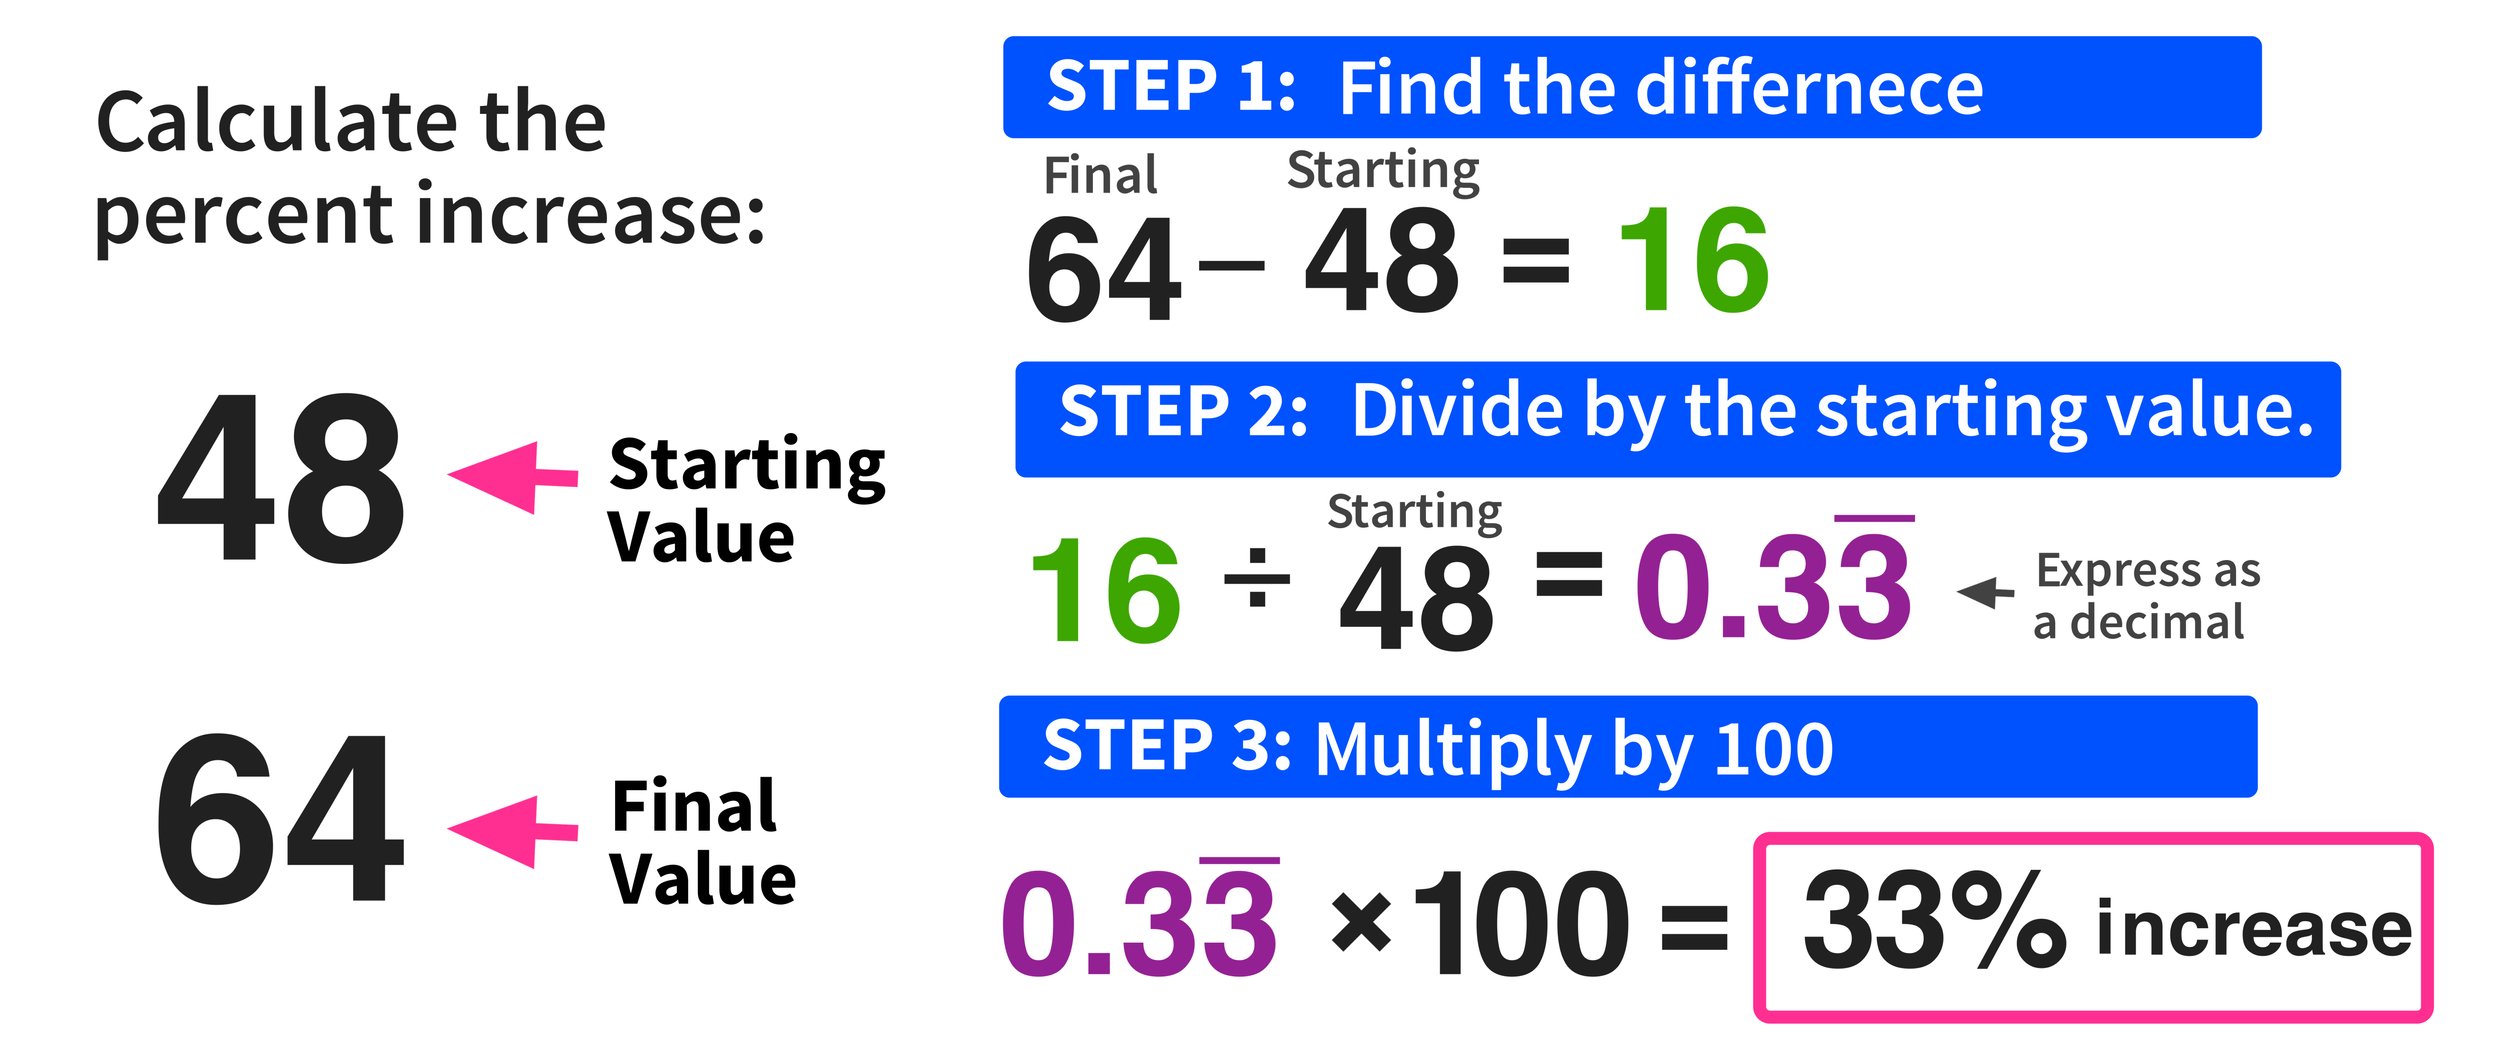
Percent Increase = ((New Value – Original Value) / Original Value) * 100
Let’s dissect each component:
- Original Value (or Starting Value): This is the baseline number, the initial point from which the change is measured. In financial terms, it could be your initial investment, last year’s revenue, or your previous salary.
- New Value (or Ending Value): This is the subsequent number, the value after the change has occurred. This might be your current investment value, this year’s revenue, or your new salary.
- Difference (New Value – Original Value): This first step calculates the absolute amount of change. If the new value is greater than the original value, this difference will be positive, indicating an increase.
- Division by Original Value: By dividing the difference by the original value, we determine the proportion of the increase relative to the starting point. This result is a decimal.
- Multiplication by 100: Finally, multiplying the decimal by 100 converts it into a percentage, making it easier to understand and compare.
Step-by-Step Calculation Guide
Let’s walk through an example to solidify the process.
Scenario: You invested $5,000 in a mutual fund last year. Today, its value is $5,750. What is the percent increase in your investment?
Step 1: Identify the Original Value and New Value.
- Original Value = $5,000
- New Value = $5,750
Step 2: Calculate the Absolute Increase (Difference).
- Difference = New Value – Original Value
- Difference = $5,750 – $5,000 = $750
Step 3: Divide the Absolute Increase by the Original Value.
- Fractional Increase = Difference / Original Value
- Fractional Increase = $750 / $5,000 = 0.15
Step 4: Multiply by 100 to Express as a Percentage.
- Percent Increase = Fractional Increase * 100
- Percent Increase = 0.15 * 100 = 15%
Therefore, your investment experienced a 15% increase. This systematic approach ensures accuracy and clarity in your financial calculations.
Practical Applications and Real-World Examples in Finance
The utility of percent increase extends across a multitude of financial scenarios, offering clarity and context to raw numbers. Applying this formula helps in evaluating performance, making projections, and understanding market dynamics.
Investment Growth
One of the most common applications of percent increase is in assessing investment returns.
- Stock Portfolio Performance: Imagine your stock portfolio was worth $25,000 at the beginning of the year and grew to $28,750 by year-end.
- Percent Increase = (($28,750 – $25,000) / $25,000) * 100
- Percent Increase = ($3,750 / $25,000) * 100 = 0.15 * 100 = 15%
This tells you your portfolio generated a 15% return, allowing you to compare its performance against benchmarks or other investment options.
- Real Estate Appreciation: A property purchased for $300,000 increases in value to $360,000 over five years.
- Percent Increase = (($360,000 – $300,000) / $300,000) * 100
- Percent Increase = ($60,000 / $300,000) * 100 = 0.20 * 100 = 20%
This signifies a 20% appreciation, a vital metric for real estate investors.
Business Metrics
Businesses heavily rely on percent increase to track their health and growth.
- Revenue Growth: A company’s revenue increased from $1,000,000 last quarter to $1,150,000 this quarter.
- Percent Increase = (($1,150,000 – $1,000,000) / $1,000,000) * 100
- Percent Increase = ($150,000 / $1,000,000) * 100 = 0.15 * 100 = 15%
A 15% quarterly revenue growth is a strong indicator of market traction and operational success.
- Profit Margin Improvement: If a company’s profit margin went from 10% to 12%, this isn’t a 2% increase in the margin itself. Instead, it’s a percent increase of the margin.
- Percent Increase = ((12% – 10%) / 10%) * 100
- Percent Increase = (2% / 10%) * 100 = 0.20 * 100 = 20%
This reveals a 20% improvement in the efficiency of generating profit relative to the previous margin.
Personal Finance Scenarios
Individuals constantly encounter situations where percent increase is useful.
- Salary Raises: Your annual salary increases from $60,000 to $63,000.
- Percent Increase = (($63,000 – $60,000) / $60,000) * 100
- Percent Increase = ($3,000 / $60,000) * 100 = 0.05 * 100 = 5%
This 5% raise allows you to understand the actual growth of your purchasing power relative to your previous income.
- Savings Account Growth: Your savings account balance grows from $10,000 to $10,250 over a year due to interest.
- Percent Increase = (($10,250 – $10,000) / $10,000) * 100
- Percent Increase = ($250 / $10,000) * 100 = 0.025 * 100 = 2.5%
This 2.5% increase is your effective annual interest rate.
Economic Indicators
On a macroeconomic level, percent increase provides insights into broader economic health.
- Inflation Rates: If the Consumer Price Index (CPI) increases from 120 points to 123.6 points over a year, the inflation rate is:
- Percent Increase = ((123.6 – 120) / 120) * 100
- Percent Increase = (3.6 / 120) * 100 = 0.03 * 100 = 3%
This indicates a 3% inflation rate, meaning prices generally rose by 3%.
- GDP Growth: A country’s Gross Domestic Product (GDP) grows from $20 trillion to $20.6 trillion in a quarter.
- Percent Increase = (($20.6 trillion – $20 trillion) / $20 trillion) * 100
- Percent Increase = ($0.6 trillion / $20 trillion) * 100 = 0.03 * 100 = 3%
This 3% GDP growth signals economic expansion.
These examples underscore the versatility and critical importance of percent increase in making sense of financial data across all scales.
Common Pitfalls and Nuances in Interpretation
While the formula for percent increase is straightforward, its interpretation requires careful consideration. Misunderstanding the context or ignoring certain nuances can lead to flawed conclusions and poor financial decisions.
The Base Value Matters
One of the most significant pitfalls is neglecting the impact of the original, or base, value. A large percent increase can seem impressive, but if it’s based on a very small initial number, the absolute increase might still be negligible. Conversely, a small percentage increase on a massive base can represent a substantial absolute change.
- Example: A startup’s revenue grows from $1,000 to $2,000. This is a 100% increase. While numerically impressive, the absolute increase is only $1,000. A Fortune 500 company’s revenue grows from $1 billion to $1.01 billion. This is only a 1% increase, but the absolute increase is $10 million.
- Insight: Always consider both the percentage change and the absolute numerical change, especially when comparing entities of different sizes. A high percentage growth from a small base is often easier to achieve than even modest percentage growth from a very large base.
Beware of Compounding
When dealing with growth over multiple periods, it’s crucial to distinguish between simple and compound growth. Simple percent increase measures change from one point to another. Compounding refers to the process where an asset’s earnings, from either capital gains or interest, are reinvested to generate additional earnings over time.
- Simple Increase: If your investment grows 10% in Year 1 and then another 10% in Year 2, it’s not simply a 20% overall increase if the base for the second 10% calculation is the increased value from Year 1.
- Compound Annual Growth Rate (CAGR): For multi-period growth, the Compound Annual Growth Rate (CAGR) is often more appropriate. It provides a smoothed, annualized rate of return, assuming growth was compounded over the period. Using a simple percent increase over multiple years ignores the power of compounding and can underestimate actual returns.
- Insight: For long-term financial planning and investment analysis, understand if the stated growth rate is simple or compounded. Compounding is key to wealth accumulation.
Context is King
Numbers rarely speak for themselves; they require context. The “why” and “how” behind a percent increase are as important as the percentage itself.
- Timeframes: A 20% increase over one month is incredibly impressive, but a 20% increase over ten years might be underwhelming, especially if inflation outpaced it. Always consider the duration over which the change occurred.
- Inflation: When assessing investment returns or salary increases, consider the inflation rate during the same period. A 5% salary increase looks good until you realize inflation was 4%, meaning your real purchasing power only increased by 1%. Financial figures should often be analyzed in “real” (inflation-adjusted) terms.
- External Factors: Was the revenue increase due to genuine market demand, or a one-time acquisition? Was the investment gain due to shrewd decisions, or a broad market bull run? Understanding the underlying drivers provides deeper insight.
- Insight: Always ask what factors contributed to the increase and how sustainable they are. A comprehensive financial analysis goes beyond just calculating the percentage; it delves into the narrative behind the numbers.
By being mindful of these nuances, individuals and businesses can move beyond superficial interpretations of percent increase and gain a truly insightful understanding of financial performance and trends.
Leveraging Tools and Technology for Financial Analysis
While understanding the manual calculation is fundamental, modern financial analysis often benefits from leveraging readily available tools and technology. These resources not only speed up calculations but also facilitate complex data management and visualization, enhancing the depth of financial insight.
Spreadsheet Software (Excel, Google Sheets)
For most personal finance and small to medium business applications, spreadsheet software like Microsoft Excel or Google Sheets is indispensable. They offer robust capabilities for calculating percent increase, managing financial data, and creating dynamic models.
- Simple Calculation: To calculate percent increase in a spreadsheet, you would typically use a formula similar to
=(New_Value - Original_Value) / Original_Value. For example, if your original value is in cell A2 and your new value is in B2, the formula would be=(B2-A2)/A2. Remember to format the result cell as a percentage to display it correctly (e.g.,15%instead of0.15). - Batch Processing: Spreadsheets excel when you need to calculate percent increase for multiple items or over several periods. You can enter your formula once and then “drag” it down to apply it to hundreds or thousands of rows of data instantly. This is invaluable for analyzing large datasets like monthly sales figures or quarterly stock performance across an entire portfolio.
- Scenario Analysis: You can easily adjust original or new values to see how different scenarios impact the percent increase. For instance, projecting different growth rates for a business plan.
- Visualizations: Beyond raw numbers, spreadsheets allow you to create charts and graphs (line charts, bar charts) that visually represent percent increases over time, making trends and performance immediately apparent and easier to communicate.
Online Calculators and Financial Apps
For quick, one-off calculations or for individuals who prefer a simplified interface, a myriad of online calculators and financial apps are available.
- Dedicated Percent Increase Calculators: A simple web search will reveal numerous free online tools where you just input the original and new values, and it instantly provides the percent increase. These are excellent for checking a single figure without opening a spreadsheet.
- Banking and Investment Apps: Many modern banking and investment platforms incorporate features that automatically display percent increase for your account balances, investment returns, or specific asset performance. This provides real-time insights without any manual calculation.
- Budgeting Apps: Personal finance apps often track your spending categories and can show you the percent increase or decrease in your monthly expenditure on groceries, entertainment, or utilities, helping you manage your budget more effectively.
- Accessibility: These tools are often mobile-friendly, allowing you to perform calculations and review financial performance on the go.
Programming Languages for Data Analysis (Python for Advanced Users)
For professionals dealing with very large datasets, complex financial modeling, or automated reporting, programming languages like Python (with libraries like Pandas and NumPy) offer the ultimate flexibility and power.
- Advanced Analytics: Python allows for sophisticated data manipulation, statistical analysis, and machine learning models that can go beyond simple percent increase to uncover deeper trends, correlations, and predictive insights.
- Automation: Scripts can be written to automatically pull financial data from various sources (APIs, databases), calculate percent increases for desired metrics, generate reports, and even send alerts – all without manual intervention.
- Customization: Programmatic solutions provide complete control over the calculation logic, allowing for highly customized analyses that might not be possible with standard spreadsheet functions.
- Scalability: For enterprises managing vast quantities of financial data, Python can handle the scale and complexity efficiently, making it a preferred tool for data scientists and financial analysts in larger organizations.
While spreadsheet software is sufficient for most users, knowing the breadth of available tools ensures you can choose the most appropriate method for your specific financial analysis needs, ranging from a quick check to in-depth, automated reporting.

Conclusion
The ability to figure percent increase is more than just a mathematical skill; it’s a fundamental pillar of financial literacy. From tracking personal savings and analyzing investment returns to assessing business growth and interpreting economic indicators, this simple formula provides invaluable context and clarity. We’ve explored its core definition, walked through its step-by-step calculation, delved into its diverse applications across various financial domains, and highlighted crucial nuances to avoid misinterpretation. Furthermore, we’ve touched upon the technological tools, from ubiquitous spreadsheets to advanced programming languages, that empower us to leverage this metric efficiently.
In an increasingly data-driven world, where financial decisions demand precision and insight, mastering percent increase equips you to make more informed choices, identify trends, and accurately measure progress. By consistently applying this concept, you move beyond merely observing numbers to truly understanding the dynamics of financial change, fostering greater confidence and control over your financial future. Embrace this powerful tool, and let it illuminate your path to financial understanding and success.
aViewFromTheCave is a participant in the Amazon Services LLC Associates Program, an affiliate advertising program designed to provide a means for sites to earn advertising fees by advertising and linking to Amazon.com. Amazon, the Amazon logo, AmazonSupply, and the AmazonSupply logo are trademarks of Amazon.com, Inc. or its affiliates. As an Amazon Associate we earn affiliate commissions from qualifying purchases.