
Understanding how to calculate the annual rate of return is a cornerstone of sound financial management and successful investing. Whether you’re a seasoned investor evaluating a complex portfolio or a beginner trying to grasp the performance of your first savings account, the ability to accurately measure your investment’s growth is indispensable. It’s not just about knowing if your money is growing; it’s about understanding how fast it’s growing, how efficiently, and how it compares to other opportunities or benchmarks. This article will demystify the process, exploring various methods for calculating the annual rate of return, their applications, and critical factors to consider, empowering you to make more informed financial decisions.
Understanding the Fundamentals of Investment Performance
Before delving into the calculations, it’s crucial to establish a foundational understanding of what we’re measuring and why it matters. The annual rate of return provides a standardized metric to assess an investment’s profitability over a one-year period.
What is Annual Rate of Return (ARR)?
The Annual Rate of Return (ARR), often simply referred to as “return,” is the percentage of profit or loss generated by an investment over a 12-month period. It accounts for both capital appreciation (the increase in the investment’s value) and any income generated, such as dividends or interest. Essentially, it tells you how much your investment has grown or shrunk relative to its initial value, expressed as an annualized percentage. This standardization allows for apples-to-apples comparisons between different investments, regardless of their initial cost or duration.
Key Components of Investment Returns
Investment returns aren’t always straightforward capital gains. They typically comprise several elements:
- Capital Appreciation: This is the increase in the market value of an investment. For instance, if you buy a stock for $100 and it later sells for $110, you’ve realized $10 in capital appreciation.
- Dividends: These are portions of a company’s earnings paid out to shareholders, typically in cash. Dividends are a common source of return for stock investors.
- Interest: This is the income earned from debt instruments like bonds, savings accounts, or certificates of deposit (CDs). Interest is usually paid periodically based on a fixed rate.
- Rent/Rental Income: For real estate investments, rental income is a significant component of the overall return.
A comprehensive calculation of ARR must incorporate all these income streams to provide a true picture of an investment’s performance. Ignoring any component would lead to an underestimation of the actual return generated.
Why Calculate Annual Rate of Return?
The importance of calculating ARR extends beyond mere curiosity. It serves several vital functions:
- Performance Measurement: It’s the primary tool for assessing how well your investments are performing against your financial goals. Is your portfolio on track to meet your retirement targets or save for a down payment?
- Comparison and Benchmarking: ARR allows you to compare the performance of different investment opportunities (e.g., comparing a stock fund to a real estate investment). It also enables benchmarking your investments against market indices (like the S&P 500) to gauge whether you’re outperforming or underperforming the broader market.
- Future Financial Planning: Understanding past returns helps in projecting future growth and planning for significant life events, such as retirement, college funding, or major purchases. It provides a realistic basis for setting future financial goals.
- Risk Assessment: Higher returns often come with higher risk. By analyzing ARR alongside volatility, investors can gain insight into the risk-reward profile of their investments.
Core Methods for Calculating Annual Rate of Return
There isn’t a single “one-size-fits-all” formula for annual rate of return. The most appropriate method depends on the investment’s characteristics, especially whether there have been additional contributions or withdrawals during the period.
Simple Rate of Return
The simplest method to calculate return is often used for investments where no additional cash flows (contributions or withdrawals) have occurred during the period, or for single-period returns.
Formula:
Simple Rate of Return = [(Ending Value - Beginning Value) + Income] / Beginning Value
- Ending Value: The market value of the investment at the end of the period.
- Beginning Value: The market value of the investment at the start of the period.
- Income: Any cash distributions received during the period (e.g., dividends, interest).
Example: You buy a stock for $1,000. After one year, it’s worth $1,100, and you received $20 in dividends.
Simple Rate of Return = [($1,100 - $1,000) + $20] / $1,000 = ($100 + $20) / $1,000 = $120 / $1,000 = 0.12 or 12%
Limitations: This method is best for short, single periods without intervening cash flows. It doesn’t accurately reflect annualized returns for periods longer than a year, nor does it account for the timing of cash flows.
Compound Annual Growth Rate (CAGR)
CAGR is a powerful tool for calculating the annualized return of an investment over multiple periods, assuming that all profits are reinvested. It smooths out year-to-year volatility to show a steady, hypothetical rate of growth.
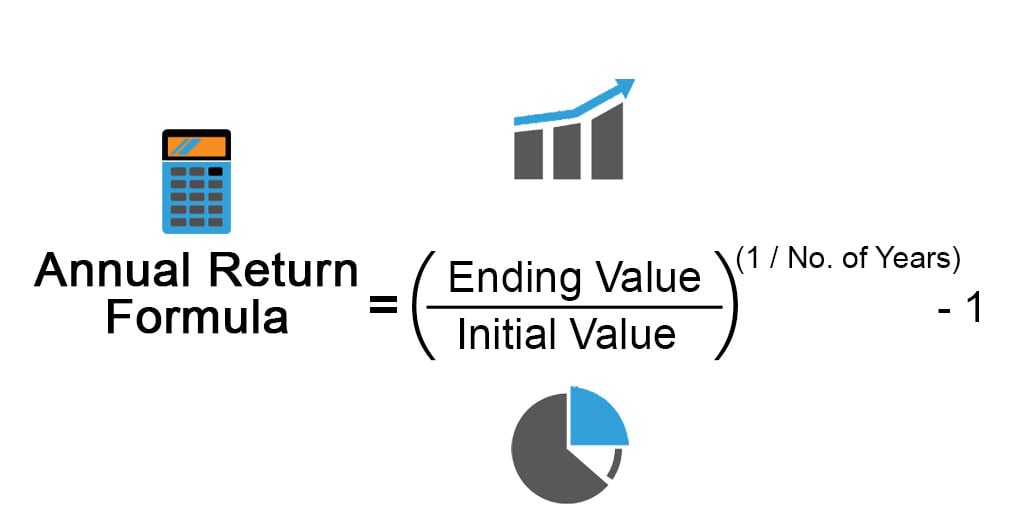
Formula:
CAGR = [(Ending Value / Beginning Value)^(1 / Number of Years)] - 1
- Ending Value: The total value of the investment at the end of the period.
- Beginning Value: The total value of the investment at the start of the period.
- Number of Years: The total duration of the investment.
Example: An investment grew from $5,000 to $8,000 over five years.
CAGR = [($8,000 / $5,000)^(1 / 5)] - 1
CAGR = [(1.6)^(0.2)] - 1
CAGR = 1.0985 - 1 = 0.0985 or 9.85%
Advantages: CAGR provides a more accurate picture of an investment’s average annual growth over longer periods, assuming consistent growth. It’s particularly useful for comparing the growth rates of different investments over the same time horizon.
Limitations: CAGR assumes reinvestment of all returns and does not account for additional contributions or withdrawals made during the investment period, which can significantly skew the results if such cash flows occurred.
Time-Weighted Rate of Return (TWRR)
The Time-Weighted Rate of Return is preferred by investment professionals and fund managers because it neutralizes the impact of cash inflows and outflows (deposits and withdrawals) on the return calculation. This makes it ideal for comparing the performance of different money managers or funds, as it reflects the performance of the underlying assets independent of the timing of investor contributions.
Concept: TWRR works by breaking the investment period into sub-periods, each defined by a cash flow event (deposit or withdrawal). The return for each sub-period is calculated, and these returns are then geometrically linked (compounded) together to arrive at the overall time-weighted return.

Advantages:
- Eliminates the influence of external cash flows, focusing purely on the manager’s skill in investing the capital.
- Standard industry practice for mutual funds and institutional portfolios.
Limitations: Complex to calculate manually, especially with frequent cash flows.
Money-Weighted Rate of Return (MWRR)
Also known as the Internal Rate of Return (IRR) for an investment, the Money-Weighted Rate of Return considers the size and timing of all cash flows (contributions and withdrawals) made by the investor. It calculates the specific rate of return an individual investor earned on their actual capital, making it highly personalized.
Concept: MWRR is the discount rate that makes the present value of all cash inflows equal to the present value of all cash outflows, including the initial investment and the final value. It’s essentially solving for ‘r’ in a complex present value equation.
Advantages:
- Reflects the actual return an investor experienced, taking into account their personal investment decisions.
- Useful for individual investors assessing the profitability of their own specific investment journey.
Limitations: Can be heavily influenced by the timing of large cash flows. A well-timed large deposit before a period of strong performance can significantly boost MWRR, even if the underlying asset performance wasn’t consistently stellar. Similarly, a poorly timed withdrawal can depress it.
Practical Application and Choosing the Right Method
Selecting the appropriate rate of return calculation method is crucial for accurate financial analysis. The context of your investment and your objectives will dictate which formula to use.
When to Use Simple vs. CAGR
- Simple Rate of Return is best for:
- Single-period investments (e.g., assessing a stock’s performance over one specific year).
- Quick, back-of-the-envelope calculations when precision over multiple periods isn’t critical.
- Investments without any intermediate cash flows.
- Compound Annual Growth Rate (CAGR) is ideal for:
- Long-term investments where you want to understand the average annual growth rate assuming reinvestment.
- Comparing the growth of different investments or companies over the exact same multi-year period, assuming no additional contributions or withdrawals were made.
- Projecting future growth based on historical average performance.
Navigating Multiple Cash Flows: TWRR vs. MWRR
When your investment account has regular deposits or withdrawals (common in retirement accounts or brokerage accounts), the choice between TWRR and MWRR becomes paramount:
- Use TWRR when you want to evaluate the performance of the investment itself or the skill of an investment manager. It removes your timing decisions from the equation, providing an unbiased view of how the underlying assets performed. This is the standard for mutual fund performance reporting.
- Use MWRR when you want to understand the return on your personal capital. If you made significant contributions during periods of high growth, your MWRR might be higher than the TWRR. Conversely, if you contributed heavily before a market downturn, your MWRR might be lower. It’s about your personal journey with that specific investment.
Real-World Scenarios and Examples
Let’s consider a few scenarios to illustrate:
- Your Personal Brokerage Account: You regularly deposit money into your brokerage account and sometimes withdraw funds. To see how your personal investment strategy (including the timing of your contributions) has performed, MWRR is the most relevant. To see how the funds you chose performed regardless of your cash flow timing, look at the TWRR reported by the fund itself.
- A Managed Portfolio: If you have an investment advisor managing your portfolio, they will typically report TWRR to show their performance independent of your personal deposits or withdrawals. This allows you to compare their skill against other managers or benchmarks.
- Real Estate Investment: You bought a rental property, made some improvements, collected rent, and eventually sold it. MWRR (IRR) would be excellent for calculating your overall return, accounting for the initial purchase, improvement costs (outflows), rental income (inflows), and final sale price.
- Individual Stock Purchase: If you bought a single stock and held it for three years without buying more shares or selling any, and it paid dividends you reinvested, CAGR would be suitable for calculating its average annual growth.
Beyond the Basics: Factors Influencing Your Net Return
Calculating the raw annual rate of return is just the first step. To understand the true impact on your wealth, you must consider other critical factors that diminish or enhance your net gain.
The Impact of Fees and Taxes
- Investment Fees: Management fees, trading commissions, expense ratios in mutual funds, and advisory fees all eat into your returns. A seemingly small 1% annual fee can significantly reduce your wealth over decades due to the power of compounding. Always calculate your return net of fees.
- Taxes: Capital gains taxes, dividend taxes, and interest income taxes reduce your actual take-home return. The tax treatment varies based on the type of investment, how long you held it, and your income bracket. Understanding these implications is crucial for optimizing your tax strategy and truly knowing your after-tax return. Tax-advantaged accounts (like 401(k)s and IRAs) can defer or eliminate some of these tax burdens.
Inflation’s Erosion of Purchasing Power
A 10% annual return sounds great, but if inflation was 3% that year, your real return (the increase in your purchasing power) is closer to 7%. Inflation diminishes the value of money over time.
- Nominal Return: The stated return without accounting for inflation.
- Real Return: The nominal return adjusted for inflation.
Real Return ≈ Nominal Return - Inflation Rate(for rough estimates)
A more precise formula is:(1 + Nominal Return) / (1 + Inflation Rate) - 1.
It’s important to aim for investments that consistently generate a real return above zero to grow your purchasing power.
Risk and Return Relationship
While not a direct calculation, understanding the relationship between risk and return is fundamental to evaluating any investment’s ARR. Generally, investments with higher potential returns also carry higher risk (i.e., greater volatility and potential for loss).
- Volatility: How much an investment’s value fluctuates. An investment with a 10% average annual return but wild swings may be riskier than one with an 8% average return but stable growth.
- Risk Tolerance: Your personal capacity and willingness to take on investment risk.
Evaluating ARR in isolation without considering the associated risk is incomplete. A high return is only meaningful if it was achieved within an acceptable level of risk for your personal financial situation.
Tools and Resources for Calculating ARR
While manual calculations provide a deep understanding, practical tools can simplify the process, especially for complex scenarios.
Spreadsheet Software (Excel, Google Sheets)
Spreadsheets are incredibly versatile for calculating various rates of return.
- Simple Return: Easy to set up with basic arithmetic.
- CAGR: Utilizes the POWER function.
- MWRR (IRR): Excel and Google Sheets have an
XIRRfunction (Extended Internal Rate of Return) that can handle irregular cash flows with specific dates, making it very powerful for MWRR calculations. You simply list your cash flows (initial investment as negative, subsequent deposits as negative, withdrawals as positive, and final value as positive) and their dates.
Online Calculators
Numerous financial websites offer free online calculators for CAGR, simple return, and even some basic IRR calculations. These are convenient for quick estimates and don’t require advanced spreadsheet skills. Just search for “CAGR calculator” or “investment return calculator.”
Financial Advisors and Software
For sophisticated portfolios, complex cash flow patterns, or if you prefer professional guidance, financial advisors utilize specialized software that can accurately calculate various rates of return, including TWRR and MWRR, and provide comprehensive performance analysis. Investment platforms and brokerage firms often provide performance reports that already include these calculated returns for your accounts.

Conclusion
Calculating the annual rate of return is far more than an academic exercise; it’s an essential skill for anyone looking to build and manage wealth effectively. By understanding the nuances between simple return, CAGR, TWRR, and MWRR, you gain the clarity needed to accurately assess your investments, compare opportunities, and measure the success of your financial strategies. Remember to always consider the eroding effects of fees, taxes, and inflation to arrive at your true, net return. Armed with this knowledge and the right tools, you can confidently navigate the financial landscape, making informed decisions that propel you closer to your long-term financial aspirations. Taking control of your financial education, starting with mastering the annual rate of return, is arguably the most valuable investment you can ever make.
aViewFromTheCave is a participant in the Amazon Services LLC Associates Program, an affiliate advertising program designed to provide a means for sites to earn advertising fees by advertising and linking to Amazon.com. Amazon, the Amazon logo, AmazonSupply, and the AmazonSupply logo are trademarks of Amazon.com, Inc. or its affiliates. As an Amazon Associate we earn affiliate commissions from qualifying purchases.