The sprawling geography of Los Angeles is legendary. With over 469 square miles encompassing a patchwork of neighborhoods, council districts, zip codes, and service zones, the question of “What district am I in?” is more than just a matter of curiosity—it is a data-driven challenge. For residents, business owners, and developers, navigating the administrative boundaries of the City of Angels requires more than a physical map; it requires a sophisticated suite of Civic Tech tools.
In the modern digital landscape, Los Angeles has become a hub for Geographic Information Systems (GIS) and open-data initiatives. The technology behind district identification has evolved from static PDF maps to real-time, API-driven platforms that provide instantaneous results. This article explores the technological infrastructure that powers Los Angeles’s administrative mapping, the software tools available to the public, and how emerging tech is shaping the future of urban navigation.
The Evolution of Civic Tech: Mapping the Complexity of Los Angeles
To understand how technology identifies your district, one must first understand the backend: Geographic Information Systems (GIS). GIS is a framework for gathering, managing, and analyzing data. Rooted in the science of geography, GIS integrates many types of data. It analyzes spatial location and organizes layers of information into visualizations using maps and 3D scenes.
GIS and Public Data Integration
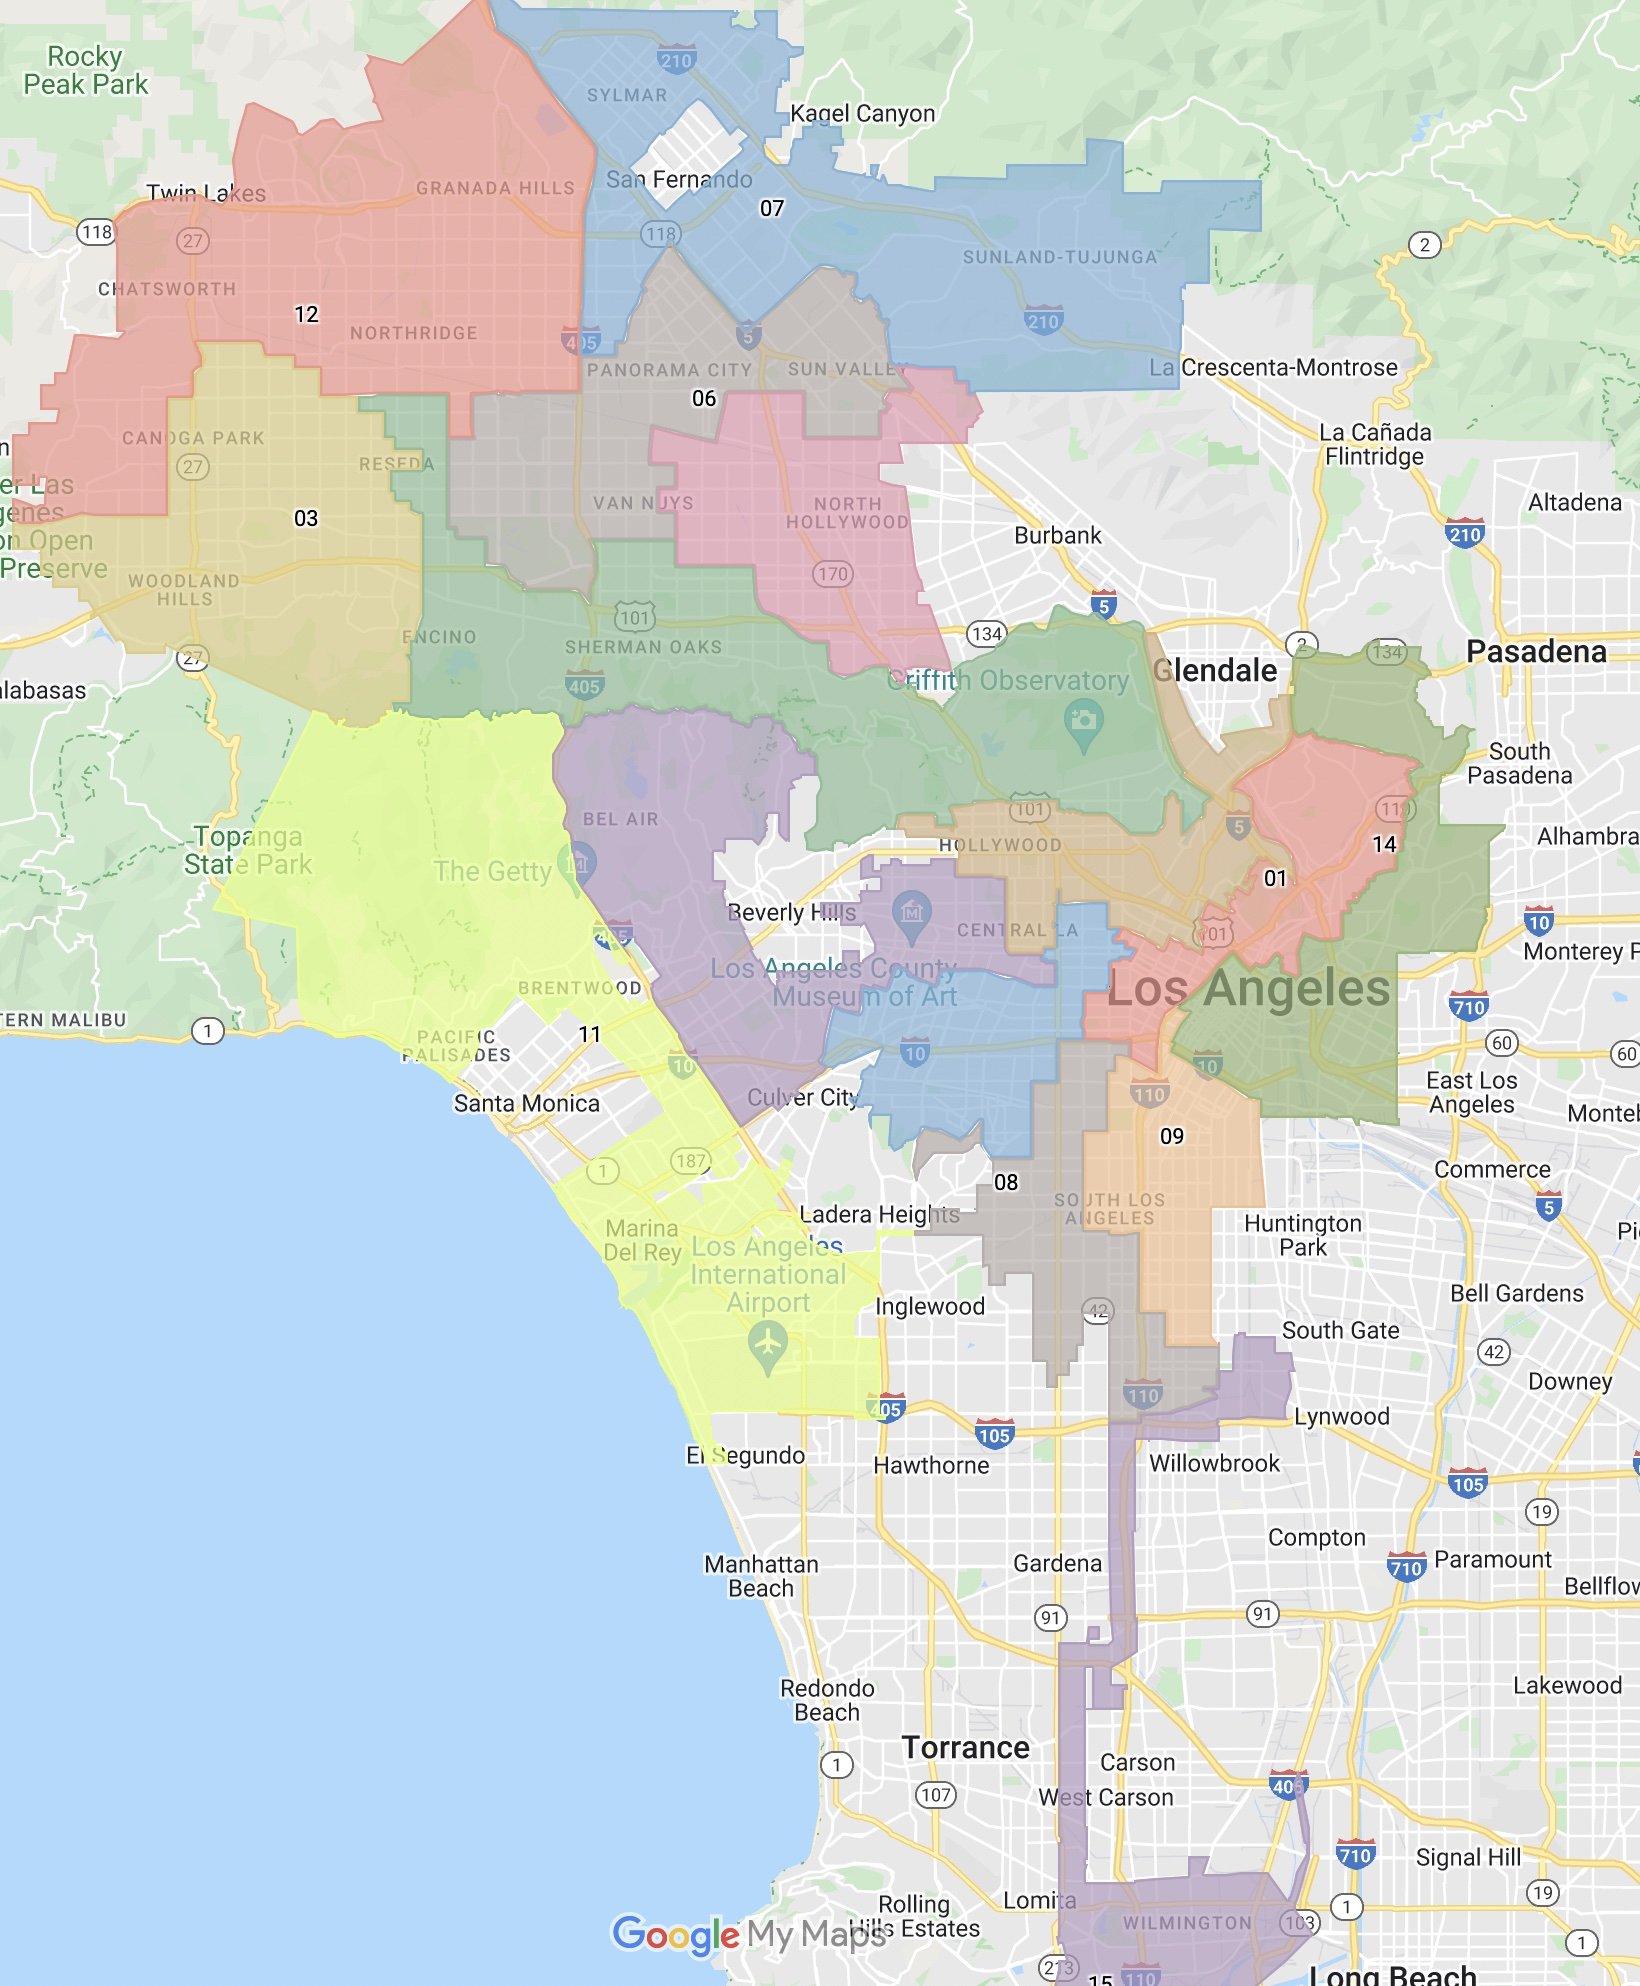
In Los Angeles, the Bureau of Engineering and the Information Technology Agency (ITA) maintain a massive repository of spatial data. Every “district”—whether it be one of the 15 City Council districts, the dozens of Neighborhood Councils, or the various County Board of Supervisors districts—is represented as a “polygon” in a database. These polygons are defined by precise longitudinal and latitudinal coordinates. When a user inputs an address into a search bar, the software performs a “point-in-polygon” analysis, instantly identifying which administrative boundaries contain that specific point.
The Transition from Paper Maps to Real-Time Geolocation
Decades ago, determining your district required a trip to City Hall or a library to consult physical zoning maps. This process was prone to human error and did not account for the frequent redistricting that occurs following a census. Today, the “MapLA” initiative and the city’s Open Data Portal have democratized this information. By utilizing cloud-based hosting, the city ensures that when boundaries change, the digital record is updated globally in milliseconds. This transition to “Live Maps” ensures that tech-savvy citizens always have access to the most current version of their civic identity.
Top Software and Web Apps for Los Angeles District Identification
For the average user asking “What district am I in?”, the interface is the most important component. Several high-level software tools and web applications have been developed to make this technical data accessible to the public.
Neighborhood Info: The Gateway to City Services
The “Neighborhood Info” tool is the primary web application provided by the City of Los Angeles. From a tech perspective, this tool is a masterclass in API integration. When a user enters an address, the application sends a request to multiple databases simultaneously. Within seconds, it returns a comprehensive profile of the location, including the City Council member, the nearest LAPD station, the specific trash collection day, and the local Neighborhood Council. This is achieved through a RESTful API architecture that pulls data from various departmental silos and presents it in a unified user interface (UI).
ZIMAS: The Ultimate Zoning and Mapping Tool
For those requiring deeper technical insights, the Zone Information and Map Access System (ZIMAS) is the gold standard. ZIMAS is a sophisticated web-based GIS application that provides detailed information about every property in the City of Los Angeles. Tech users can toggle different layers—such as “Planning and Zoning,” “Jurisdiction,” and “Environmental”—to see how different districts overlap. ZIMAS utilizes high-resolution aerial imagery and complex data overlays, allowing users to see not just which district they are in, but how that district’s specific tech-driven regulations (like digital signage or telecommunications infrastructure rules) apply to their lot.
Third-Party Civic Engagement Apps
Beyond official city software, the tech community has developed independent apps that utilize the city’s open-source data. Apps like “EmpowerLA” or various voter guide platforms use the city’s GeoJSON files to help residents connect with their local representatives. These third-party applications often focus on User Experience (UX), providing a more intuitive mobile-first approach than some legacy government websites.
The Role of AI and Machine Learning in Urban Boundaries

The query “What district am I in?” is increasingly being answered not just by databases, but by artificial intelligence. Los Angeles is at the forefront of using machine learning to optimize how these districts are drawn and how residents interact with them.
Predictive Analytics for Redistricting
Every ten years, district boundaries are redrawn based on census data. This process, known as redistricting, is now heavily augmented by algorithms. Software engineers use “automated redistricting” tools that can generate thousands of potential map configurations in seconds. These algorithms take into account population parity, the Voting Rights Act, and geographic compactness. By using AI to balance these variables, the city can ensure that districts are fair and representative, minimizing the risk of gerrymandering through transparent, data-driven modeling.
Natural Language Processing (NLP) in Civic Chatbots
The rise of Large Language Models (LLMs) and chatbots has changed how residents seek information. Instead of navigating a complex GIS map, a resident can now ask a chatbot, “What district am I in?” The backend of these bots uses Natural Language Processing (NLP) to parse the user’s intent, verify the address via a Geocoding API (like Google Maps or ArcGIS), and fetch the result from the city’s database. This “conversational UI” makes civic data accessible to those who may not be technically proficient with map-based software.
Mobile Tech and Geofencing: Staying Informed on the Go
With the ubiquity of smartphones, the answer to “What district am I in?” can now follow you as you move through the city. Mobile technology and geofencing are the new frontiers of civic engagement in Los Angeles.
GPS Integration in Local Government Apps
The “MyLA311” app is a prime example of mobile tech in action. By utilizing a smartphone’s built-in GPS, the app can automatically detect the user’s district without them having to type in an address. This “Location Services” integration allows for hyper-local reporting. If a resident sees a pothole or graffiti, the app uses the phone’s coordinates to assign the service request to the correct district maintenance crew automatically. This reduces administrative overhead and increases the speed of city services.
Geofencing and Location-Based Notifications
Geofencing tech allows the city to send targeted notifications to residents based on their district. For example, during local elections or emergency situations (like a brush fire in the hills), the city can “geofence” a specific council district. Any user with a registered app entering that boundary will receive a push notification. This technology transforms the “What district am I in?” question from a static search into a dynamic, proactive flow of information.
Cybersecurity and Privacy in Geolocation Services
As we rely more on technology to navigate our civic boundaries, the issues of cybersecurity and data privacy become paramount. Providing an address or allowing GPS access to find your district involves sharing sensitive PII (Personally Identifiable Information).
Data Protection for Civic Users
The City of Los Angeles employs rigorous cybersecurity protocols to protect the data of its residents. When using tools like Neighborhood Info or ZIMAS, the city uses encrypted HTTPS connections to ensure that address queries are not intercepted. Furthermore, many civic tech platforms are moving toward “differential privacy” models, where aggregate data is used for planning without compromising the specific identity or precise location of individual users.
The Future of Decentralized Identity and Location Verification
Looking forward, the tech industry is exploring blockchain and decentralized identifiers (DIDs) for civic use. In the future, your “district residency” could be verified through a secure, encrypted digital token on your smartphone. This would allow you to prove you live in a specific district—for the purpose of voting or accessing local services—without ever having to reveal your exact home address to a third-party application. This “privacy-by-design” approach is the next logical step in the evolution of Los Angeles’s civic tech ecosystem.

Conclusion: The Digital Map of the Future
In Los Angeles, the question “What district am I in?” is no longer a source of confusion but a gateway into a sophisticated digital ecosystem. Through the power of GIS, real-time APIs, mobile geofencing, and AI-driven analysis, the city has transformed geographical boundaries into actionable data.
As technology continues to advance, the line between the physical city and its digital twin will continue to blur. Residents will benefit from more intuitive interfaces, faster services, and a deeper connection to their local government—all powered by the underlying tech that maps the vast, vibrant landscape of Los Angeles. Whether you are a developer building the next great civic app or a resident simply looking to report a neighborhood issue, the tech infrastructure of LA is ready to provide the answers you need in the palm of your hand.
aViewFromTheCave is a participant in the Amazon Services LLC Associates Program, an affiliate advertising program designed to provide a means for sites to earn advertising fees by advertising and linking to Amazon.com. Amazon, the Amazon logo, AmazonSupply, and the AmazonSupply logo are trademarks of Amazon.com, Inc. or its affiliates. As an Amazon Associate we earn affiliate commissions from qualifying purchases.