In the world of finance, whether you are a retail investor, a corporate strategist, or a business owner, the ability to measure performance accurately is the difference between informed decision-making and guesswork. One of the most vital metrics used to assess the health and trajectory of an investment or a business over time is the Compound Annual Growth Rate, commonly known as CAGR.
While most people understand simple percentages, the reality of financial markets is that growth is rarely linear. Investments fluctuate, markets experience volatility, and business revenues ebb and flow. CAGR provides a way to “smooth out” these fluctuations, offering a single, steady rate of return that represents what an investment would have earned if it had grown at a steady rate each year on a compounded basis.

1. Understanding the Mechanics of CAGR
To understand CAGR, one must first understand the concept of compounding. Unlike simple interest, where growth is calculated only on the principal amount, compounding involves earning returns on your previous returns. CAGR is the geometric progression ratio that provides a constant rate of return over a specific time period.
The Mathematical Formula Decoded
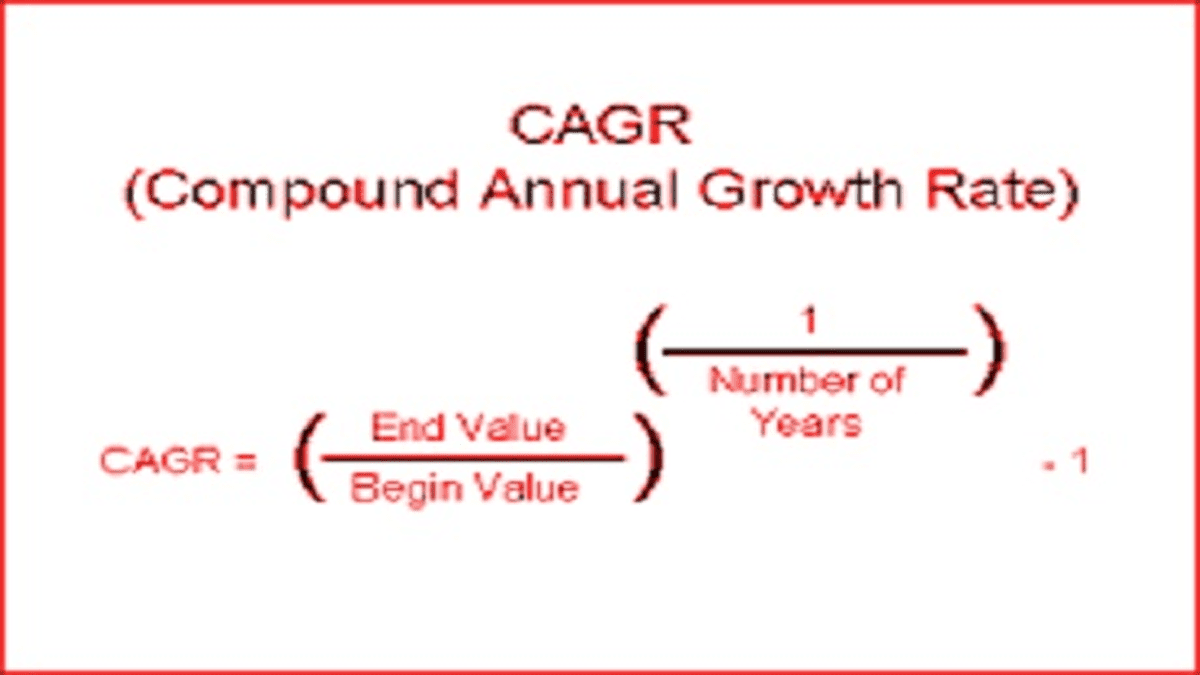
The formula for CAGR might seem intimidating at first glance, but it is logically structured to account for the time value of money. It is calculated as follows:
CAGR = [(Ending Value / Beginning Value)^(1 / Number of Years)] – 1
To put this into practice, imagine you invested $10,000 in a portfolio that grew to $15,000 over five years. The formula takes the total growth (the 50% absolute return), applies the root of the number of years (5), and subtracts one to express the result as a percentage. This tells you the annual rate at which your $10,000 would need to grow every year to reach $15,000 by year five.
Why “Compounding” is the Secret Ingredient
The “C” in CAGR stands for Compound, and it is the most critical element of the metric. In finance, compounding is often referred to as the “eighth wonder of the world.” When an investment grows, the gains from the first year are reinvested and become part of the base for the second year’s growth.
CAGR captures this reality. It assumes that all dividends or profits are reinvested back into the asset. This makes it a far more accurate reflection of long-term wealth accumulation than a simple average. A simple average of annual returns can often be misleading, especially when there are significant losses in one or more years.
The Difference Between Absolute Return and CAGR
It is common for novice investors to confuse absolute return with CAGR. Absolute return simply measures the total gain or loss from start to finish. If your investment goes from $100 to $200, your absolute return is 100%. However, if that growth took ten years, a 100% absolute return is much less impressive than if it took two years.
CAGR introduces the element of time. It tells you the efficiency of the investment. By calculating the CAGR, you can determine if that 100% return was actually a mediocre 7.2% annual growth over a decade or a stellar 41.4% annual growth over two years.
2. Why CAGR is the Gold Standard for Investors
In the “Money” niche, CAGR is widely regarded as the most reliable tool for comparing the performance of different asset classes. Because it normalizes returns over time, it allows for an “apples-to-apples” comparison between vastly different investments.
Comparing Performance Across Different Assets
An investor’s portfolio often contains a mix of assets: stocks, bonds, real estate, and perhaps even gold or cryptocurrencies. Each of these assets has different levels of volatility. For instance, a technology stock might grow 30% one year and drop 10% the next, while a government bond might consistently return 4% annually.
By using CAGR, the investor can strip away the “noise” of yearly volatility. If the stock’s CAGR over five years is 8% and the bond’s CAGR is 4%, the investor can clearly see that the stock outperformed the bond on a per-year basis, despite the scary 10% drop. This helps in making objective decisions about where to allocate capital.
Identifying Long-term Trends vs. Short-term Volatility
The financial markets are prone to cycles. There are bull markets where everything rises and bear markets where most things fall. If you only look at the performance of a mutual fund during a single stellar year, you might be tempted to invest all your savings into it.
However, looking at the 5-year or 10-year CAGR provides a reality check. It reveals whether the fund manager has a sustainable strategy or simply got lucky during a market upswing. A high CAGR over a long duration indicates a robust investment vehicle that has successfully weathered various economic climates.
Portfolio Rebalancing and Goal Setting
For personal finance enthusiasts, CAGR is an essential tool for retirement planning. If you know you need your retirement nest egg to grow from $500,000 to $1,000,000 over the next 12 years, you can work backward using the CAGR formula to find your “required rate of return.”
In this scenario, you would discover you need a CAGR of roughly 6%. This knowledge allows you to select an investment mix (stocks vs. bonds) that historically delivers that specific rate of growth. If your current portfolio is only yielding a 3% CAGR, you know you must either save more or adjust your risk profile.
3. The Limitations and Pitfalls of CAGR
While CAGR is a powerful diagnostic tool, it is not a magic wand. Relying solely on CAGR without understanding its limitations can lead to a skewed perception of risk and reward.
The Illusion of Linear Growth
The biggest danger of CAGR is that it implies a “smooth” journey. If an investment has a CAGR of 10%, the metric makes it look like the investment grew by exactly 10% every single year. In reality, that investment might have gained 50% in year one, lost 30% in year two, and stayed flat in year three.
This is why CAGR is often called a “pro forma” rate. It describes the end result, but it ignores the “sequence of returns.” For an investor who might need to withdraw money in year two (during the 30% drop), the 10% CAGR is irrelevant—they would have suffered a major loss. Investors must always look at standard deviation and volatility alongside CAGR to understand the “ride” they are signing up for.
Ignoring Periodic Cash Flows (IRR vs. CAGR)
CAGR assumes a “lump sum” investment. It calculates the growth from a single starting point to a single ending point. However, most people do not invest this way; they contribute monthly or quarterly to their accounts.
When you have multiple “ins and outs” of cash, CAGR becomes less accurate. In these cases, the Internal Rate of Return (IRR) or Money-Weighted Rate of Return is a better metric. CAGR is best suited for evaluating the performance of the underlying asset itself, whereas IRR is better for evaluating the investor’s specific performance including their timing of deposits and withdrawals.
The Sensitivity to Time Horizons
CAGR is highly sensitive to the dates chosen for the beginning and end of the period. This is a tactic often used in marketing. A fund manager might advertise a “20% CAGR over the last three years,” but they might be conveniently starting the calculation at the bottom of a market crash.
If you were to move the start date back just six months, the CAGR might drop to 10%. To get a true sense of growth, it is vital to look at rolling CAGR periods or ensure that the time frame selected is long enough to include at least one full market cycle.
4. Practical Applications in Business and Personal Finance
Beyond just looking at stock charts, CAGR is a fundamental metric used in corporate finance to measure business health and competitiveness.
Assessing Corporate Revenue Growth
For business owners and equity analysts, CAGR is the primary way to measure revenue or profit growth. If a company’s revenue grows from $1 million to $5 million over five years, the CAGR tells us how aggressively the company is scaling.
Venture capitalists often look for a high CAGR in a startup’s early years to justify high valuations. In a corporate setting, if a company’s expenses are growing at a CAGR of 15% while its revenue is only growing at a CAGR of 10%, the business is on an unsustainable path. CAGR allows management to spot these trends before they become existential threats.
Evaluating Mutual Funds and ETFs
When you read a “Fact Sheet” for a Mutual Fund or an Exchange Traded Fund (ETF), you will almost always see a table showing the 1-year, 3-year, 5-year, and 10-year returns. These are almost always CAGR figures.
By comparing the 10-year CAGR of an S&P 500 index fund (which historically hovers around 10%) with the 10-year CAGR of an actively managed fund, you can see if the manager is actually “beating the market.” If the active fund’s CAGR is 9% after fees, you are better off in the index fund. CAGR provides the clarity needed to cut through marketing jargon.
Using CAGR for Retirement and Savings Goals
On a personal level, CAGR helps in calculating the “Rule of 72,” a shorthand for seeing how long it takes to double your money. By dividing 72 by your CAGR, you can estimate the number of years required for your wealth to double.
For example, if you have a portfolio with an 8% CAGR, your money will double approximately every 9 years ($72 / 8 = 9$). This simple application of CAGR growth makes long-term financial planning accessible and tangible for the average saver, turning abstract numbers into a concrete timeline for financial independence.
Conclusion
The Compound Annual Growth Rate is more than just a mathematical formula; it is a lens through which we can view the chaotic world of finance with clarity. By smoothing out the volatility of the markets and accounting for the power of compounding, CAGR allows us to measure the true essence of growth.
However, as with any financial tool, it should not be used in isolation. While CAGR tells you the “how much” of your growth, it doesn’t tell you the “how hard” or the “how risky.” By combining CAGR with an understanding of market volatility and periodic cash flows, you can build a sophisticated framework for managing your money, evaluating investments, and ultimately achieving your long-term financial goals. Whether you are tracking the growth of a small business or a global stock portfolio, mastering CAGR is a fundamental step toward financial literacy and success.
aViewFromTheCave is a participant in the Amazon Services LLC Associates Program, an affiliate advertising program designed to provide a means for sites to earn advertising fees by advertising and linking to Amazon.com. Amazon, the Amazon logo, AmazonSupply, and the AmazonSupply logo are trademarks of Amazon.com, Inc. or its affiliates. As an Amazon Associate we earn affiliate commissions from qualifying purchases.