In the world of finance, data is the currency of decision-making. Whether you are a retail investor looking at stock market returns, a business owner analyzing quarterly sales, or an individual trying to optimize a household budget, the ability to interpret numbers is what separates success from stagnation. At the heart of this interpretation lies a fundamental statistical concept: central tendency.
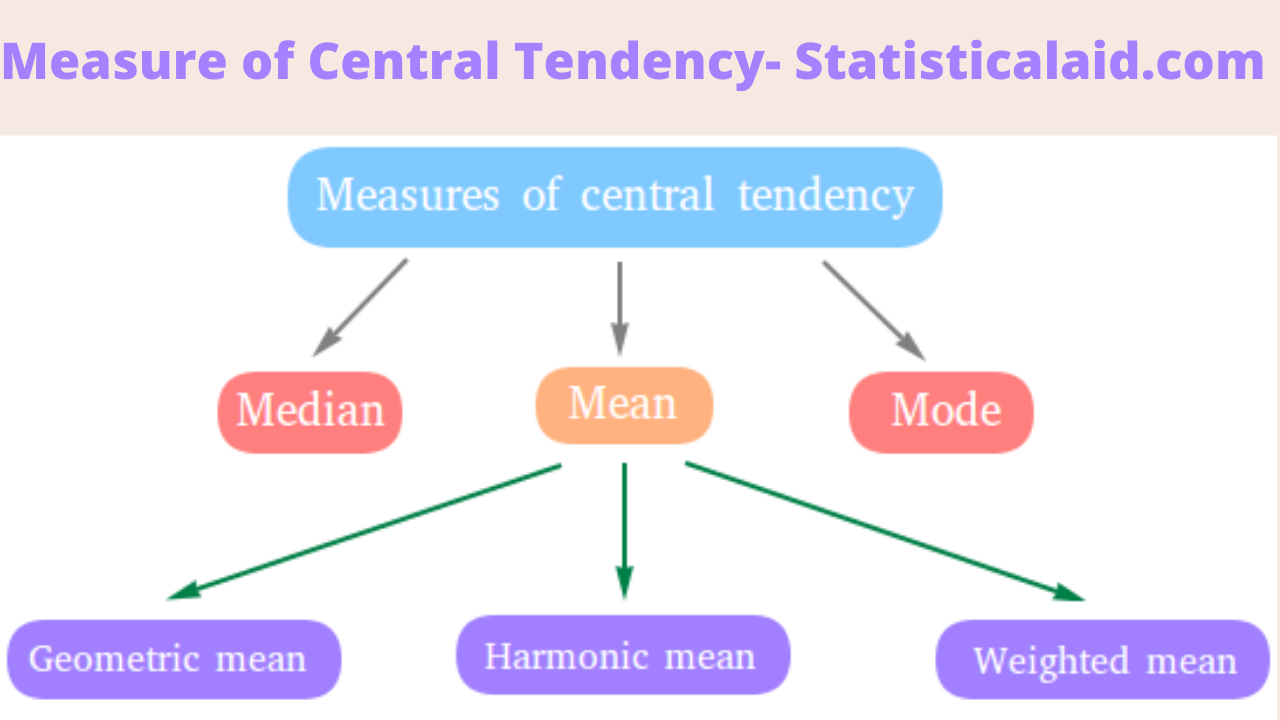
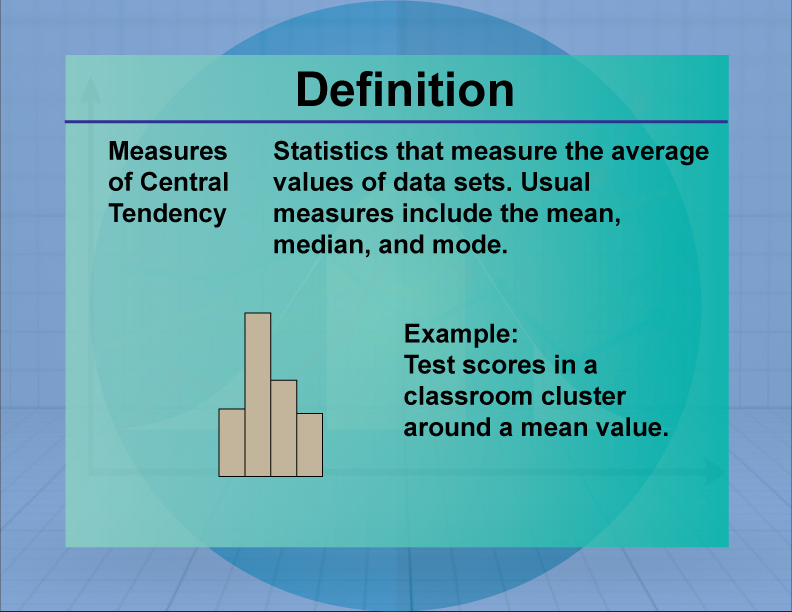
Central tendency is a descriptive summary of a dataset through a single value that reflects the center of the data distribution. In simpler terms, it provides a “typical” value for a group of numbers. In the niche of money and finance, understanding the three pillars of central tendency—the mean, the median, and the mode—is not just an academic exercise; it is a vital skill for identifying trends, assessing risks, and forecasting future wealth.
The Role of Central Tendency in Personal Finance and Budgeting
Personal finance is often viewed through the lens of individual transactions, but the “big picture” of your financial health is best understood through statistical averages. Central tendency helps individuals move beyond the noise of daily spending to see the actual trajectory of their wealth.
The Arithmetic Mean: Calculating Your Average Monthly Cash Flow
The mean, or the average, is calculated by adding all values in a dataset and dividing by the number of values. In personal finance, the mean is most commonly used to determine average monthly expenses. By calculating the mean of your spending over twelve months, you can create a realistic budget that accounts for both “heavy” spending months (like December holidays) and “light” months. This average provides a baseline for your “burn rate,” allowing you to determine how much of your income can be safely diverted into investments.
The Median: Why It Outperforms the Mean in Salary and Housing Comparisons
While the mean is popular, it is highly sensitive to “outliers”—extremely high or low values that can skew the results. This is why the median is the preferred measure of central tendency when discussing income or real estate. The median is the middle value when a dataset is ordered from least to greatest.
For example, if you are researching the average salary in a specific industry to negotiate a raise, the mean might be inflated by a few high-earning executives. The median, however, represents the “true” middle, giving you a more accurate representation of what a typical professional in that field earns. The same applies to housing markets; a few multi-million dollar mansions can make a neighborhood look unaffordable if you only look at the mean price, whereas the median price shows you what the majority of buyers are actually paying.
The Mode: Identifying Recurring Spending Patterns
The mode is the value that appears most frequently in a dataset. In financial tracking, the mode is an excellent tool for identifying habits. If you look at your transaction history and find that the most frequent charge is $4.50 (perhaps a daily coffee), that is your mode. While it may seem insignificant compared to your rent or mortgage, identifying the mode of your discretionary spending reveals the psychological patterns behind your outflows, allowing for more disciplined financial behavior.
Statistical Measures in Investment Strategy
For the serious investor, central tendency is the bedrock of portfolio theory. Every time you read a report about the “average return” of the S&P 500 or the “typical yield” of a bond fund, you are engaging with central tendency.
Portfolio Performance and the Mean Return
When evaluating an investment over time, we often look at the “Mean Annual Return.” This figure allows investors to compare the performance of different asset classes. For instance, the historical mean return of the stock market (roughly 10% annually before inflation) serves as a benchmark for evaluating whether a specific mutual fund or stock is overperforming or underperforming. Professional wealth managers use the geometric mean to account for the effects of compounding, ensuring that the “average” reported reflects the actual growth of a dollar invested over a decade or more.

Risk Assessment through Distribution Analysis
Investors don’t just care about the center; they care about how far the data points stray from that center. However, you cannot understand “volatility” (standard deviation) without first establishing the central tendency. If a stock has a mean return of 8%, but the data is widely dispersed, the “center” becomes less reliable as a predictor of next year’s performance. By understanding where the median and mean sit in relation to current market prices, investors can determine if an asset is “mean-reverting”—a strategy based on the belief that prices will eventually return to their historical average.
Using the Median to Filter Market Volatility
In highly volatile markets, such as cryptocurrency or penny stocks, the mean can be incredibly misleading. A single 1,000% gain can make a portfolio’s average look fantastic, even if 90% of the other assets are failing. Savvy investors use the median return to judge the health of a diversified portfolio. If the median return is positive, it suggests that the majority of your investment choices are successful, rather than your overall performance being carried by one “lucky” strike.
Business Finance: Using Central Tendency for Scalability
For entrepreneurs and corporate financial officers, central tendency is used to optimize operations and maximize profit margins. Businesses that ignore these statistics often fail to scale because they base their projections on anomalies rather than the “center” of their data.
Pricing Strategies and Market Averages
Determining the price of a product or service requires a deep dive into the central tendency of the competitive landscape. A company must analyze the mean and median prices offered by competitors to position themselves correctly. If a business prices its product at the “mode” (the most common price point in the market), it is competing on volume. If it prices above the mean, it is positioning itself as a luxury or premium brand. Understanding these statistical centers allows a business to predict its “Average Revenue Per User” (ARPU), a key metric for calculating the lifetime value of a customer.
Operational Efficiency and Cost Centers
In supply chain management and business operations, the mean is used to calculate “Average Lead Time” or “Average Cost of Goods Sold” (COGS). By establishing these averages, a company can set Key Performance Indicators (KPIs). If the mean cost of producing a unit rises above a certain threshold, it triggers a financial audit. Furthermore, identifying the “mode” of product defects or service delays can help a business pinpoint the most frequent point of failure in their system, allowing for targeted financial investment in repairs or training.
Forecasting and Budgetary Planning
Corporate budgeting relies heavily on moving averages—a form of central tendency that updates as new data comes in. By looking at the mean sales of the last four quarters, a CFO can forecast the cash flow for the next quarter with reasonable accuracy. This prevents “over-leveraging,” where a company borrows too much money based on a single “peak” month that was actually an outlier rather than the central trend.
Avoiding Financial Fallacies: When Averages Mislead Investors
While central tendency is a powerful tool, it can be dangerous if used incorrectly. In finance, there is a famous saying: “A man can drown in a stream that is an average of three feet deep.”
The Flaw of Averages in Retirement Planning
One of the biggest mistakes in personal finance is relying solely on the “mean” for retirement projections. If an investor assumes a 7% mean return every year, they may fail to account for “Sequence of Returns Risk.” If the market crashes right as you retire, the “average” doesn’t matter because your principal has been depleted. In this case, looking at the distribution of returns and the median outcome provides a much more robust “stress test” for a retirement plan than a simple arithmetic average.
Outliers and Their Impact on Long-term Wealth
In the world of money, “outliers”—such as the 2008 financial crisis or the 2020 pandemic-induced market shift—can completely shift the mean. When analyzing historical data to make future investment decisions, it is crucial to determine if the central tendency is being skewed by “Black Swan” events. Financial professionals often use “trimmed means” (removing the highest and lowest 5% of data) to find a more stable central value that represents the “new normal” of the economy.
The Importance of Contextualizing the Center
Ultimately, central tendency is a starting point, not a conclusion. Whether you are looking at your bank statement, a stock chart, or a corporate balance sheet, the mean, median, and mode provide the “anchor” for your financial reality. By mastering these concepts, you gain the ability to filter out market noise, recognize your own spending habits, and make data-driven decisions that lead to long-term financial security. In the pursuit of wealth, the numbers don’t lie—but only if you know how to find their center.
aViewFromTheCave is a participant in the Amazon Services LLC Associates Program, an affiliate advertising program designed to provide a means for sites to earn advertising fees by advertising and linking to Amazon.com. Amazon, the Amazon logo, AmazonSupply, and the AmazonSupply logo are trademarks of Amazon.com, Inc. or its affiliates. As an Amazon Associate we earn affiliate commissions from qualifying purchases.