If you have ever tuned into a financial news broadcast or scrolled through a business news app, you have undoubtedly heard the phrase, “The Dow is up 300 points today,” or “The S&P 500 dropped 50 points in afternoon trading.” For the uninitiated, these figures can be incredibly confusing. Does a 300-point gain mean the market gained 300 dollars? Does it mean it grew by 300 percent?
In the world of personal finance and investing, clarity is the precursor to success. Understanding what “points” are is fundamental to interpreting market volatility, evaluating your portfolio’s performance, and making informed decisions. This guide will break down the mechanics of market points, why they differ across various indices, and how to look past the headlines to see the true economic reality.
Decoding Market Points vs. Dollar Values
The most common mistake new investors make is equating index points with dollar amounts. While they are mathematically related, they are not the same thing. To understand points, we must first distinguish between points in an index and points in an individual stock.
The Difference Between Index Points and Individual Stock Points
In the context of an individual stock, the term “point” is relatively straightforward: one point equals one dollar. If a stock is trading at $50 and it gains two points, it is now worth $52. This is a simple, archaic shorthand that has survived from the days of the trading floor.
However, when we talk about indices like the Dow Jones Industrial Average (DJIA) or the S&P 500, a point is a unit of measurement representing the weighted average change of all the stocks within that index. A 100-point move in the Dow does not mean that every stock in the index went up by $1. Instead, it reflects a collective movement filtered through a complex mathematical formula.
Why the Media Focuses on Point Changes Over Percentages
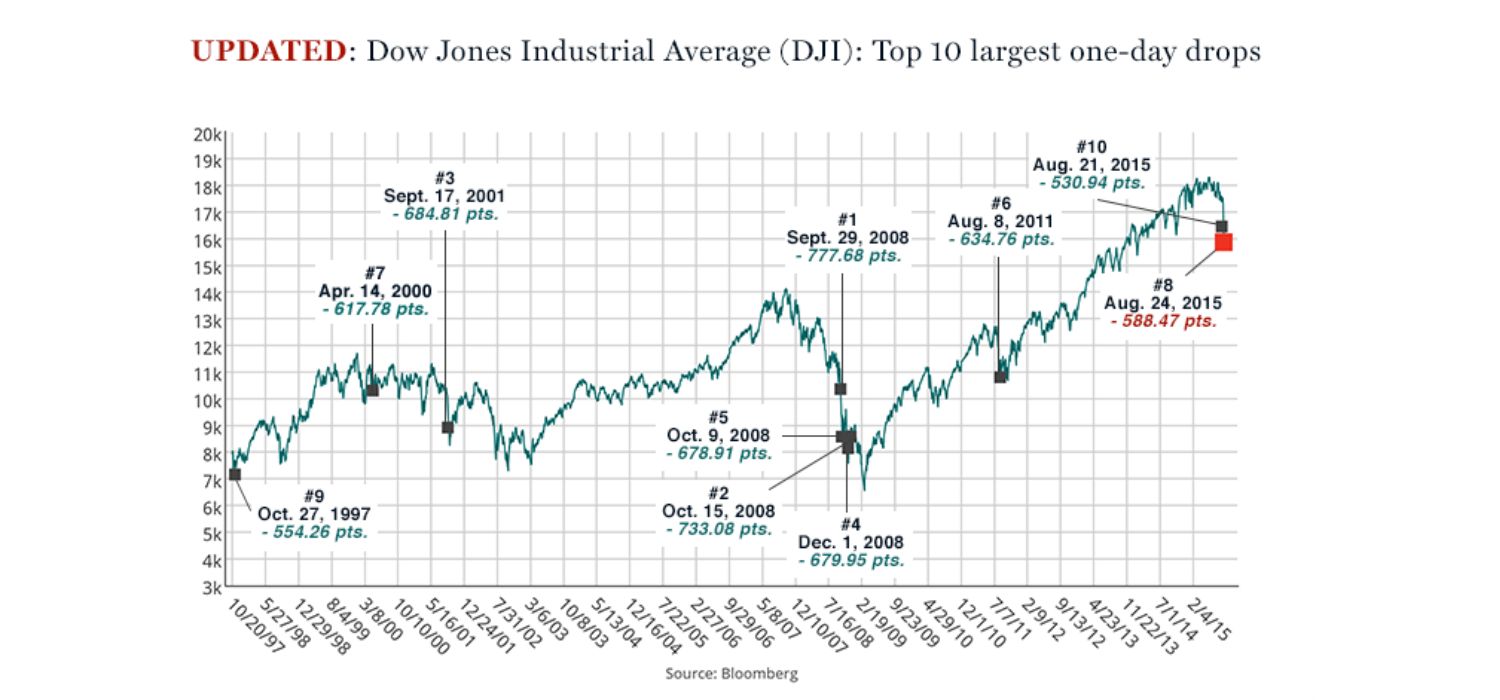
Financial media outlets often lead with point changes because they sound more dramatic. Hearing that the market “plunged 800 points” creates a visceral reaction that “the market dropped 2.1%” does not. For the professional investor, however, points are secondary to percentages.
A 500-point drop when the Dow is at 10,000 is a massive 5% crash. A 500-point drop when the Dow is at 40,000 is a mere 1.25% correction. To maintain a professional perspective on your money, you must always convert point headlines into percentage realities.
Calculating the Magnitude of a Point Move
To understand how a point is calculated, you have to look at the “divisor.” For indices like the Dow, the sum of the prices of all component stocks is divided by a specific number (the Dow Divisor). This divisor is constantly adjusted to account for stock splits, dividends, and changes in the companies that make up the index. Because of this, a single dollar move in a high-priced stock like UnitedHealth Group has a much larger impact on the “points” of the Dow than a dollar move in a lower-priced stock like Coca-Cola.
How Major Indices Use Points: The Benchmarks of Wealth
Not all indices are created equal. The way points are calculated depends entirely on the methodology of the specific index. As an investor, knowing which benchmark your money is measured against is critical.
The Dow Jones Industrial Average (DJIA) and the Price-Weighted System
The Dow is the oldest and perhaps most famous index, but its point system is often criticized by professionals. It is a “price-weighted” index, meaning the stocks with the highest share prices have the most influence on the index’s point total.
In this system, if a stock priced at $400 moves up 1%, it adds significantly more points to the Dow than a stock priced at $40 moving up 1%. This can sometimes give a skewed view of the total market’s health, as the point movements are dominated by a handful of high-priced equities.
The S&P 500 and Market-Cap Weighting
Most professional money managers prefer the S&P 500 because it uses a “market-cap weighted” system. In this model, points are determined by the total market value (share price multiplied by total shares outstanding) of the companies.
When you see the S&P 500 move by 50 points, it reflects the movement of the 500 largest publicly traded companies in the U.S. weighted by their actual size. This makes the S&P 500 points a more accurate representation of the overall economy’s trajectory compared to the Dow.
The Nasdaq Composite and Tech Sector Points
The Nasdaq is heavily weighted toward the technology and growth sectors. Because many tech stocks have high valuations and high volatility, the Nasdaq’s point swings can be much more aggressive than those of the S&P 500. For an investor focused on tech, Nasdaq points serve as a barometer for “risk-on” or “risk-off” sentiment in the market. Understanding these points helps you gauge whether capital is flowing into innovative growth companies or retreating to “safer” value stocks.
Points in the Context of Trading and Interest Rates
Beyond the major indices, “points” are used in other areas of finance that directly impact your personal bottom line, specifically in bond markets and technical trading.
Basis Points (BPS) in Fixed Income and Interest Rates
In the world of banking and bonds, you will often hear the term “basis points” or “bps” (pronounced “bips”). One basis point is equal to 1/100th of 1 percent (0.01%). If the Federal Reserve raises interest rates by 25 basis points, they are raising the rate by 0.25%.
While index points measure the price of equities, basis points measure the cost of money. For the average person, basis points are what determine the interest rate on your mortgage, your car loan, and the yield on your high-interest savings account. When basis points go up, bond prices usually go down, creating a different kind of “point” movement in your fixed-income portfolio.
Technical Analysis and Key “Point” Support Levels
Traders often use points to identify “psychological levels” in the market. You might hear a technician say, “The S&P has strong support at the 5,000-point mark.” This means that, historically, investors are hesitant to let the index fall below that specific point value. These points act as milestones that can trigger automated buying or selling, creating a self-fulfilling prophecy of market movement.
Point Spreads and Options Pricing
In more advanced investing strategies, such as options trading, points refer to the “spread” or the movement of the underlying asset. Understanding the “point value” of an options contract is essential for risk management. For instance, in some futures contracts, a one-point move can represent hundreds or thousands of dollars in profit or loss. This is where the “point” moves from a theoretical index measure to a very real impact on your liquid capital.
The Psychology of Points: Why 1,000 Points Isn’t What It Used To Be
Understanding the math is one thing, but managing the psychology of market points is where the real discipline of personal finance lies. The way points are reported can often lead to emotional decision-making, which is the enemy of long-term wealth.
The Relativity of Point Volatility
In 1987, the “Black Monday” crash saw the Dow lose 508 points. At the time, that represented a staggering 22.6% drop in a single day—the largest one-day percentage decline in history. Today, a 508-point move happens regularly and represents a shift of less than 1.5%.
As the total point value of the market grows, the “volatility” of points naturally increases. A 1,000-point swing is the “new normal.” Investors who do not understand this relativity often panic unnecessarily when they see large point drops in the headlines, failing to realize that the percentage impact on their actual wealth is relatively minor.
Milestone “Points” and Investor Sentiment
Humans love round numbers. When the Dow hit 10,000, 20,000, and 30,000, it generated massive media coverage. These point milestones often act as “resistance levels.” When an index approaches a major round number, there is often a flurry of activity as investors decide whether the market is overvalued or has more room to run. While these milestones are mathematically arbitrary, their psychological impact on the market can create temporary volatility.
Avoiding the “Point Trap” in Portfolio Management
To be a successful investor, you must learn to ignore the “noise” of daily point fluctuations. Your financial goals are likely measured in years or decades, while point movements are measured in minutes and hours. Instead of checking how many points the market gained today, focus on your personal rate of return and your asset allocation. The points are a scoreboard for the market, but your bank account is the scoreboard for your life.

Conclusion: The Educated Investor’s Perspective
Points are the language of the stock market, but like any language, they can be misinterpreted. By understanding that index points are a weighted average, distinguishing between the Dow and the S&P 500, and recognizing the difference between point moves and percentage changes, you move from being a spectator to a sophisticated participant in the financial world.
The next time you hear a sensationalist headline about the market “losing points,” you will have the tools to ask the right questions: What is the percentage move? How does this affect the divisor? Is this a movement in basis points or index points? This level of insight is what separates those who react to the market from those who profit from it. In the realm of money and investing, knowledge isn’t just power—it’s the protection of your financial future.
aViewFromTheCave is a participant in the Amazon Services LLC Associates Program, an affiliate advertising program designed to provide a means for sites to earn advertising fees by advertising and linking to Amazon.com. Amazon, the Amazon logo, AmazonSupply, and the AmazonSupply logo are trademarks of Amazon.com, Inc. or its affiliates. As an Amazon Associate we earn affiliate commissions from qualifying purchases.