The allure of the lottery is a foundational element of modern financial mythology. For many, the purchase of a ticket represents more than just a game of chance; it is a micro-investment in a dream of absolute financial freedom. However, from a professional personal finance perspective, the lottery is often termed a “tax on those who struggle with mathematics.” To navigate this landscape effectively, one must move past the marketing of billion-dollar jackpots and look strictly at the numbers.
If you are looking for the “best” odds, you must first define what you are seeking: the best odds of winning any prize, the best odds of becoming a millionaire, or the best expected value for every dollar spent. This guide breaks down the mechanics of lottery probability and identifies which tickets offer the highest statistical likelihood of a return, while framing these choices within a broader strategy of wealth management.

1. Understanding the Mathematics of Lottery Odds
Before choosing a ticket, it is essential to distinguish between the various types of “odds” advertised. Most players focus on the jackpot, but the underlying financial structure of a lottery game is far more complex.
Probability vs. Expected Value
In the world of professional finance, we rarely look at probability in isolation. Instead, we look at Expected Value (EV). EV is a calculation that multiplies the probability of each possible outcome by the value of that outcome. For most lottery tickets, the EV is deeply negative—usually around -$0.50 for every $1.00 spent. This means that, statistically, you are losing half your money the moment you make the purchase. However, when jackpots reach record-breaking levels, the EV can occasionally turn positive, though this is rare and carries extreme variance.
The Impact of Prize Pool Distribution
Not all lotteries are structured the same way. Some games are “top-heavy,” meaning the vast majority of the prize money is concentrated in a single, near-impossible jackpot. Others are “flat,” distributing smaller prizes more frequently to a larger number of players. From a cash-flow perspective, a flat structure offers better “odds” of winning something, but it rarely results in a life-changing financial event. Understanding where the money goes—whether it stays in the lower tiers or migrates to the top—is the first step in identifying a ticket with favorable odds.
The Concept of “Hit Frequency”
In the gaming industry, hit frequency refers to how often a ticket will result in any prize at all. A ticket might have odds of 1 in 4 to win a prize, but if the prize is simply your money back (a “break-even” ticket), your net financial gain is zero. When analyzing which ticket has the best odds, you must look for the highest hit frequency for prizes that actually exceed the cost of the ticket.
2. Comparing Different Lottery Formats: Draws vs. Scratch-offs
When searching for the best odds, the format of the game is the most significant variable. There is a massive statistical gulf between a national draw game like Powerball and a local state-level scratch-off.
Multi-State Games: Powerball and Mega Millions
These are the giants of the industry, but from a probability standpoint, they offer the worst odds of success. The odds of winning a Powerball jackpot are approximately 1 in 292.2 million. To put this in a financial context, you are significantly more likely to be struck by lightning or to become a self-made billionaire through traditional entrepreneurship than you are to win these draws. While the “best odds” for a massive payout live here, the “best odds” for a return on investment certainly do not.
State-Level Draw Games
Smaller, state-specific games like “Pick 3” or “Fantasy 5” generally offer much better odds than national draws. For instance, a “Pick 3” game might have odds of 1 in 1,000 to win a top prize. While the prize is significantly smaller (often $500), the statistical probability of winning is hundreds of thousands of times higher than in a national game. For those looking for a “win” as a matter of mathematical probability, these smaller draws are objectively superior.
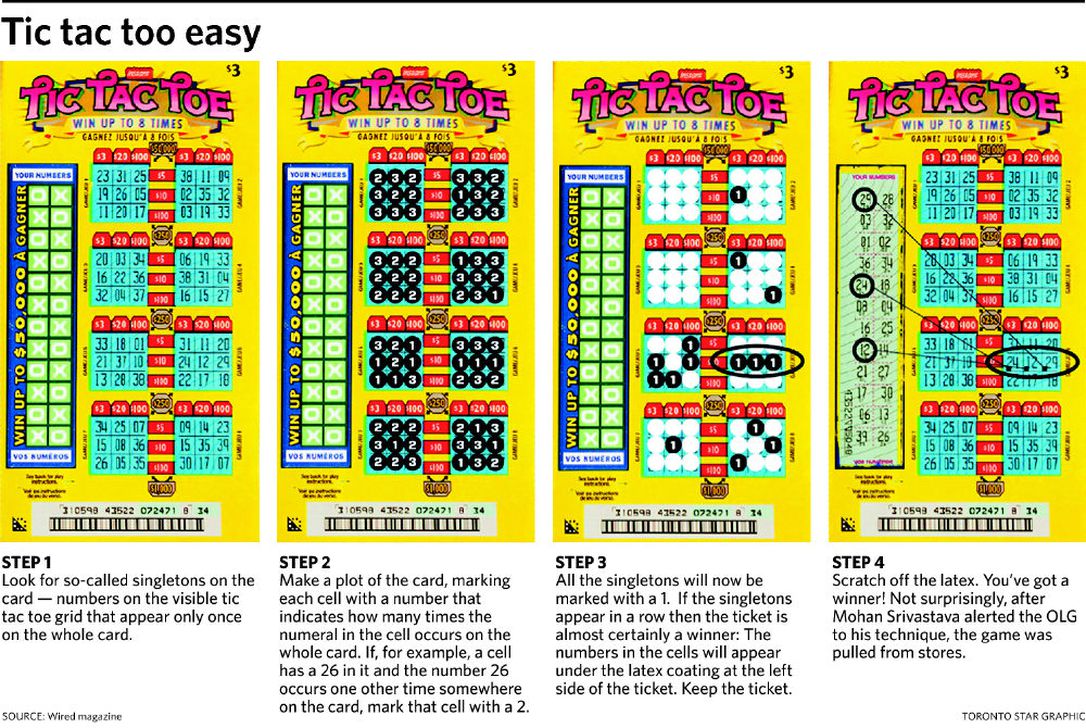
Scratch-Off Tickets: The Best “Technical” Odds
If you are looking for the best odds of winning any prize, scratch-off tickets are the undisputed champions. Most scratch-off games offer overall odds of winning between 1 in 3 and 1 in 4. High-denomination tickets (such as $20, $30, or $50 tickets) often have even better odds and higher prize tiers. Because these games are pre-printed, the odds are fixed and transparent. State lottery websites often publish the remaining number of top prizes for each scratch-off game; savvy players use this data to buy tickets for games where the top prizes haven’t been claimed yet, effectively “tilting” the odds slightly in their favor.
3. Strategic Selection: Maximizing Potential Returns
If you choose to participate in the lottery as a form of entertainment, you should do so with the same rigor you apply to your investment portfolio. This means understanding the “hidden” factors that erode your actual winnings.
Evaluating the “Lump Sum” vs. Annuity
When you win a major jackpot, the number you see on the billboard is rarely the number you get. Most “best odds” discussions forget to mention that the advertised jackpot is an annuity paid over 30 years. From a time-value of money perspective, the lump sum is often the smarter financial move if you have the discipline to invest it, but it typically reduces the prize by 30-40% immediately. Your “odds” of winning a certain dollar amount are actually much lower than they appear once you factor in the present value of money.
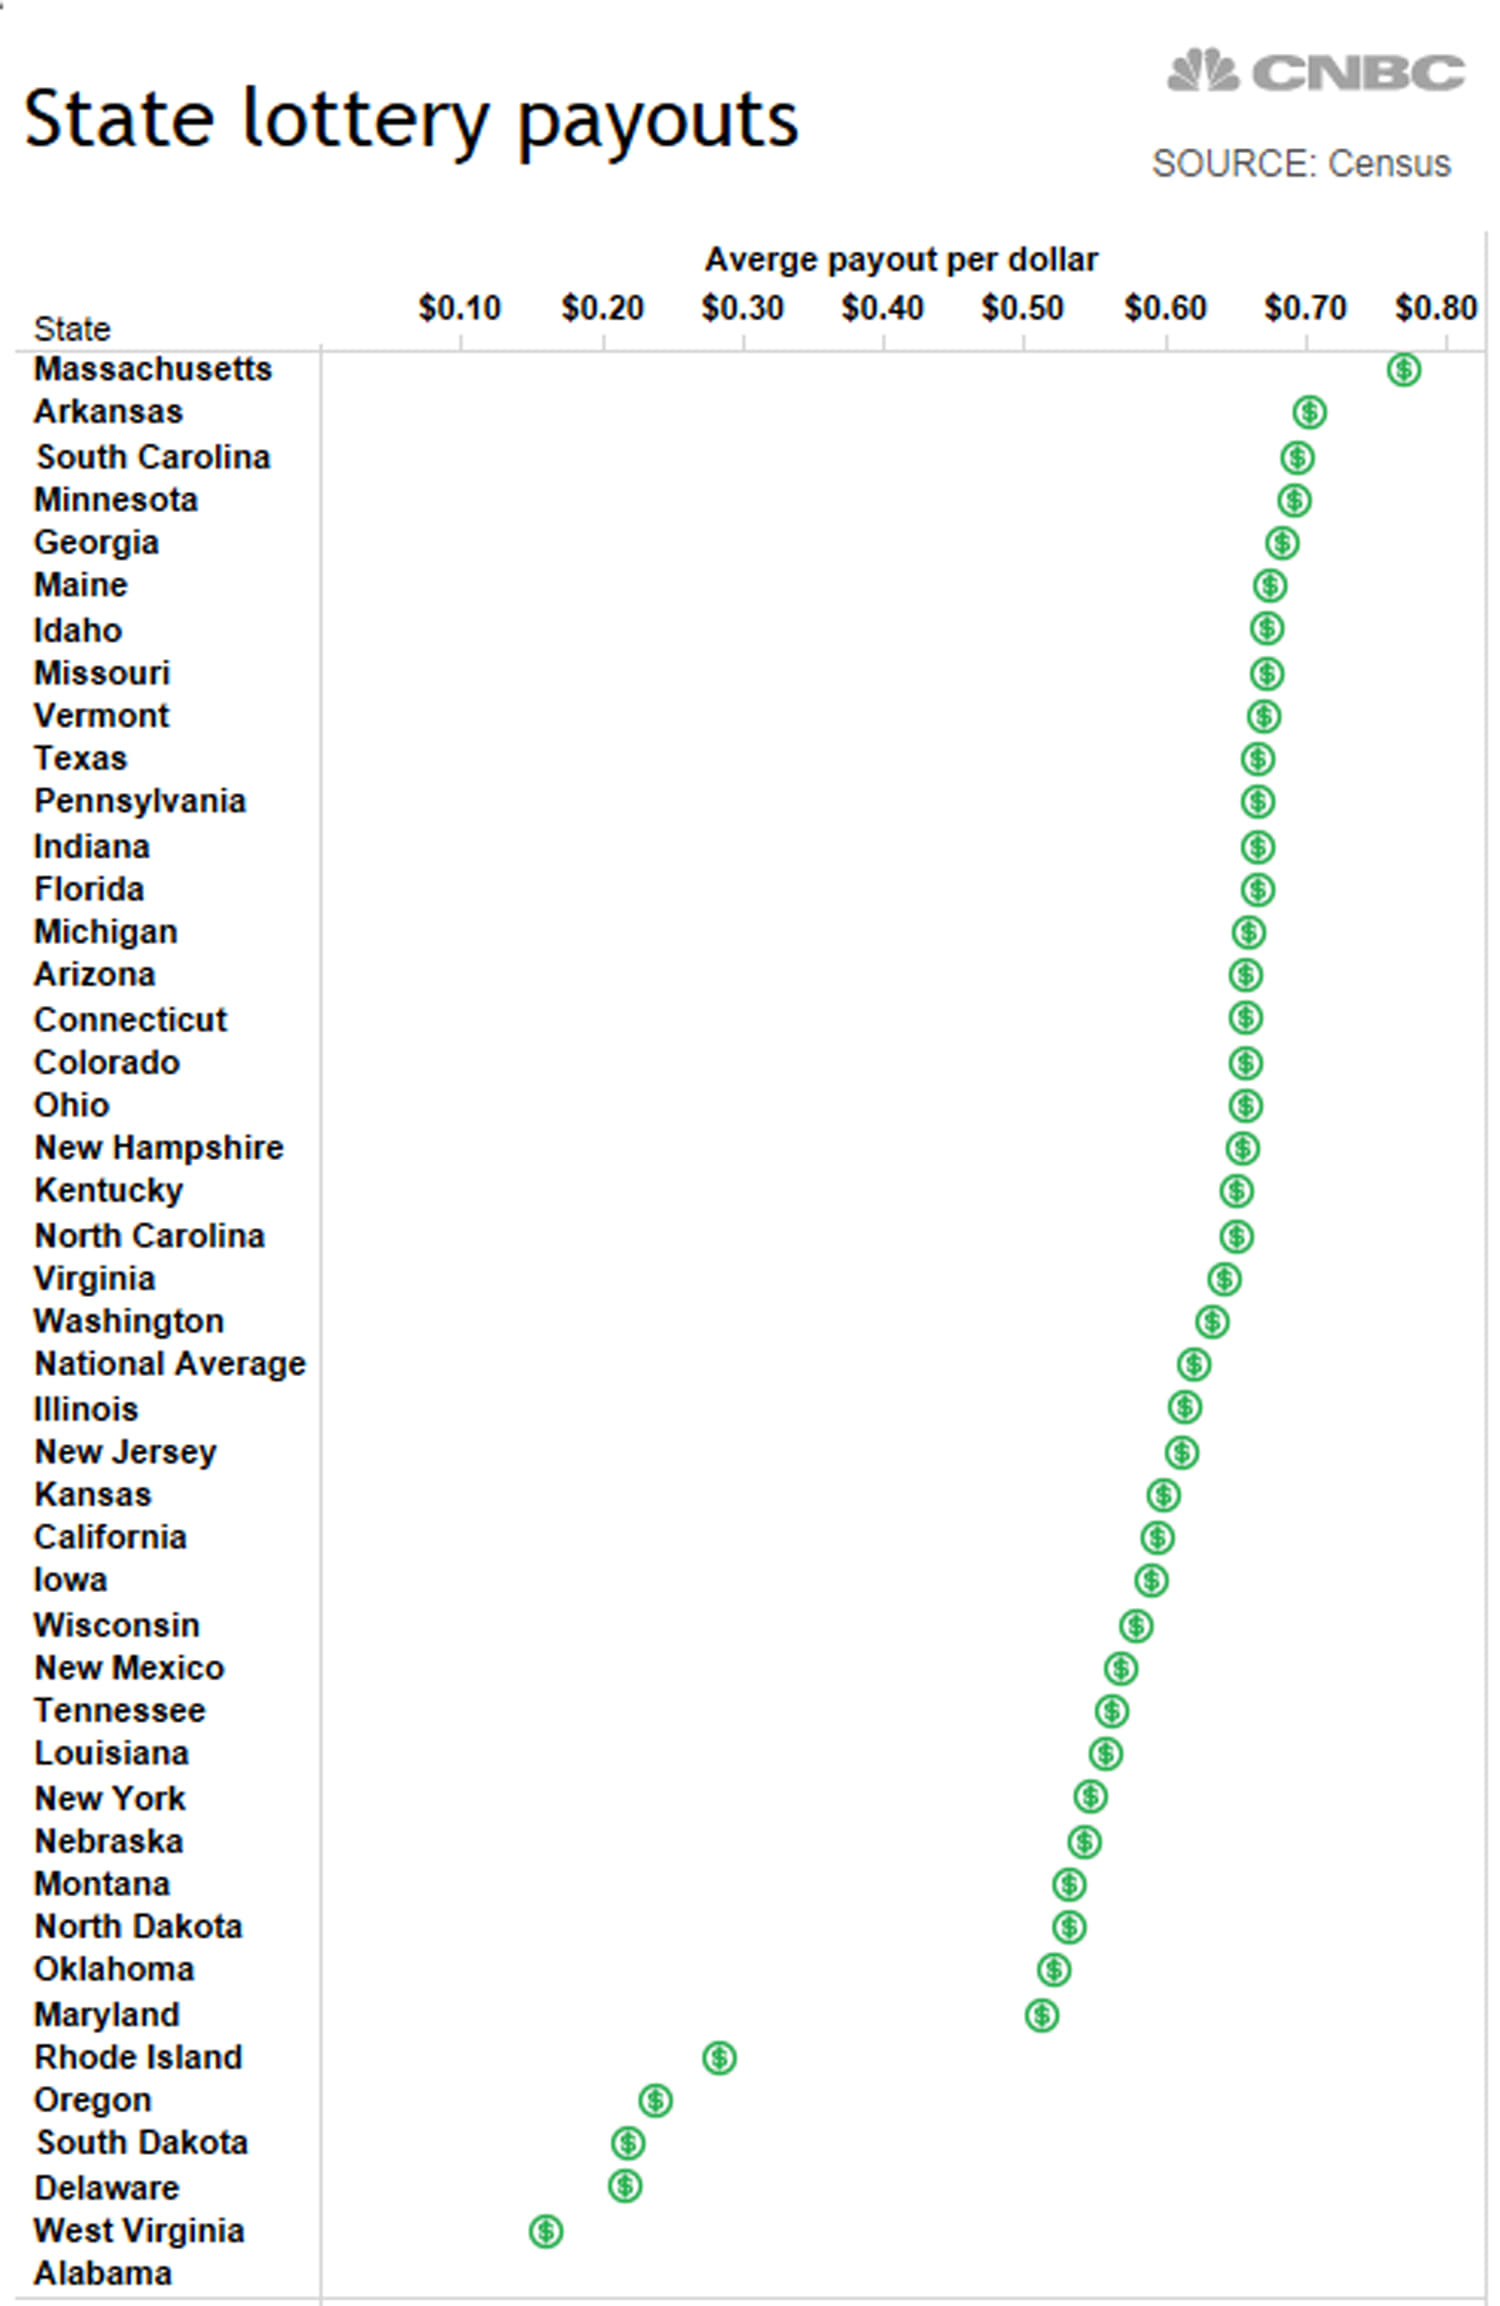
The Influence of Taxes on Real Odds
In the United States, the IRS treats lottery winnings as ordinary income. Depending on your state, you could lose up to 50% of your winnings to federal and state taxes. When calculating which ticket has the best odds, you must calculate the post-tax expected value. A $1 million prize in a high-tax state like New York is worth significantly less than the same prize in a state with no income tax like Florida or Texas. The “best odds” are therefore geographically dependent.
Avoiding Common Numbers and Pool Sharing
While you cannot change the odds of the numbers being drawn, you can change the odds of having to share the prize. Most people pick numbers based on birthdays (1-31). By choosing higher numbers, you decrease the statistical likelihood of a “split” jackpot. From a financial strategy standpoint, the best ticket is one that maximizes your “solitary win” probability. If you share a jackpot with four other people, your $100 million win becomes $20 million, drastically changing the ROI of your initial $2 investment.
4. The Opportunity Cost: The Lottery vs. Traditional Investing
The ultimate question in personal finance isn’t just “which ticket has the best odds,” but “what is the best use of this capital?” To understand the true cost of the lottery, we must look at what that money could do elsewhere.
Comparing Lottery Spending to Index Fund Investing
The average regular lottery player spends approximately $1,000 per year on tickets. If, instead of buying tickets with a 1 in 292 million chance of success, that player invested $1,000 annually into an S&P 500 index fund with an average 7% annual return, the results would be transformative. Over 30 years, that “lottery money” would grow to nearly $100,000. In this scenario, the “odds” of having $100,000 are nearly 100%, compared to the near-zero odds of winning a jackpot.
Psychological Triggers and Financial Discipline
The lottery relies on the “availability heuristic”—the tendency for people to overestimate the probability of events that are easy to imagine (like a big win). In a professional financial plan, discipline is prioritized over luck. The “best odds” for building wealth do not involve a ticket at all; they involve consistent saving, tax-advantaged accounts (like a 401k or IRA), and compound interest.
The “Entertainment Only” Rule
If you find value in the “dream” the lottery provides, it should be categorized in your budget under “Entertainment,” not “Investing.” When viewed as a $2 movie ticket that lasts for three days until the drawing, the lottery makes sense. When viewed as a retirement plan, it is a mathematical catastrophe. The best odds for your financial future are found in the assets you control—your career, your investments, and your spending habits—rather than the numbers on a plastic-coated slip of paper.
Final Verdict: Which Ticket Wins?
Mathematically, the ticket with the “best odds” of winning a prize is typically a high-denomination ($30+) scratch-off from a state lottery that publishes its remaining prize data. However, from a wealth-building perspective, the “best odds” are found by avoiding the lottery entirely and redirecting those funds into a diversified investment portfolio.
In the world of money, certainty is the greatest asset. While the lottery offers the slim possibility of a vertical leap in net worth, the stock market and professional financial planning offer a proven staircase. Choose the staircase every time.
aViewFromTheCave is a participant in the Amazon Services LLC Associates Program, an affiliate advertising program designed to provide a means for sites to earn advertising fees by advertising and linking to Amazon.com. Amazon, the Amazon logo, AmazonSupply, and the AmazonSupply logo are trademarks of Amazon.com, Inc. or its affiliates. As an Amazon Associate we earn affiliate commissions from qualifying purchases.