In the world of finance, raw numbers often tell only half the story. If an investor earns $1,000 on an investment, it sounds like a success. However, that $1,000 means something entirely different if the initial investment was $5,000 versus $500,000. To truly understand the velocity of wealth, the health of a business, or the impact of inflation on a household budget, one must master the concept of percentage change.
Percentage change is the mathematical bridge that allows us to compare different financial scenarios on an equal playing field. It provides a standardized way to express the relationship between an old value and a new value, offering clarity that simple subtraction cannot provide. Whether you are tracking the performance of a stock portfolio, analyzing quarterly business revenue, or trying to understand how much your cost of living has increased, knowing how to figure out percentage change is a fundamental skill for financial literacy.
Understanding the Fundamentals: Why Percentage Change Matters in Finance
At its core, percentage change measures the relative difference between two values over time. In the niche of personal and business finance, this “relative” aspect is vital because it provides context. Without context, financial data is difficult to act upon.
The Core Formula: New Value vs. Old Value
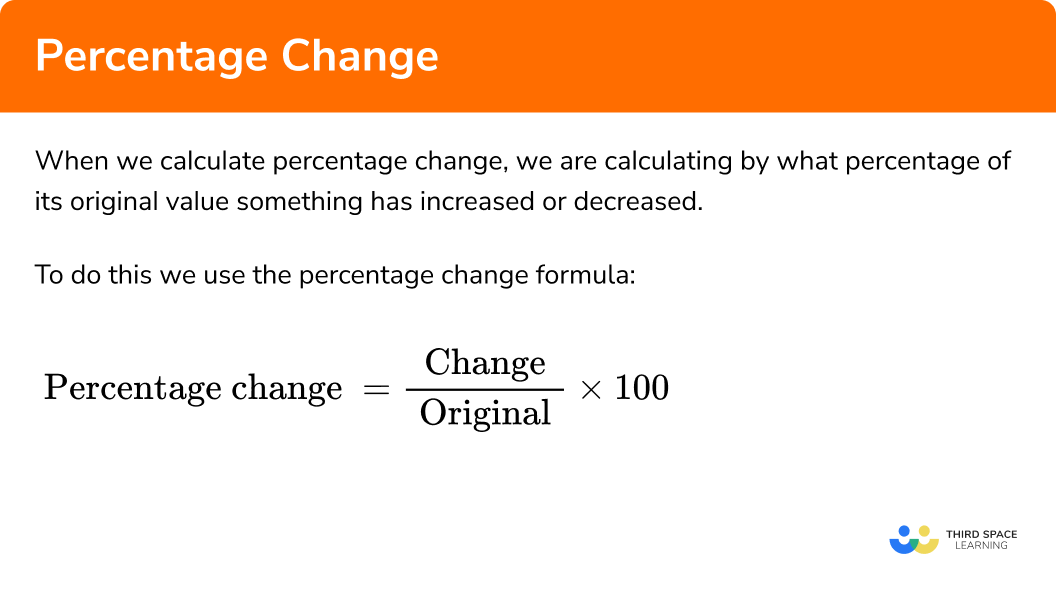
To calculate percentage change, you don’t need a complex financial degree; you simply need a consistent formula. The standard mathematical expression is:
((New Value – Old Value) / |Old Value|) × 100 = Percentage Change
First, you subtract the original value (the “Old Value”) from the current value (the “New Value”). This gives you the absolute change. Next, you divide that result by the absolute value of the original number. Finally, you multiply by 100 to convert the decimal into a percentage.
For example, if you purchased a share of a company for $150 (Old Value) and it is now worth $180 (New Value), the calculation would be:
- $180 – $150 = $30
- $30 / $150 = 0.2
- 0.2 × 100 = 20%
Your investment has grown by 20%.
Identifying Growth vs. Loss
The result of your calculation will be either positive or negative, which immediately signals the direction of the financial trend. A positive percentage change indicates growth or an increase—such as a rise in capital gains or an increase in annual salary. Conversely, a negative percentage change indicates a loss or a decrease, such as a dip in market value or a reduction in operational expenses.
In financial reporting, these are often color-coded: green for positive change and red for negative change. Understanding this distinction is the first step in “reading” the markets or your own bank statements. It allows you to move past the emotional reaction of seeing a balance change and toward a logical analysis of the rate of that change.
Applying Percentage Change to Personal Finance and Budgeting
For the individual focused on “Money” and personal wealth management, percentage change is the ultimate tool for auditing one’s lifestyle. It helps in moving away from “feeling” like things are more expensive to “knowing” exactly how one’s purchasing power is shifting.
Tracking Expense Inflation
Inflation is often discussed in broad, national terms, but “personal inflation” is what truly affects your bottom line. By calculating the percentage change in your recurring bills, you can identify where your money is leaking. If your grocery bill was $400 a month last year and is now $500, that is a 25% increase. If your income only increased by 5% in that same period, you are experiencing a significant net loss in purchasing power.
Using percentage change to track expenses allows you to prioritize which costs to cut. A 10% increase in a $1,000 rent payment is much more impactful than a 50% increase in a $10 streaming subscription. Calculating these changes helps you allocate your focus where the mathematical impact is greatest.
Measuring Savings Rate Increases
On the positive side of personal finance, percentage change is used to track the growth of your “gap”—the difference between what you earn and what you spend. If you saved $500 last month and managed to save $600 this month, you have increased your savings rate by 20%.
Setting goals based on percentage change rather than dollar amounts is often more sustainable. Aiming to “increase retirement contributions by 2% each year” is a strategy that scales with your career growth, ensuring that your financial security keeps pace with your earnings.

Evaluating Investment Performance and Portfolio Volatility
In the realm of investing, percentage change is the primary language. Prices of stocks, bonds, and cryptocurrencies fluctuate by the second, and the only way to compare a “penny stock” to a “blue-chip stock” is through the lens of percentage.
Calculating Return on Investment (ROI)
ROI is perhaps the most famous application of percentage change. It tells an investor how efficiently their capital is working. When comparing two different assets, the raw profit is irrelevant. If Investment A makes $500 and Investment B makes $5,000, Investment B looks better. However, if Investment A required only $1,000 of capital (50% ROI) and Investment B required $50,000 of capital (10% ROI), Investment A is actually the superior performer in terms of capital efficiency.
Calculating percentage change allows you to strip away the “noise” of the dollar amounts and see which assets are truly driving your wealth forward.
Analyzing Market Fluctuations and Dividend Yields
Percentage change is also essential for understanding volatility. Investors look at the “Beta” of a stock, which is essentially a measure of how much a stock’s price changes in percentage terms compared to the broader market. If the S&P 500 drops by 1% and your portfolio drops by 3%, your portfolio is more volatile.
Furthermore, when evaluating dividend-paying stocks, investors look at the “Dividend Growth Rate.” This is the percentage change in the dividend payout over time. A company that increases its dividend by 10% annually is often a more attractive long-term prospect than a company with a high static yield, as the percentage change signals compounding growth.
Percentage Change in Business Finance and Profitability
For business owners and financial analysts, percentage change is used to measure the “velocity” of a company. It is the foundation of the Year-over-Year (YoY) and Quarter-over-Quarter (QoQ) metrics found in every earnings report.
Revenue Growth and Sales Forecasting
A company’s health is often judged by its “Top Line” growth. If a business earned $1 million in Q1 and $1.2 million in Q2, that 20% QoQ growth is a strong indicator of market fit and scaling success. Investors and lenders use these percentages to forecast future performance. If a company consistently shows a 15% annual increase in revenue, it becomes much easier to value that company for a potential sale or to secure a business loan.
Margin Analysis and Cost Management
Profitability isn’t just about how much money comes in; it’s about how much stays in. Percentage change is used to monitor “Gross Margins” and “Operating Margins.” If revenue stays the same but the cost of goods sold (COGS) increases by 5%, the percentage change in profit margin will be negative. This tells the business owner that they need to either raise prices or find more efficient suppliers. Without calculating these percentages, a business could be growing in size while simultaneously dying in profitability.
Advanced Tools and Common Pitfalls in Financial Calculations
While the formula is simple, the application of percentage change in complex financial environments requires a few tools and a bit of caution regarding mathematical illusions.
Using Financial Software and Spreadsheets
In professional finance, manual calculations are rare. Tools like Microsoft Excel or Google Sheets use the formula =(New-Old)/Old. Most financial tracking apps (like Mint, YNAB, or Bloomberg Terminal) automate this to show you “Daily Change %” or “Total Return %.”
For more complex scenarios, such as “Internal Rate of Return” (IRR) or “Compound Annual Growth Rate” (CAGR), software is essential. CAGR is essentially a smoothed-out percentage change that tells you what your annual growth would have been if the investment grew at a steady rate each year. It is one of the most honest ways to look at long-term financial progress.

The Danger of “The Low Base Effect”
One of the most important lessons in financial percentage change is understanding the “Low Base Effect.” This occurs when a small absolute change results in a massive percentage change because the starting number was very low. If a startup goes from 1 client to 3 clients, that is a 200% increase. While the percentage is huge, the business is still very small.
Conversely, there is the “Math of Recovery.” If your investment portfolio drops by 50%, you do not need a 50% gain to get back to where you started. You need a 100% gain.
- Start: $100
- 50% Drop: $50
- 50% Gain of $50: $75 (You are still down $25)
- 100% Gain of $50: $100 (You are back to even)
Understanding this nuance is critical for risk management. It illustrates why avoiding large losses is often more important in finance than chasing large gains.
By mastering the ability to figure out percentage change, you equip yourself with the analytical lens necessary to navigate the complexities of money. Whether you are managing a household budget, a stock portfolio, or a multi-million dollar corporation, the percentage is the truth-teller that reveals the real story behind the numbers.
aViewFromTheCave is a participant in the Amazon Services LLC Associates Program, an affiliate advertising program designed to provide a means for sites to earn advertising fees by advertising and linking to Amazon.com. Amazon, the Amazon logo, AmazonSupply, and the AmazonSupply logo are trademarks of Amazon.com, Inc. or its affiliates. As an Amazon Associate we earn affiliate commissions from qualifying purchases.