Google Chrome remains the world’s most popular web browser, lauded for its speed, minimalist interface, and deep integration with the Google ecosystem. However, this complexity comes at a price. When Chrome starts crashing repeatedly, failing to launch, or displaying the dreaded “Your profile could not be opened correctly” error, the issue is rarely with the executable program itself. Instead, the culprit usually lies hidden within a specific file inside your Chrome User Profile directory.
Understanding which file is causing the crash requires a deep dive into how Chrome manages data. In this guide, we will analyze the technical architecture of a Chrome profile, identify the common file-based culprits of instability, and walk through the professional diagnostic steps required to restore your browser to peak performance.
1. Anatomy of a Chrome Profile: Where Your Data Lives
To identify a problematic file, you must first know where Chrome stores your profile information. Unlike simple applications that store settings in a single registry key, Chrome utilizes a sophisticated directory structure filled with JSON files, SQLite databases, and binary blobs.
The Path to the Profile Directory
On a Windows machine, your Chrome data is tucked away in the AppData folder. The typical path is %LOCALAPPDATA%GoogleChromeUser Data. Within this folder, the “Default” folder represents your primary profile. If you have multiple Chrome users, they will be labeled “Profile 1,” “Profile 2,” and so on. Understanding this path is the first step in digital forensics; you cannot fix what you cannot find.
The Role of JSON and Preferences
Most of your configuration settings are stored in files named Preferences and Local State. These are formatted in JSON (JavaScript Object Notation). If Chrome crashes during a write operation—perhaps due to a sudden power loss or a system freeze—the JSON structure can become malformed. A single missing bracket or a corrupted string in the Preferences file can prevent Chrome from parsing the profile, leading to an immediate crash upon startup.
SQLite Databases: History and Web Data
Chrome uses SQLite, a lightweight database engine, to manage your browsing history, cookies, and saved login information. Files like History, Cookies, and Web Data are actually SQL databases. Over time, these databases can suffer from “fragmentation” or index corruption. If the Web Data file, which handles autofill and payment info, becomes corrupted, any attempt by Chrome to access those services will trigger a fatal exception.
2. Diagnostic Steps to Pinpoint the Problematic File
Finding the specific file responsible for a crash is a process of elimination. Because Chrome loads various modules in a specific order, we can use diagnostic techniques to narrow down the search.
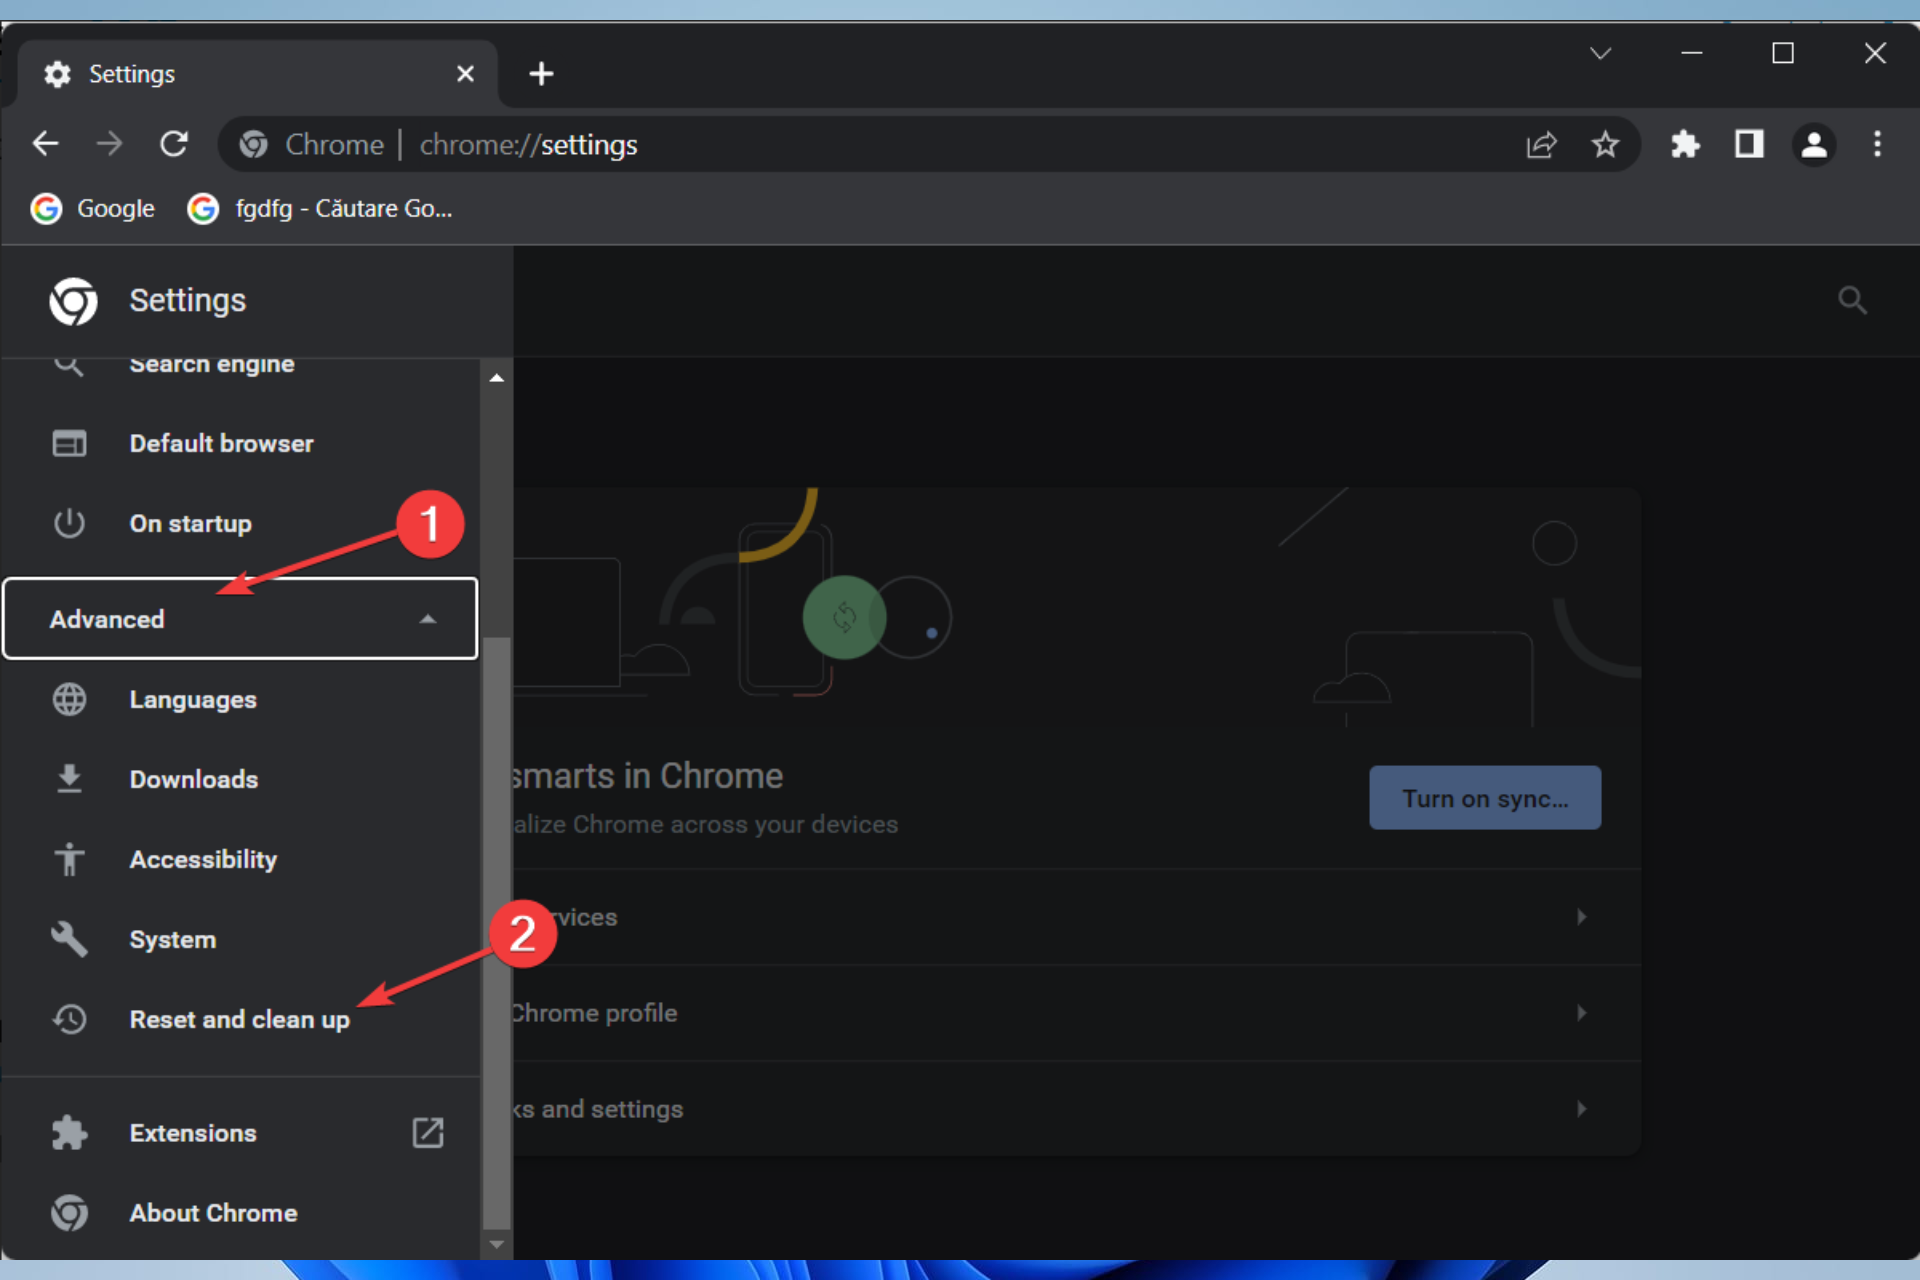
Utilizing Chrome’s Built-in Software Reporter Tool
Before manually digging into folders, it is wise to utilize the Chrome Software Reporter Tool (found in Chrome Settings under “Reset and clean up”). This tool scans for programs and localized file conflicts that might be interfering with the profile integrity. While it often looks for external malware, it also flags internal inconsistencies that might cause the Local State file to become read-only or inaccessible.
The Binary Search Method: Isolating the Default Folder
The most professional way to identify a profile-related crash is the “Binary Search” or “Isolation” method. By renaming the User Data folder to User Data Backup, you force Chrome to generate a clean, fresh directory. If Chrome opens without issue, you have confirmed that the problem lies within the original files. You can then begin moving individual files (like Bookmarks or Login Data) from the backup to the new folder one by one until the crash recurs. This identifies the exact file that is corrupted.
Analyzing Crash Logs through chrome://crashes
For advanced users, Chrome provides a hidden diagnostic page: chrome://crashes. If “Usage and crash reporting” is enabled, Chrome generates a unique “Crash ID” for every failure. While the raw dump files are difficult for humans to read without a debugger, the crash reports often point to specific subsystems, such as “Extension” or “GPU,” which narrows down the file search to the Extensions folder or the GPUCache directory.
3. Common Culprits: Files That Frequently Cause Instability
In the vast majority of cases, one of four specific files or folders is responsible for profile-related crashes. Targeting these first can save hours of troubleshooting.
The “Local State” File: A Common Point of Failure
The Local State file resides in the root User Data folder rather than the specific Default profile folder. It contains global settings that apply to all profiles, such as window placement and hardware acceleration toggles. Because it is accessed every time any profile is opened, it is a high-traffic file. If this file becomes corrupted, Chrome may fail to initialize its windowing system, leading to a crash before the browser even appears on the screen.
Extension-Related Corruptions in the ‘Extensions’ Directory
The Extensions folder contains the code and local storage for every add-on you have installed. Often, a specific extension update might fail, leaving a malformed script file. When Chrome tries to load this extension into memory, it triggers a memory access violation. If you find that Chrome only crashes after a few seconds of being open, the culprit is likely a file within the subdirectories of the Extensions folder.
Hardware Acceleration and GPU Cache Files
Modern browsers leverage your graphics card to render web pages. This data is stored in the GPUCache and ShaderCache folders. These files are highly volatile. If your graphics driver updates or if there is a conflict between Chrome’s rendering engine and your GPU hardware, these cache files can cause “Black Screen” crashes or total browser hangs. Deleting the contents of these folders is a non-destructive way to clear out corrupted temporary files.
4. Remediation Strategies: How to Fix a Corrupted Profile
Once you have identified or suspected a specific file, the goal is to repair the damage without losing your critical data like bookmarks and saved passwords.
Resetting Preferences vs. Creating a New Profile
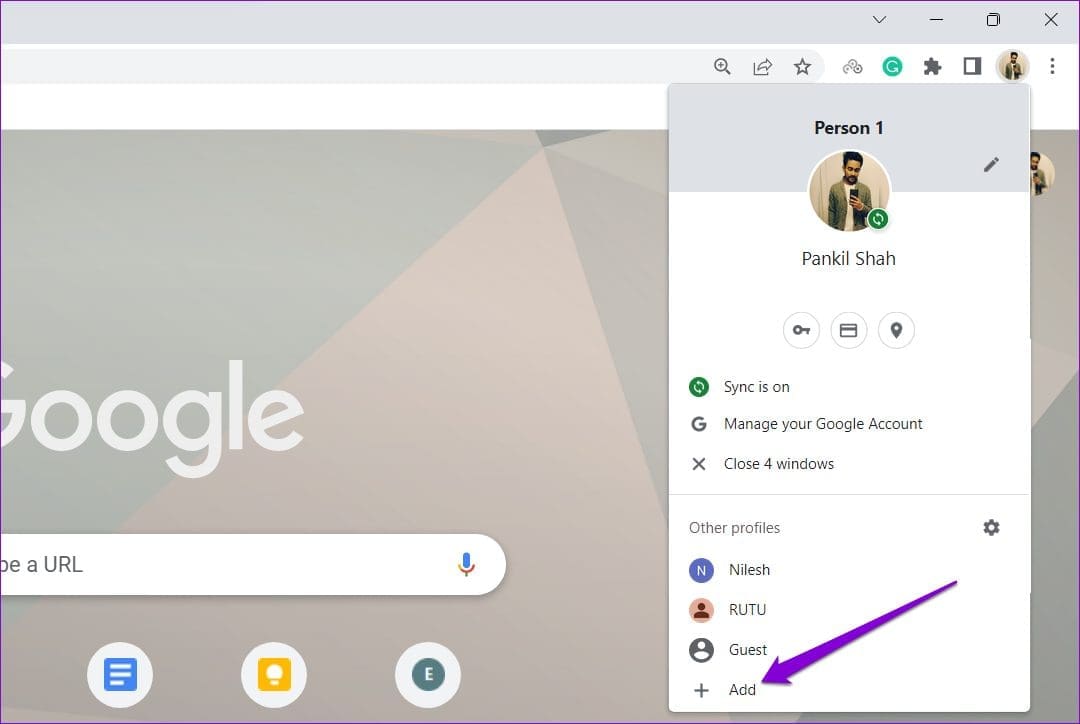
If the Preferences file is the issue, you can often fix it by using the “Reset Settings” feature in Chrome. This clears the JSON file while keeping your core data intact. However, if the corruption is deep within the SQLite databases, a full profile migration is necessary. Creating a new profile via the Chrome Profile Manager (the icon in the top right) allows you to start fresh while the “corrupted” profile remains isolated.
Selectively Deleting JSON and Database Files
A surgical approach is often better than a total reset. If you suspect the Web Data file is causing the crash, you can close Chrome and delete only that specific file. Chrome is designed to recreate missing core files upon launch (though they will be empty). This allows you to “sacrifice” your autofill data to save the rest of your profile. Similarly, deleting the Cookies file often resolves issues where Chrome crashes only when visiting specific websites.
Syncing as a Safety Net for Profile Migration
The most effective way to handle a file-level crash is to rely on Google Sync. If your data is synced to the cloud, you don’t need to worry about which file is broken. You can simply delete the entire User Data folder and sign back in. Chrome will download a fresh, uncorrupted version of your preferences, bookmarks, and extensions from Google’s servers, effectively bypassing the local file corruption entirely.
5. Prevention and Maintenance: Keeping Your Browser Stable
Fixing a crash is reactive; preventing one is proactive. Maintaining the health of your Chrome profile files ensures a smooth browsing experience and protects your digital assets.
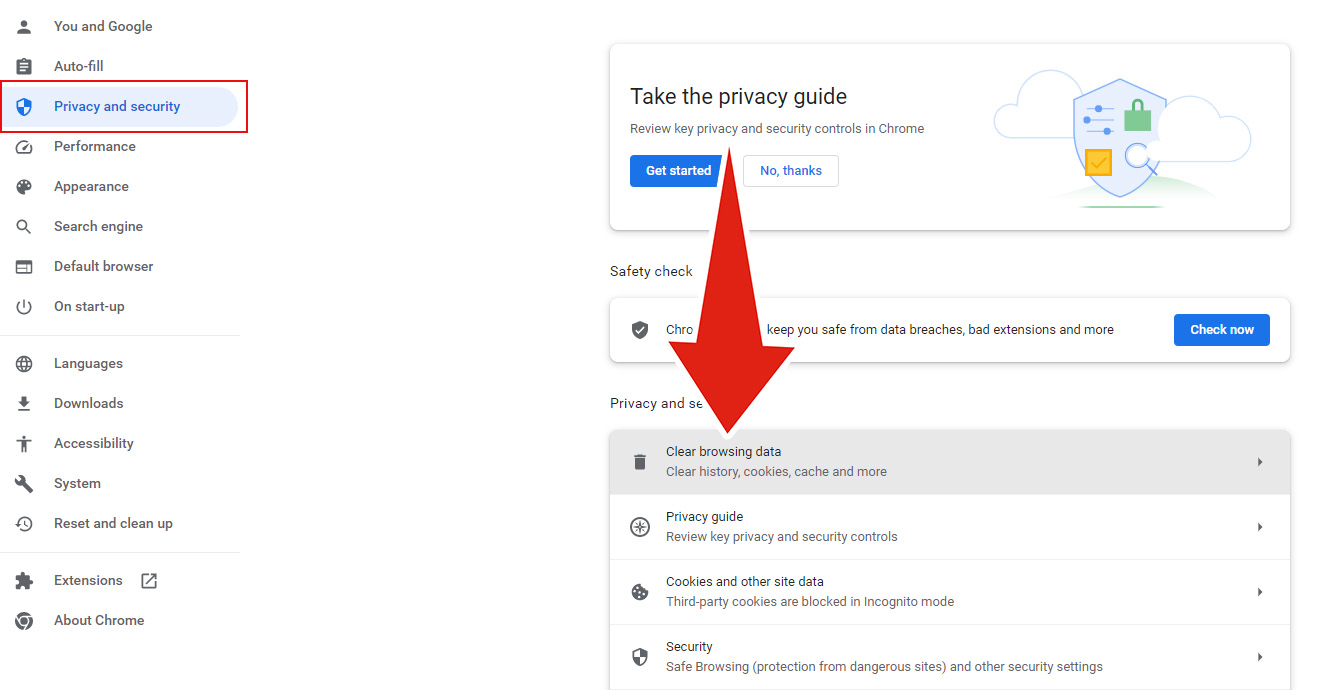
Regular Cache Management and Extension Audits
Over-accumulation of data is the primary cause of file corruption. When a database like History grows to several gigabytes, the likelihood of a write error increases. Periodically clearing your cache and removing extensions you no longer use keeps the profile directory lean. A smaller directory is not only faster but also less prone to the “file locked” errors that occur when third-party software (like antivirus scanners) tries to inspect your Chrome data.
Understanding the Impact of Third-Party Security Software
Sometimes, the “file causing the crash” is being manipulated by external forces. Antivirus programs often “sandbox” or lock files in the User Data folder to scan for threats. If the antivirus locks the Login Data file at the exact moment Chrome tries to read it, the browser may crash. Ensuring that your security software has an exclusion for Chrome’s profile path—or at least is not set to “Aggressive Scanning” on that directory—can prevent the file-level conflicts that lead to instability.
By treating your Chrome profile as a structured database rather than a mysterious black box, you can identify the specific files causing crashes with clinical precision. Whether it is a malformed Local State JSON file or a corrupted GPUCache, the ability to diagnose and repair these files is an essential skill in the modern digital toolkit.