
In the world of investing and financial markets, price is often the first thing that captures a trader’s attention. We watch the green and red candles flicker, tracking the ascent of a stock or the sudden plunge of a cryptocurrency. However, price only tells half the story. To understand the conviction behind a price movement, one must look at the “fuel” that drives the engine: volume.
Volume is a fundamental metric in technical analysis and market psychology. It serves as a measure of how much of a given financial asset has been traded within a specific period. Whether you are a day trader looking for quick scalps or a long-term investor seeking to build a robust portfolio, understanding volume is essential for identifying high-probability opportunities and avoiding costly “bull traps.”
Understanding the Fundamentals of Trading Volume
At its most basic level, trading volume represents the total number of shares, contracts, or units of an asset that change hands between buyers and sellers during a specific timeframe. If a trader buys 500 shares of a company and another trader sells those 500 shares, the total volume for that transaction is 500.
Defining Volume in Financial Markets
In the context of personal finance and investing, volume is the quantitative measure of market activity. Every time a transaction occurs, it is recorded. For the stock market, volume is usually reported as the number of shares traded. In the futures or options markets, it is reported as the number of contracts. In the decentralized world of foreign exchange (Forex) or certain crypto markets, “tick volume” is often used, which measures the frequency of price changes rather than the absolute number of units, though the principle remains the same: it measures intensity.
How Volume is Calculated and Reported
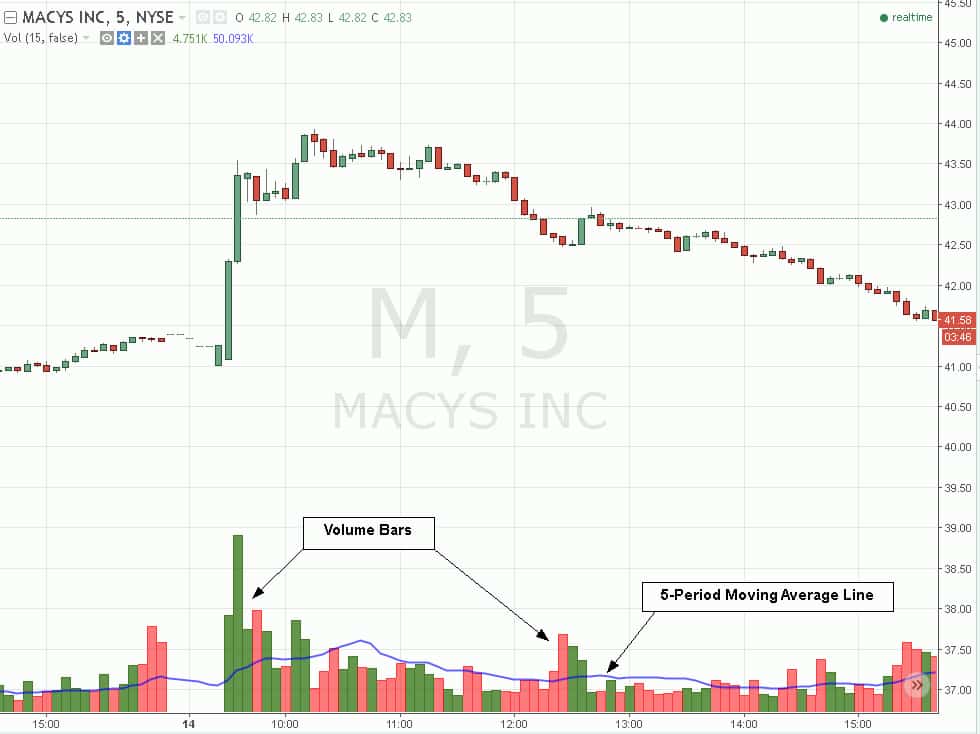
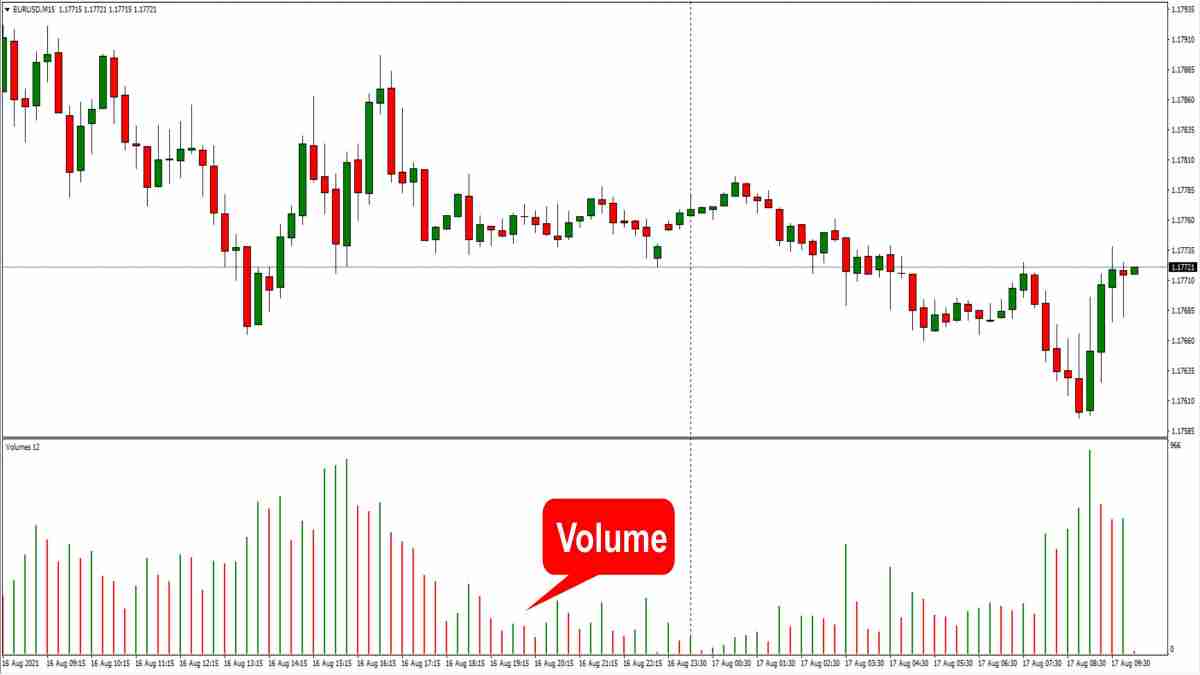
Volume is typically displayed as a histogram at the bottom of a price chart. Each vertical bar represents the amount of trading activity that occurred during the period of the corresponding price candle.
- Time-Specific Volume: Daily volume is the most common metric, representing the activity from market open to market close.
- Relative Volume (RVOL): This compares current volume to the average volume over a set period (e.g., the last 10 or 50 days). High relative volume is a signal that something significant is happening, drawing the eyes of institutional investors and retail traders alike.
Why Volume Matters: The Psychology of Market Participation
Volume is more than just a number; it is a reflection of human emotion and institutional intent. In the “Money” niche, we recognize that markets move based on the balance of supply and demand. Volume tells us how much “demand” or “supply” actually exists at a certain price point.
Confirming Price Trends
One of the primary uses of volume is to validate a price trend. For a healthy uptrend, volume should ideally increase as the price rises and decrease during temporary pullbacks. This suggests that buyers are aggressive and sellers are hesitant. If a price is reaching new highs but volume is declining, it indicates a “divergence.” This lack of participation suggests the trend may be losing steam and a reversal could be imminent.
Identifying Potential Reversals and Exhaustion
Volume often reaches a climax at the end of a long trend. A “blow-off top” occurs when prices skyrocket alongside massive volume, often fueled by retail FOMO (Fear Of Missing Out). Conversely, a “selling climax” happens when a sharp price drop is met with panic-level volume. In both cases, these spikes often signal that the last remaining buyers or sellers have entered the market, leaving no one left to push the price further in that direction, often leading to a sharp reversal.
Market Liquidity and Slippage
For the prudent investor, volume is a proxy for liquidity. High-volume assets, such as blue-chip stocks or major currency pairs, are highly liquid. This means you can enter and exit positions easily without significantly moving the market price. In low-volume “penny stocks” or obscure altcoins, a lack of volume leads to high “slippage”—where the price you actually get is much worse than the price you saw on the screen because there weren’t enough orders to fill your request.
Key Volume Indicators and How to Use Them
While looking at raw volume bars is helpful, financial experts often use volume-based indicators to smooth out the noise and find hidden patterns in the flow of money.

On-Balance Volume (OBV)
Developed by Joseph Granville, OBV is a cumulative indicator that adds volume on “up” days and subtracts it on “down” days. The goal is to see if volume is flowing into or out of a security. If the price is flat but OBV is rising, it suggests that “smart money” is accumulating the asset, and a price breakout may be coming.
Volume Price Trend (VPT)
The VPT indicator helps traders determine the strength of a trend. It combines the percentage change in price with the volume. This provides a more nuanced view than OBV because it accounts for the magnitude of the price move. A small price move on high volume carries less weight in this calculation than a large price move on high volume.
Chaikin Money Flow (CMF)
The Chaikin Money Flow focuses on the position of the closing price relative to the high and low of the range. It measures the amount of Money Flow Volume over a specific period (usually 20 or 21 days). A CMF value above zero is a bullish signal, indicating buying pressure, while a value below zero suggests selling pressure.
The Volume Profile
Unlike traditional volume which is displayed over time (horizontal axis), the Volume Profile is displayed over price (vertical axis). It shows the “Point of Control” (POC)—the price level where the most trading activity occurred. This helps investors identify areas of “value” where the market is comfortable, as well as “low-volume nodes” which the price might slice through quickly.
Practical Strategies for Trading with Volume
Integrating volume into a business or personal trading strategy requires a disciplined approach. It is rarely used in isolation; rather, it acts as a secondary confirmation for a primary thesis.
Volume Breakout Strategies
Many traders look for “breakouts” from resistance levels. A breakout that occurs on low volume is often a “fakeout,” where the price briefly moves above resistance before crashing back down. However, a breakout accompanied by a significant surge in volume (e.g., 2x or 3x the average) suggests that institutional buyers are behind the move, increasing the likelihood that the new trend will hold.
Using Volume as a Filter for False Signals
In technical analysis, indicators like the Relative Strength Index (RSI) or Moving Averages can sometimes give “whipsaw” signals. By using volume as a filter, a trader can ignore signals that lack participation. For example, if a “Hammer” candlestick pattern forms—suggesting a bullish reversal—but the volume on that candle is extremely low, a cautious investor might pass on the trade, waiting for a high-volume confirmation instead.
High-Volume Nodes vs. Low-Volume Areas
By studying the Volume Profile, an investor can identify “support” and “resistance” based on actual capital spent. A High-Volume Node (HVN) represents a price where a massive amount of exchanging occurred. If the price returns to this level, it often acts as a magnet or a strong floor because many participants have a “vested interest” at that price. Conversely, Low-Volume Nodes represent areas where price moved so fast that few trades were made; these often act as “gaps” that the market may quickly traverse in the future.
Integrating Volume into Your Broader Financial Strategy
Success in the financial markets is not just about picking the right direction; it is about risk management and understanding market structure. Volume is a cornerstone of this understanding.
Combining Volume with Technical Analysis
The most effective way to use volume is in conjunction with other tools. For instance, combining a Moving Average Crossover with an OBV breakout can provide a powerful “confluence” of signals. When multiple independent indicators point to the same conclusion, the statistical probability of a successful trade or investment increases.
Volume Analysis in Different Asset Classes
It is important to note that volume behaves differently across asset classes:
- Stocks: Volume is centralized and highly accurate, as trades are reported through exchanges like the NYSE or NASDAQ.
- Forex: Because there is no central exchange, “volume” is often estimated based on the number of price updates (ticks) from a specific broker.
- Cryptocurrency: Volume is fragmented across dozens of exchanges. Investors should look at “aggregate volume” to get a true sense of the global market’s conviction.
In conclusion, volume is the heartbeat of the market. It reveals the intensity of the struggle between buyers and sellers and provides the necessary context to interpret price movements. By mastering volume analysis, you move beyond merely watching the numbers change on a screen and begin to understand the flow of capital itself. For anyone serious about building wealth through the financial markets, volume is an indispensable tool in the pursuit of consistent, informed, and profitable decision-making.
aViewFromTheCave is a participant in the Amazon Services LLC Associates Program, an affiliate advertising program designed to provide a means for sites to earn advertising fees by advertising and linking to Amazon.com. Amazon, the Amazon logo, AmazonSupply, and the AmazonSupply logo are trademarks of Amazon.com, Inc. or its affiliates. As an Amazon Associate we earn affiliate commissions from qualifying purchases.