In the dynamic world of business, success isn’t just about having ambitious goals; it’s about meticulously tracking progress towards them. Key Performance Indicator (KPI) reports are the compass and sextant that guide organizations through the complexities of their operations, illuminating what’s working, what’s not, and where adjustments are most critical. These reports are not mere bureaucratic exercises; they are strategic tools that empower informed decision-making, drive accountability, and ultimately, foster sustainable growth.
Understanding the Core of KPI Reporting
At its heart, a KPI report is a document or a dashboard that visually displays the performance of specific, measurable metrics that are crucial to an organization’s success. These metrics, the Key Performance Indicators themselves, are carefully selected to represent the most important factors influencing an organization’s ability to achieve its strategic objectives. Without well-defined KPIs and the reports that track them, businesses would be navigating blindfolded, relying on gut feelings rather than concrete data.
Defining Key Performance Indicators (KPIs)
The term “Key Performance Indicator” breaks down into three critical components:
- Key: This signifies that the metric is of utmost importance. Not every metric is a KPI. KPIs are the select few that truly matter for achieving strategic goals. They are the vital signs of the business.
- Performance: This refers to the degree to which a company, an individual, or a specific activity is succeeding or failing. Performance is what is being measured.
- Indicator: This means that the metric is a sign or a signal of something else. A KPI indicates the status or progress of a business objective.
Essentially, a KPI is a quantifiable measure used to evaluate the success of an organization, employee, or specific activity in meeting objectives for performance. These objectives should be aligned with the overall strategic goals of the business. For instance, if a company’s strategic goal is to increase market share, a relevant KPI might be “percentage of market share gained.”
The Purpose and Value of KPI Reports
The primary purpose of a KPI report is to translate raw data into actionable insights. They provide a clear, concise overview of how well the organization is performing against its set targets. This clarity is invaluable for several reasons:
- Informed Decision-Making: By presenting data in an easily digestible format, KPI reports allow leaders and teams to make informed decisions. Instead of guessing, they can rely on evidence to determine where to allocate resources, what strategies to adjust, or where new opportunities lie.
- Performance Monitoring and Evaluation: KPI reports offer a continuous feedback loop. They enable organizations to monitor their progress over time, identify trends, and evaluate the effectiveness of different initiatives. This is crucial for staying agile and responsive in a constantly changing market.
- Accountability: When KPIs are clearly defined and linked to specific individuals or teams, they foster a sense of accountability. Everyone understands what they are responsible for and how their performance contributes to the larger organizational goals.
- Goal Alignment: KPI reports ensure that everyone in the organization is working towards the same overarching objectives. By focusing on the metrics that matter, they help to align individual and team efforts with the company’s strategic direction.
- Identifying Areas for Improvement: Perhaps the most significant value of KPI reports lies in their ability to highlight weaknesses and areas that require improvement. By pinpointing underperforming metrics, organizations can proactively address issues before they escalate into major problems.
Structuring an Effective KPI Report
The effectiveness of a KPI report hinges not only on the quality of the data it contains but also on its presentation. A well-structured report is easy to understand, visually appealing, and provides immediate insights. The best reports are tailored to their audience and their specific needs.
Key Components of a Standard KPI Report

While the specific content can vary, most effective KPI reports include the following essential elements:
- Title and Date: A clear title indicating the report’s purpose and the period it covers.
- Executive Summary/Overview: A brief, high-level summary of the key findings, highlighting the most critical performance indicators and any major achievements or concerns. This is for busy executives who need to grasp the essence quickly.
- Key Performance Indicators (KPIs): The core of the report, presenting the selected KPIs. Each KPI should ideally include:
- KPI Name: A clear and descriptive name.
- Current Value: The actual performance achieved for the KPI.
- Target Value: The desired or benchmark performance.
- Trend: How the KPI has performed over previous periods (e.g., increasing, decreasing, stable).
- Variance: The difference between the current value and the target value.
- Status Indicator: Often a visual cue (e.g., green for on track, yellow for caution, red for off track) to quickly communicate performance.
- Data Visualization: Charts, graphs, and dashboards are crucial for making data understandable at a glance. Bar charts, line graphs, pie charts, and heatmaps can all be used effectively to illustrate trends, comparisons, and distributions.
- Analysis and Interpretation: This section provides context and meaning to the data. It explains why certain KPIs are performing as they are, offering insights into the underlying causes and contributing factors.
- Actionable Recommendations: The most valuable KPI reports don’t just present data; they suggest concrete steps to be taken. These recommendations should be specific, measurable, achievable, relevant, and time-bound (SMART).
- Methodology (Optional but Recommended): A brief explanation of how the data was collected and calculated can add credibility and transparency.
Choosing the Right Visualizations for Clarity
The way data is presented can make or break a KPI report. The goal is to make complex information accessible and actionable.
- Line Charts: Ideal for showing trends over time. They are perfect for tracking metrics like website traffic, sales revenue over months, or customer acquisition cost.
- Bar Charts: Excellent for comparing discrete categories or showing performance against targets. They can be used to compare sales figures across different regions or to show the achievement of quarterly goals.
- Pie Charts: Best suited for illustrating proportions of a whole. They can be used to show the breakdown of marketing budget allocation or customer demographics, though they are less effective for showing trends.
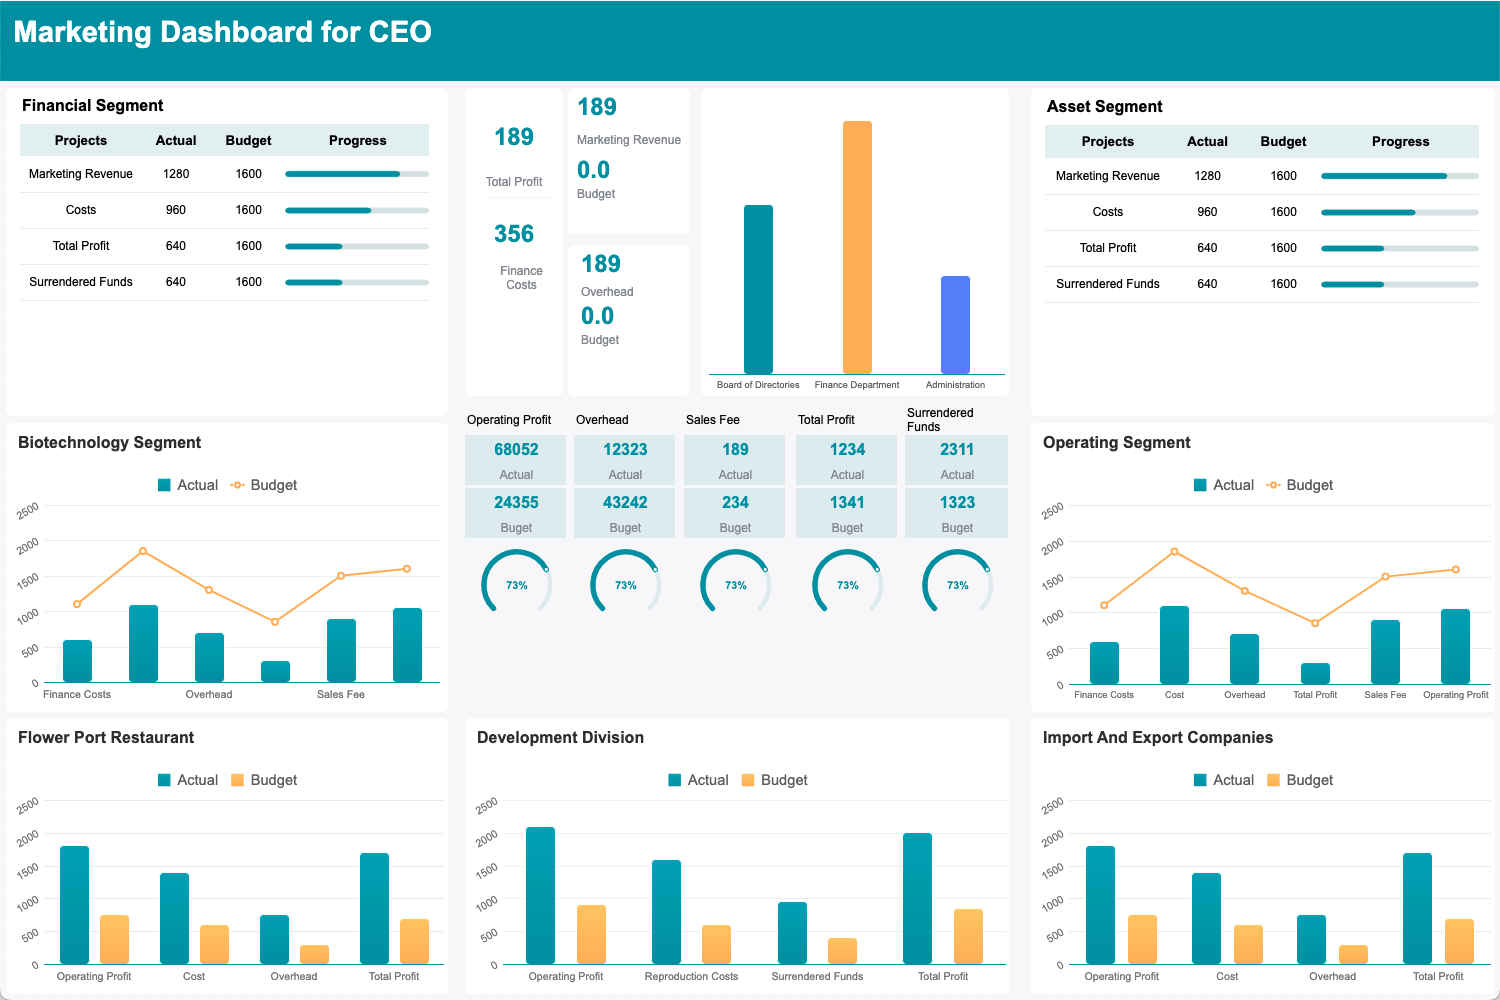
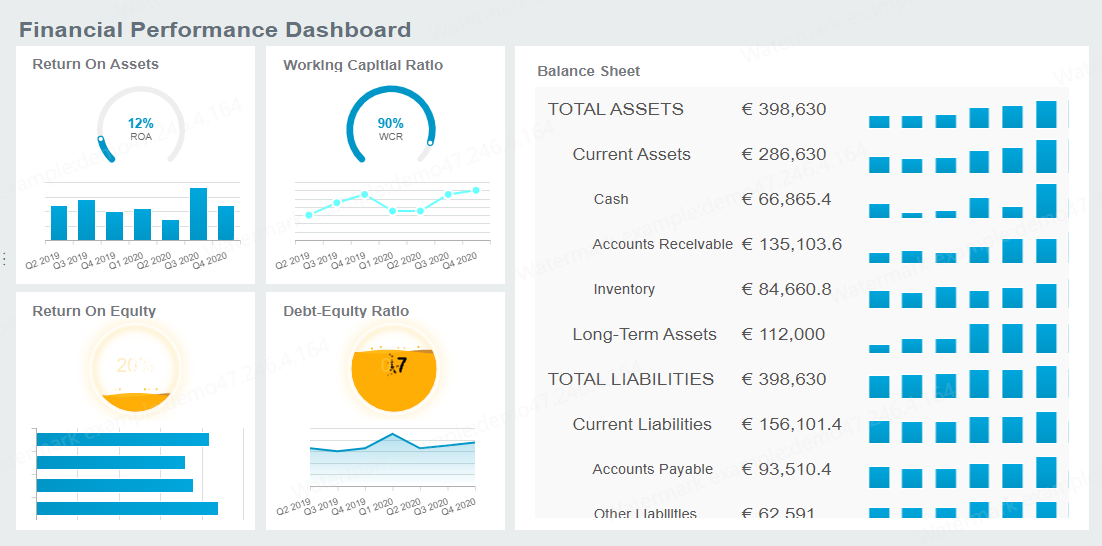
- Scorecards/Dashboards: These provide a consolidated view of multiple KPIs, often using color-coded indicators for quick assessment. They are the go-to for a comprehensive, at-a-glance understanding of overall performance.
- Gauges: Similar to car dashboards, gauges provide a visual representation of a KPI’s status relative to a target, often with a needle indicating the current level.
Implementing and Leveraging KPI Reports for Business Success
Simply creating a KPI report is only half the battle. The true value is realized when these reports are actively used to drive improvement and strategic adjustments.
The Process of KPI Reporting: From Data to Action
The journey of a KPI report involves several critical stages:
- Define Objectives: Clearly articulate the strategic goals the organization aims to achieve.
- Identify Relevant KPIs: Select a focused set of measurable indicators that directly correlate with these objectives. Avoid overwhelming the report with too many metrics. The principle of “less is more” often applies here.
- Establish Data Collection Methods: Determine how the data for each KPI will be gathered, ensuring accuracy and consistency. This might involve CRM systems, financial software, website analytics, or manual tracking.
- Set Targets and Benchmarks: Define realistic yet challenging targets for each KPI. Benchmarks, whether historical or industry-wide, provide context for performance evaluation.
- Develop Reporting Frequency: Decide how often reports will be generated (daily, weekly, monthly, quarterly) based on the nature of the KPI and the speed at which decisions need to be made.
- Create and Distribute Reports: Design the report format, incorporate visualizations, and ensure clear analysis and recommendations. Distribute the reports to the relevant stakeholders.
- Review and Discuss: Schedule regular meetings to review KPI reports. This is where the data is discussed, insights are shared, and action plans are formulated.
- Take Action and Follow Up: Implement the decided-upon actions and monitor their impact on the KPIs. The reporting cycle then begins anew with a focus on the results of these actions.
Best Practices for Maximizing the Impact of KPI Reports
To ensure that KPI reports are not just documents gathering dust, organizations should adhere to certain best practices:
- Keep it Simple and Focused: Avoid overwhelming stakeholders with too much data. Focus on the most critical KPIs that truly reflect progress towards strategic goals.
- Ensure Data Accuracy and Reliability: The credibility of any report depends on the accuracy of its data. Implement robust data validation processes.
- Make it Actionable: Reports should clearly indicate what needs to be done. If a KPI is underperforming, the report should suggest potential reasons and actionable steps.
- Tailor to the Audience: A report for the executive board will differ from a report for a specific department. Customize the content, level of detail, and visualizations accordingly.
- Promote Transparency and Communication: Share reports widely within the organization to foster a shared understanding of performance and goals. Encourage open discussion and feedback.
- Regularly Review and Update KPIs: Business objectives and market conditions evolve. Periodically review the relevance of your KPIs and update them as necessary to ensure they remain aligned with current strategies.
- Integrate with Business Processes: KPI reporting should not be a standalone activity. It should be integrated into regular business operations, decision-making frameworks, and performance management systems.
In conclusion, KPI reports are indispensable tools for any organization striving for clarity, efficiency, and growth. By carefully defining, tracking, and analyzing key performance indicators, businesses can gain invaluable insights into their operations, make data-driven decisions, and ultimately, steer themselves towards achieving their most ambitious objectives. They transform abstract goals into concrete, measurable progress, providing the roadmap for sustained success in today’s competitive landscape.
aViewFromTheCave is a participant in the Amazon Services LLC Associates Program, an affiliate advertising program designed to provide a means for sites to earn advertising fees by advertising and linking to Amazon.com. Amazon, the Amazon logo, AmazonSupply, and the AmazonSupply logo are trademarks of Amazon.com, Inc. or its affiliates. As an Amazon Associate we earn affiliate commissions from qualifying purchases.