In the world of finance, numbers are the language of progress. Whether you are tracking the growth of a retirement account, evaluating the performance of a stock portfolio, or managing the overhead costs of a small business, understanding how to calculate and interpret “percent change” is fundamental. It is the bridge between raw data and actionable insights. Without it, a $5,000 gain remains a mere figure; with it, you realize that $5,000 represents a 50% return on a $10,000 investment—a monumental success—or a 0.5% return on a million-dollar fund, which suggests a need for a strategy pivot.
To find the percent change is to understand the velocity of your money. This guide explores the mathematical foundations of percent change within the “Money” niche, moving from basic calculations to advanced applications in investing, business scaling, and economic analysis.
1. The Mathematical Foundation: How to Calculate Percent Change
Before applying the concept to complex financial instruments, one must master the basic formula. Percent change measures the relative difference between an old value and a new value, expressed as a fraction of the original amount.
The Universal Formula
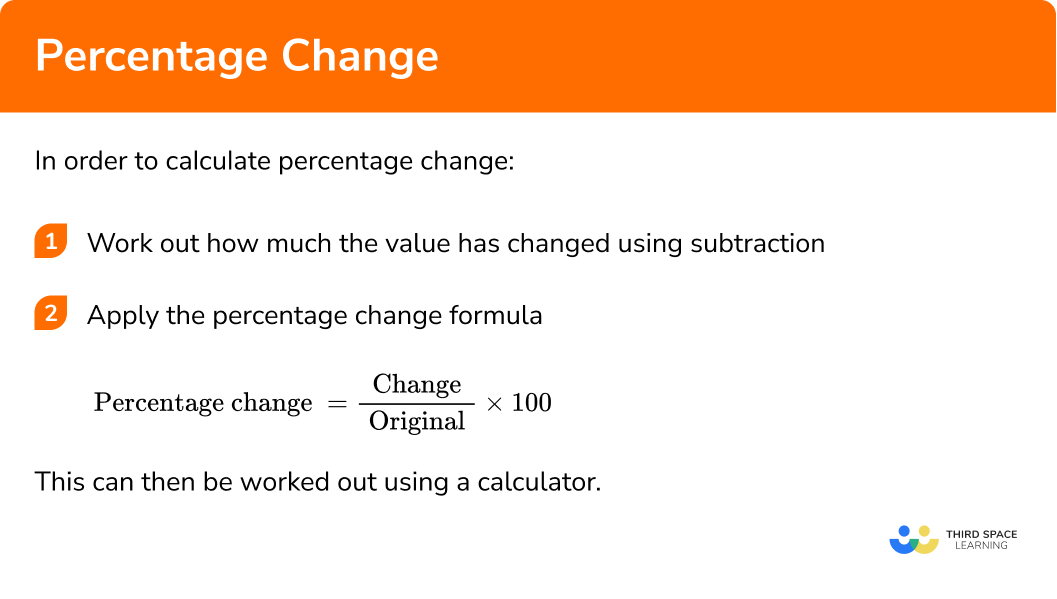
The formula for finding percent change is straightforward but requires precision:
((New Value – Old Value) / |Old Value|) × 100
- Subtract the original value (Old) from the current value (New). This result is the “absolute change.”
- Divide that absolute change by the original value.
- Multiply by 100 to convert the decimal into a percentage.
Interpreting Positive vs. Negative Results
In personal finance, the direction of the change is just as important as the magnitude. A positive result indicates a “percent increase,” such as a rise in stock price or a salary bump. A negative result indicates a “percent decrease,” commonly seen in market corrections or a reduction in household debt. Understanding this sign is the first step in assessing the health of your financial trajectory.
Avoiding the “Base Effect” Trap
One of the most common pitfalls in financial analysis is ignoring the “base” from which a change is calculated. For instance, if a stock drops by 50%, it requires a 100% gain just to return to its original price. This asymmetry is why high volatility can be damaging to long-term wealth; large percentage losses require exponentially larger percentage gains to recover.
2. Percent Change in Investing: Measuring ROI and Volatility
For the modern investor, percent change is the primary tool used to compare apples to oranges. How do you compare a high-yield savings account to a tech stock or a piece of real estate? You look at the percentage return over a specific timeframe.
Calculating Return on Investment (ROI)
ROI is essentially the percent change of your capital. If you invested $20,000 in an index fund and its value grew to $26,000 over two years, your percent change (ROI) is 30%. However, professional investors often look deeper. They use the Compound Annual Growth Rate (CAGR) to understand the “smoothed” annual percent change, allowing them to compare the performance of assets held for different durations.
Understanding Market Volatility
Volatility is defined by the frequency and magnitude of percent changes in an asset’s price over time. A “volatile” asset like Bitcoin might see daily percent changes of +/- 5%, whereas a “stable” asset like a US Treasury bond might see changes of 0.01%. By calculating the standard deviation of these percentage changes, investors can assess risk. High percentage swings indicate high risk, which typically demands a higher potential reward to justify the investment.
The Nuance of Dividend Yields and Total Return
When finding the percent change in an investment’s value, many beginners forget to include dividends. A stock’s price might only increase by 2% (price return), but if it pays a 4% dividend, the “Total Return” percent change is actually 6%. For long-term wealth building, tracking the percent change of the total return is far more important than tracking the share price alone.
3. Business Finance: Tracking Growth and Operational Efficiency
For entrepreneurs and business owners, percent change is the pulse of the company. It is used to monitor everything from year-over-year (YoY) revenue growth to the reduction of operational expenses.
Year-Over-Year (YoY) and Month-Over-Month (MoM) Growth
In business finance, looking at a single month’s revenue is rarely helpful. Instead, owners calculate the percent change between the current month and the same month in the previous year. This “YoY” calculation accounts for seasonality. For example, a retail business may see a 200% MoM increase in December due to the holidays, but a 5% YoY increase compared to last December gives a more accurate picture of whether the business is truly expanding.
Margin Analysis and Cost Control
Percent change is also vital for managing the “bottom line.” If your revenue increases by 10% but your costs of goods sold (COGS) increase by 15%, your profit margins are shrinking. By finding the percent change in expenses relative to the percent change in income, a business owner can identify “margin compression.” Effective financial management involves ensuring that the percent change in revenue outpaces the percent change in expenses.
Customer Acquisition Cost (CAC) and Lifetime Value (LTV)
Scaling a business requires a deep dive into unit economics. If the percent change in your Customer Acquisition Cost starts to trend upward without a corresponding increase in the Lifetime Value of a customer, the business model may become unsustainable. Savvy financial officers track these percentage shifts weekly to optimize marketing spend and pricing strategies.
4. Economic Context: Inflation and Purchasing Power
On a macro level, percent change dictates the cost of living and the “real” value of money. Even if your nominal wealth is increasing, a negative percent change in your purchasing power can leave you poorer in real terms.
The Consumer Price Index (CPI) and Inflation
Inflation is simply the percent change in the price of a basket of goods and services over time. If the inflation rate is 7%, it means the “Old Value” of a dollar has decreased in terms of what it can buy. To maintain your standard of living, your income must see a percent change that is equal to or greater than the rate of inflation. This is often referred to as a “Cost of Living Adjustment” (COLA).
Real vs. Nominal Returns
This is where many personal finance journeys go off track. If your savings account offers a 4% interest rate (nominal percent change), but inflation is 5%, your “real” percent change is -1%. In this scenario, you are losing purchasing power despite the “New Value” in your bank account being higher than the “Old Value.” Understanding how to find the real percent change by subtracting inflation from nominal gains is a hallmark of financial literacy.
The Rule of 72
A useful shortcut related to percent change is the “Rule of 72.” If you know the annual percent change (interest rate) of an investment, you can divide 72 by that number to estimate how many years it will take for your money to double. For example, an investment with a 10% annual percent change will double in approximately 7.2 years. This illustrates the power of compounding—where the percent change is applied to an ever-increasing base.
5. Practical Tools for Managing Financial Percent Change
While the formula can be calculated on a napkin, the “Money” niche relies on specific tools to automate these insights for better decision-making.
Excel and Google Sheets Applications
For most personal finance enthusiasts, spreadsheets are the go-to tool. Using the formula =(B2-A2)/A2 and formatting the cell as a percentage allows for instant tracking of budget variances or portfolio shifts. Advanced users utilize “Pivot Tables” to see the percent change across different categories of spending, identifying where “lifestyle creep” might be draining their savings.
Financial Dashboards and Fintech Apps
Modern apps like Mint, YNAB, or brokerage platforms like Vanguard and Fidelity provide “time-weighted” and “money-weighted” percent changes automatically. These tools allow investors to see their “Personal Rate of Return,” which accounts for the specific timing of their deposits and withdrawals—a calculation that is significantly more complex than the basic percent change formula but essential for understanding true financial performance.

The Psychological Aspect of Percentage Tracking
Finally, it is important to acknowledge the psychological impact. In finance, we are often biased by “Loss Aversion.” Research shows that the pain of a 10% decrease in portfolio value is felt twice as strongly as the joy of a 10% increase. By focusing on the objective percent change rather than the emotional “dollar amount,” investors can remain disciplined during market downturns, avoiding the temptation to panic-sell when the percentage suggests a standard market correction rather than a total collapse.
Summary
Finding the percent change is more than a mathematical exercise; it is an essential skill for anyone serious about managing money. By applying the formula ((New - Old) / Old) * 100 to your investments, business metrics, and purchasing power, you gain a clear, objective view of your financial health. In a world of fluctuating markets and shifting economic tides, the ability to calculate and interpret these percentages is the difference between guessing and growing. Whether you are aiming for a 10% increase in your savings rate or evaluating a 5% dividend yield, the percent change remains the ultimate metric of progress.