In the fast-paced world of modern finance, the question “How’s the stock market doing today?” is more than just a casual inquiry; it is a pulse check on the global economy, a reflection of investor sentiment, and a catalyst for strategic decision-making. For the seasoned investor and the curious novice alike, understanding the daily movements of the market requires peering beneath the surface of green and red tickers to understand the underlying mechanics of capital flow.
The state of the market on any given day is rarely the result of a single event. Instead, it is a complex tapestry woven from macroeconomic data, corporate performance, geopolitical shifts, and the collective psychology of millions of participants. To truly answer how the market is performing, one must look at the indices, the sectors, and the broader economic indicators that dictate the rhythm of Wall Street.
1. Decoding Market Sentiment: Beyond the Daily Ticker
When people ask how the market is doing, they are usually referring to the performance of the major indices. However, a single number—like the Dow Jones Industrial Average—rarely tells the full story. Understanding market sentiment requires a multi-dimensional approach to how we measure success and failure in the equities space.
The Role of Major Indices
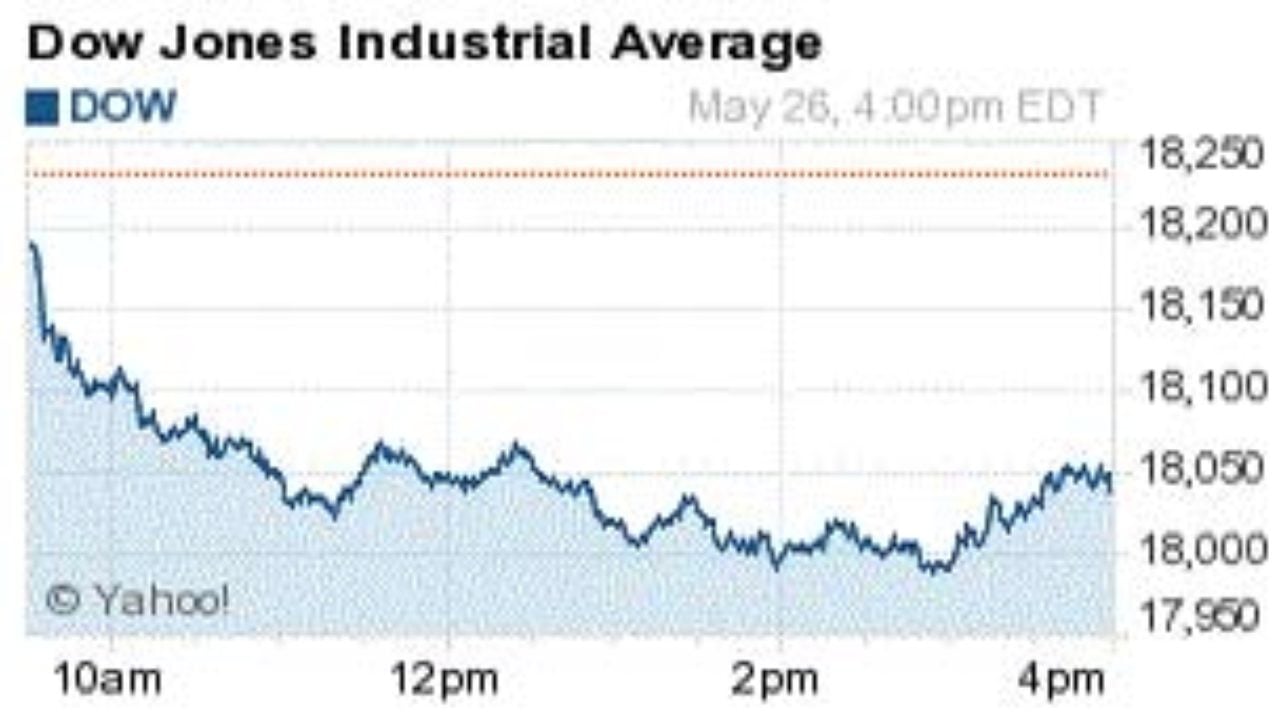
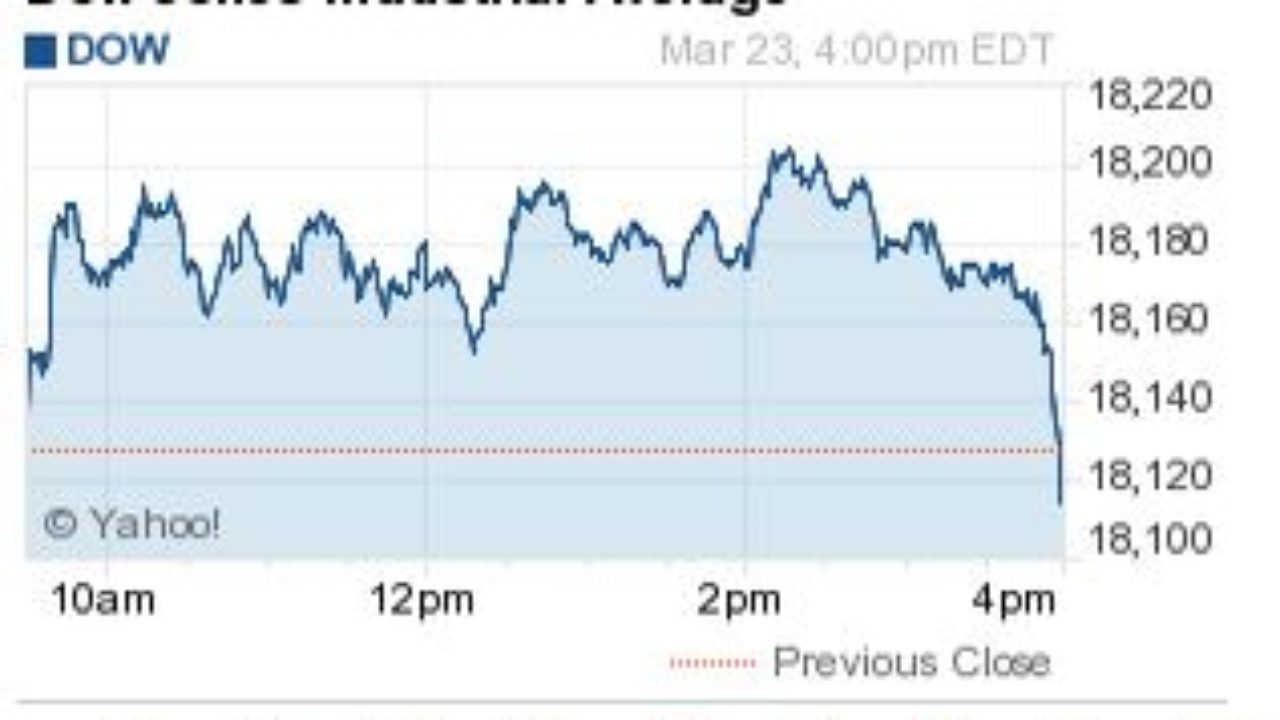
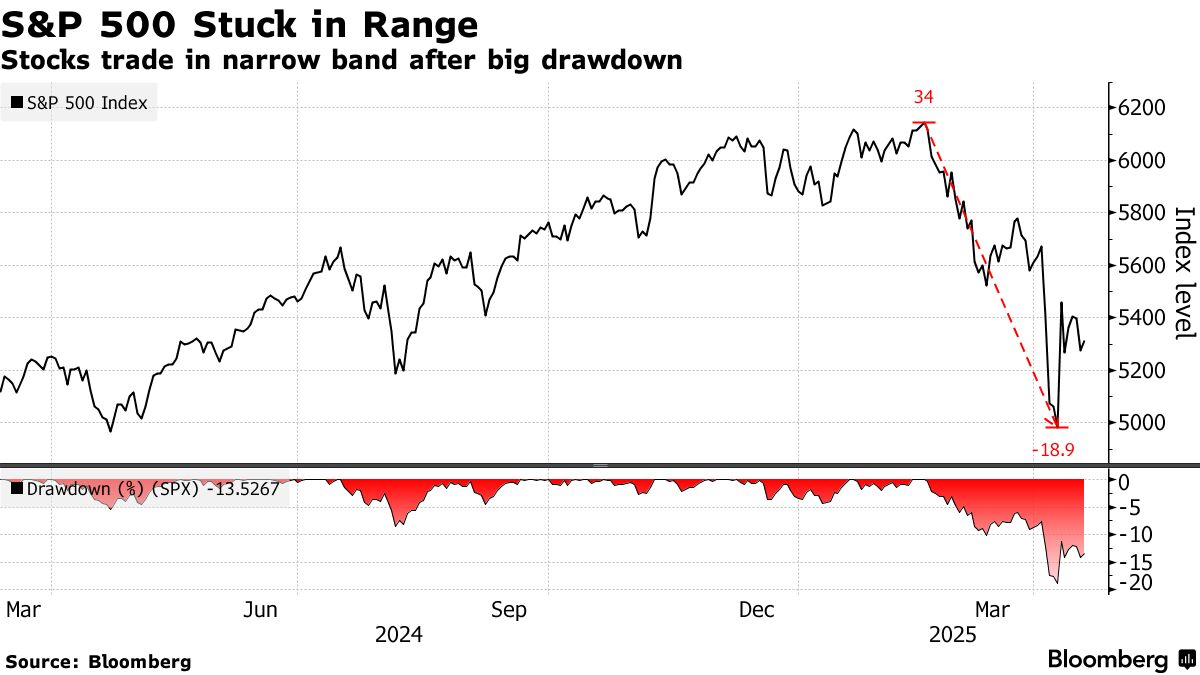
The three primary benchmarks in the United States—the S&P 500, the Dow Jones Industrial Average (DJIA), and the Nasdaq Composite—each tell a different story. The S&P 500 is widely considered the most accurate representation of the overall U.S. economy, tracking 500 of the largest publicly traded companies. If the S&P 500 is up, it generally indicates broad-based confidence.
The Dow, consisting of 30 “blue-chip” companies, offers a glimpse into the industrial and consumer-focused giants, while the Nasdaq is heavily weighted toward technology and growth stocks. On days when “the market” is doing well but the Nasdaq is down, it suggests a rotation away from tech and toward more defensive or value-oriented sectors.
The Psychology of Fear and Greed
Market performance is often driven by the “Fear and Greed Index.” This sentiment gauge measures whether investors are feeling adventurous or protective. On a “good” day, greed (or confidence) drives prices up as investors seek returns. On “bad” days, fear takes over, often sparked by uncertainty. Understanding where we sit on this spectrum helps investors determine if today’s market movement is a fundamental shift or a temporary emotional reaction.
Market Breadth and Participation
A healthy market isn’t just one where the indices are high; it’s one where “breadth” is positive. Market breadth refers to the number of individual stocks participating in a move. If the S&P 500 is up 1% but only five massive tech stocks are rising while the other 495 are falling, the market is technically “doing well,” but its health is fragile. True market strength is characterized by broad participation across small-cap, mid-cap, and large-cap stocks.
2. Key Drivers Shaping Today’s Financial Landscape
The stock market does not exist in a vacuum. Every price movement is a reaction to data points that signal the health of the broader financial ecosystem. To understand today’s performance, one must look at the catalysts currently at play.
Macroeconomic Factors: Inflation and Interest Rates
In the current era, the Federal Reserve is the most significant influencer of market daily activity. Investors obsess over the Consumer Price Index (CPI) and other inflation metrics. If inflation remains high, the market often reacts poorly because it signals that interest rates will stay higher for longer. High interest rates increase the cost of borrowing for companies and consumers, which can dampen corporate profits and slow economic growth. Conversely, any sign that the Fed might “pivot” or cut rates usually sends the market into a rally.
Corporate Earnings Reports
Four times a year, during “earnings season,” the question of how the market is doing becomes hyper-focused on individual company performance. When heavyweight companies—such as those in the “Magnificent Seven”—report earnings that beat analyst expectations, they can lift the entire index. However, the market is forward-looking. A company can report record profits, but if its “guidance” (its prediction for future performance) is weak, its stock—and the broader sector—may fall.
Geopolitical and Global Events
We live in an interconnected global economy. A political crisis in Europe, a change in oil production levels in the Middle East, or trade negotiations in Asia can instantly impact U.S. markets. These “exogenous shocks” often cause spikes in volatility. Investors watch these events to gauge the stability of global supply chains and energy costs, both of which are intrinsic to corporate profitability.
3. Technical Indicators Every Investor Should Watch
To move beyond the headlines, savvy investors utilize technical indicators to assess the market’s internal momentum. These tools provide a more objective answer to how the market is doing by filtering out the noise of the news cycle.
Moving Averages and Trendlines
One of the simplest ways to judge the market’s health is by looking at moving averages, specifically the 50-day and 200-day moving averages. If the major indices are trading above their 200-day moving average, the market is considered to be in a long-term uptrend. If it dips below, it may signal the start of a “bearish” phase. Today’s performance is often judged by whether the market is “testing” these support levels or breaking out above resistance.
The VIX: The “Fear Gauge”
The CBOE Volatility Index (VIX) is a real-time market index that represents the market’s expectation of 30-day forward-looking volatility. Derived from S&P 500 index options, it is often called the “fear gauge.” When the VIX is low (typically below 20), the market is generally calm and trending upward. When the VIX spikes, it indicates that investors are buying protection against a potential drop, suggesting that while the market might be “doing fine” at the moment, there is significant anxiety under the surface.
Volume and Liquidity
Price movement without volume is often viewed with skepticism. Volume represents the number of shares traded. If the market is up on high volume, it suggests that institutional investors (the “big money”) are buying in, which adds validity to the move. If the market is up on low volume, it may be a “dead cat bounce” or a temporary fluctuation that lacks the conviction of major players.
4. Navigating Volatility: Strategic Responses to Market Fluctuations
Knowing how the market is doing is only half the battle; knowing how to react to that information is what separates successful investors from the rest. Market volatility is an inherent part of investing, and today’s performance should always be viewed through the lens of a long-term strategy.
Dollar-Cost Averaging (DCA)
For many investors, the daily “noise” of the market is irrelevant due to a strategy called Dollar-Cost Averaging. By investing a fixed amount of money at regular intervals, regardless of the market’s price, you buy more shares when prices are low and fewer when prices are high. This mitigates the risk of “timing the market” and turns a “bad” market day into an opportunity to lower your average cost basis.
The Importance of Asset Allocation
A well-diversified portfolio is the best defense against a volatile market. If your portfolio is exclusively focused on high-growth tech stocks, a bad day for the Nasdaq will feel catastrophic. However, by diversifying across different asset classes—such as bonds, real estate (REITs), international equities, and commodities—you can cushion the blow of a downturn in any single sector. Asset allocation ensures that your financial health isn’t tied to the whims of a single industry’s daily performance.
Avoiding Emotional Trading
The greatest enemy of the individual investor is often their own emotion. On days when the market is “doing poorly,” the impulse to sell and “save” what is left is strong. Conversely, on days when the market is “doing great,” the “Fear Of Missing Out” (FOMO) leads people to buy in at the top. Professional investing requires a disciplined approach that adheres to a pre-determined plan, treating daily fluctuations as data points rather than calls to emotional action.
5. Tools and Resources for Real-Time Market Analysis
In the digital age, information is democratized. Anyone with a smartphone has access to the same basic data as a Wall Street trader. However, the key is knowing which tools provide the most value for understanding the market’s daily status.
Professional Platforms vs. Retail Apps
While retail apps like Robinhood or Fidelity provide excellent overviews, more advanced investors often turn to platforms like Bloomberg, Reuters, or Yahoo Finance Plus for deeper dives into “Level 2” market data. These tools offer insights into the “bid-ask spread” and the “order book,” showing exactly where the buying and selling pressure is concentrated.
Financial News Literacy
To understand how the market is doing, one must be able to filter through financial news. It is important to distinguish between “hard data” (like an unemployment report) and “commentary” (an analyst’s opinion). Learning to read the “Wall Street Journal,” “Barron’s,” or “The Financial Times” helps investors understand the narrative that the market is currently following.
The Role of Financial Calendars
Every investor should keep a financial calendar. Knowing that the “Jobs Report” is coming out on Friday or that the Federal Open Market Committee (FOMC) is meeting next Wednesday explains why the market might be “flat” or “choppy” today. Often, the market does very little as it waits for “big data” to be released, and understanding this context prevents unnecessary concern over a stagnant day.
In conclusion, “How’s the stock market doing today?” is a question that requires looking at the intersection of data, psychology, and strategy. Whether the indices are up or down, the most important factor is how that movement aligns with your personal financial goals. By focusing on fundamental drivers, technical health, and disciplined investment strategies, you can navigate the market’s daily fluctuations with confidence and clarity.
aViewFromTheCave is a participant in the Amazon Services LLC Associates Program, an affiliate advertising program designed to provide a means for sites to earn advertising fees by advertising and linking to Amazon.com. Amazon, the Amazon logo, AmazonSupply, and the AmazonSupply logo are trademarks of Amazon.com, Inc. or its affiliates. As an Amazon Associate we earn affiliate commissions from qualifying purchases.