The question “what’s the stock market doing today?” is perhaps the most frequent inquiry in the world of finance. For some, it is a casual check of a smartphone notification; for others, it is a deep dive into real-time charts, economic indicators, and geopolitical news. However, understanding what the market is “doing” requires more than just looking at whether a number is green or red. It involves deciphering the complex interplay of investor sentiment, macroeconomic data, and corporate performance.
In this guide, we will break down the mechanics of daily market movements, the factors that drive price action, and how you can interpret these fluctuations to make more informed investment decisions.
The Primary Benchmarks: Measuring the Market’s Pulse
When people ask how the market is performing, they are usually referring to the major indices. These indices act as a shorthand for the health of the broader economy or specific sectors. Understanding the difference between them is the first step in contextualizing daily performance.
The S&P 500: The Institutional Standard
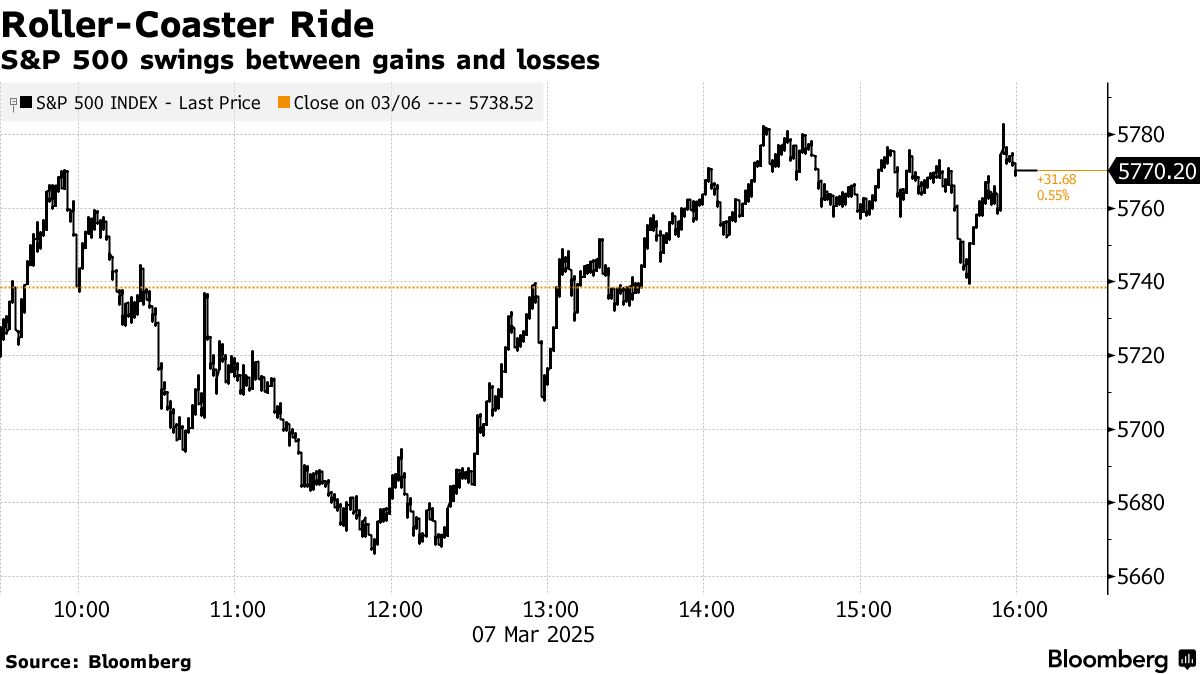
The Standard & Poor’s 500 is widely regarded as the best single gauge of large-cap U.S. equities. It includes 500 of the largest companies across various industries. Because it is market-capitalization weighted, the performance of massive companies like Microsoft, Apple, and Nvidia has a disproportionate impact on the index. When the S&P 500 is “up,” it generally suggests that the largest engines of the American economy are seeing capital inflows.
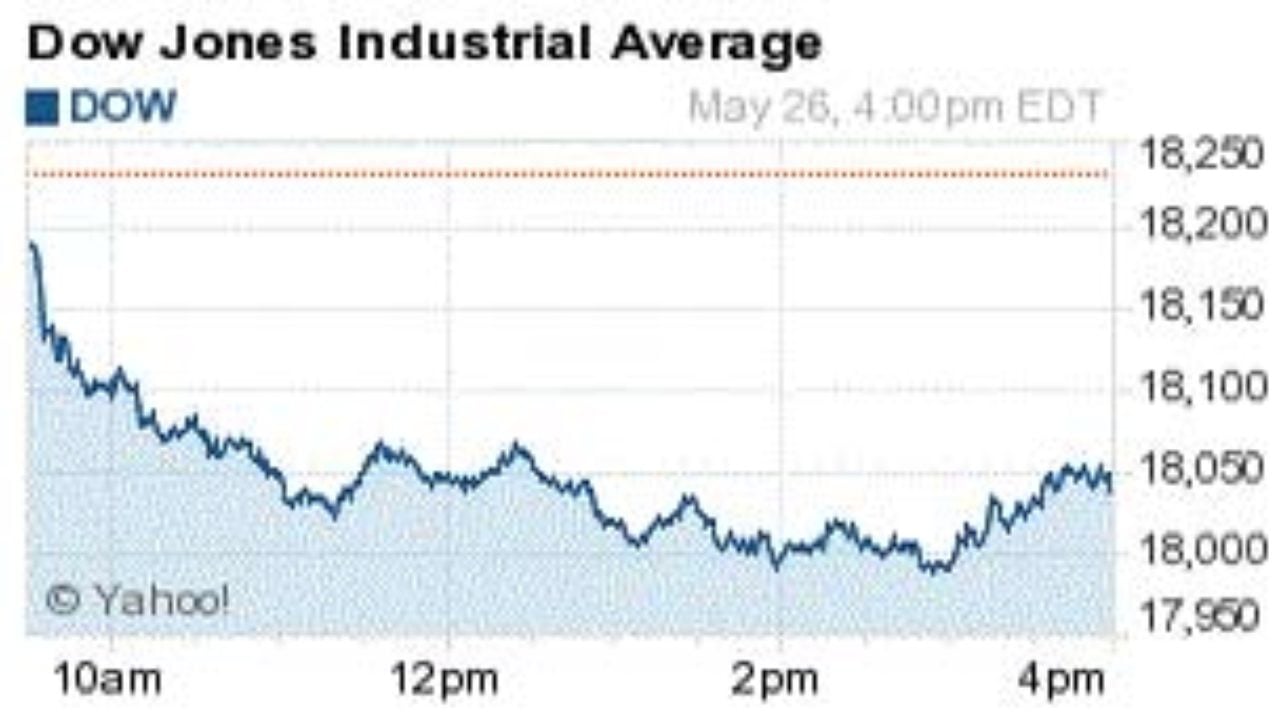
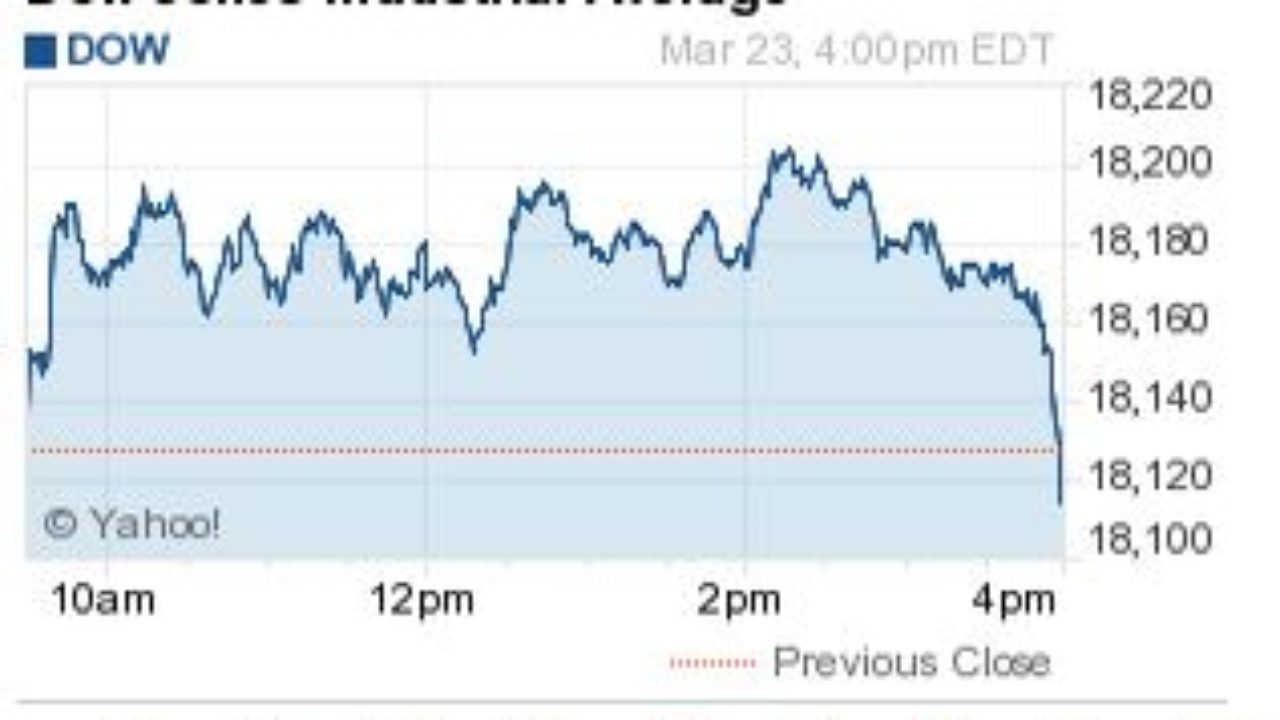
The Dow Jones Industrial Average: The Blue-Chip Pulse
The Dow is a price-weighted index of 30 prominent companies listed on stock exchanges in the United States. While it is the oldest and most famous index, it is less representative of the total market than the S&P 500 because it only tracks 30 stocks. If the Dow is doing well while the rest of the market is flat, it often indicates that investors are seeking “safety” in established, dividend-paying blue-chip companies.
The Nasdaq Composite: The Growth and Tech Barometer
The Nasdaq is heavily weighted toward the technology and growth sectors. If the Nasdaq is outperforming the other indices today, it typically suggests a high “risk-on” sentiment, where investors are optimistic about future earnings and technological innovation. Conversely, if the Nasdaq is lagging, it often points to concerns over rising interest rates, which tend to hurt growth-oriented companies more than value-oriented ones.
The Engines of Volatility: What Moves the Needle?
Daily fluctuations are rarely random. They are usually reactions to new information that changes the perceived value of future cash flows. To understand what the market is doing today, you must look at the “catalysts” currently in play.
Monetary Policy and the Federal Reserve
In the modern financial era, the Federal Reserve (the Fed) is the most significant driver of market movement. Investors constantly scrutinize Fed speeches and meeting minutes to guess the future path of interest rates. Higher interest rates make borrowing more expensive for companies and make “risk-free” assets like Treasury bonds more attractive compared to stocks. If the market is down today, it may be because a Fed official hinted at keeping rates high for longer than expected.
Inflation and Economic Indicators
Markets react sharply to data releases such as the Consumer Price Index (CPI), the Producer Price Index (PPI), and employment reports like Non-Farm Payrolls (NFP). These reports tell the story of the economy’s temperature. If inflation data comes in “hotter” (higher) than expected, the market often retreats in fear of further interest rate hikes. If the job market remains unexpectedly strong, it can be a double-edged sword: good for the economy, but potentially bad for inflation control.
Geopolitical Events and Global Stability
The stock market hates uncertainty. Geopolitical tensions, trade disputes, or sudden changes in foreign policy can trigger immediate sell-offs as investors flee to “safe-haven” assets like gold or government bonds. Understanding today’s market action often requires looking beyond Wall Street to international headlines, as global supply chains ensure that a crisis in one part of the world impacts corporate bottom lines everywhere.
Earnings Season: The Corporate Reality Check
While macroeconomic trends provide the backdrop, individual company performance provides the substance. Four times a year, publicly traded companies release their quarterly earnings reports, which can lead to massive swings in the market.
Beating Expectations vs. Forward Guidance
A company might report record-breaking profits, yet its stock price could still drop on the same day. Why? Because the market is forward-looking. If a company’s “guidance”—its prediction for future performance—is weak, investors will sell the stock regardless of how well it did in the past quarter. When the market is “flat” overall but certain sectors are moving violently, it is often due to a cluster of influential earnings reports.
Sector Rotation: Where the Money is Flowing
By observing which sectors are winning and losing today, you can identify “sector rotation.” This is when institutional investors move money out of one industry (like Tech) and into another (like Energy or Utilities). If the market is doing “well” but only in defensive sectors like Healthcare and Staples, it suggests that big money is bracing for a potential downturn or recession.
The Impact of “The Magnificent Seven”
In the current market environment, a handful of mega-cap tech stocks—collectively known as the Magnificent Seven—have an outsized influence. On many days, “what the market is doing” is essentially just a reflection of what these seven companies are doing. If Apple and Microsoft are down, the S&P 500 will struggle to stay green, even if hundreds of smaller companies are seeing gains.
Identifying Market Sentiment and Trend Analysis
Beyond the hard data, the stock market is a manifestation of human psychology. Today’s price action is often a battle between fear and greed.
The VIX and the Fear & Greed Index
The CBOE Volatility Index (VIX), often called the “fear gauge,” measures the market’s expectation of 30-day volatility. A spiking VIX usually accompanies a falling market. Additionally, tools like the CNN Fear & Greed Index look at factors such as market momentum and “junk bond” demand to determine if investors are being overly cautious or dangerously exuberant.
Technical Levels and Support/Resistance
Many short-term movements are dictated by “technical analysis.” Traders look at specific price levels, such as the 50-day or 200-day moving averages. If the S&P 500 “breaks below” a major support level today, it can trigger automated sell orders, causing a downward spiral that isn’t necessarily tied to any specific news event. Knowing these levels helps you understand if today’s movement is a fundamental shift or just a technical correction.
Strategic Response: Navigating the Noise as an Investor
The most important part of asking “what’s the stock market doing today?” is knowing how to react—or, more importantly, when not to react.
Distinguishing Between Noise and Signal
For a long-term investor, 90% of daily market movement is “noise.” It is the result of high-frequency trading algorithms and short-term speculation. A “signal,” however, is a fundamental change that affects the long-term thesis of an investment. If the market is down 1% today because of a random rumor, that is noise. If it is down because of a systemic change in the global economy, that is a signal.
The Power of Emotional Discipline
The biggest threat to wealth creation isn’t a market crash; it’s the investor’s reaction to it. Selling during a “red day” often locks in losses and prevents you from participating in the inevitable recovery. Successful investors use daily market updates to stay informed, but they rely on their long-term financial plans to make decisions.
Practical Steps for Real-Time Analysis
To get a clear picture of today’s market without feeling overwhelmed, follow a structured routine:
- Check the Benchmarks: Look at the S&P 500, Nasdaq, and Dow.
- Look for the Catalyst: Check the economic calendar for Fed meetings or CPI releases.
- Check the Yields: Look at the 10-year Treasury yield. If it’s rising fast, stocks are usually under pressure.
- Verify Volume: Significant moves on high trading volume are more meaningful than moves on low volume.
Conclusion
The stock market is a living, breathing entity that reflects the collective expectations of millions of participants. When you ask “what’s the stock market doing today?”, you are really asking about the current state of global confidence. By understanding the indices, the macroeconomic drivers, and the difference between noise and signal, you move from being a passive observer to an informed participant.
Remember that the market’s daily “mood” is temporary, but the long-term trajectory of the economy has historically been upward. Use the daily updates to sharpen your perspective, but keep your eyes on the horizon. Investing is a marathon, not a sprint; today’s ticker tape is just one small step in a much longer journey toward financial independence.
aViewFromTheCave is a participant in the Amazon Services LLC Associates Program, an affiliate advertising program designed to provide a means for sites to earn advertising fees by advertising and linking to Amazon.com. Amazon, the Amazon logo, AmazonSupply, and the AmazonSupply logo are trademarks of Amazon.com, Inc. or its affiliates. As an Amazon Associate we earn affiliate commissions from qualifying purchases.