
The concept of a “national poverty level” is far more nuanced than a single, static figure. It represents a critical benchmark used by governments, economists, and social scientists to understand the economic well-being of a nation’s populace. Far from being a mere statistical curiosity, this measure profoundly influences policy decisions, resource allocation, and public discourse on social equity. For individuals, understanding where these lines are drawn can be the key to accessing vital support systems and navigating their financial realities. In the realm of personal and national finance, the poverty level serves as a foundational metric, allowing us to gauge economic hardship, track progress, and strategically deploy resources to uplift the most vulnerable members of society.
Understanding the Concept of Poverty
Poverty is a multifaceted condition characterized by a lack of financial resources and essential goods and services necessary for a minimum standard of living. However, its definition and measurement can vary significantly, leading to different interpretations and policy approaches. Grasping these fundamental distinctions is crucial for an insightful discussion on the national poverty level.
Defining Poverty: Absolute vs. Relative
When we talk about poverty, we typically refer to two main types: absolute and relative.
- Absolute Poverty: This refers to a severe deprivation of basic human needs, including food, safe drinking water, sanitation facilities, health, shelter, education, and information. It means not having enough income to afford the minimum necessities of life, regardless of where one lives. The threshold for absolute poverty is generally fixed over time and across countries, often measured by a very low income figure, such as the World Bank’s international poverty line of living on less than $2.15 per day (in 2017 purchasing power parity). This measure aims to capture the most extreme forms of material deprivation.
- Relative Poverty: In contrast, relative poverty defines poverty in relation to the economic standard of living of a particular society or country. An individual or household is considered relatively poor if they have an income below a certain percentage (often 50% or 60%) of the median income in their geographical area. This means that a person could be considered relatively poor even if they can afford basic necessities, simply because their income is significantly lower than that of the majority of the population. Relative poverty often reflects economic inequality within a society and highlights disparities in opportunities and access to resources. Developed nations, including the United States, predominantly use relative measures, or a hybrid approach, to define their national poverty levels, recognizing that a basic standard of living evolves with societal norms and economic growth.
The Importance of a National Poverty Line
A national poverty line is a critical financial tool for any country. It serves several vital functions:
- Policy Formulation: The poverty line is indispensable for governments to design, implement, and evaluate social welfare programs. It determines eligibility for a wide array of assistance, including food stamps (SNAP), Medicaid, housing subsidies, and various educational grants. Without a clear threshold, targeting aid effectively would be nearly impossible.
- Resource Allocation: By identifying segments of the population living below the poverty line, governments and non-profit organizations can strategically allocate financial and material resources to regions and communities most in need, ensuring that interventions have the greatest possible impact.
- Economic Monitoring: The poverty rate—the percentage of the population living below the poverty line—is a key economic indicator. It allows economists and policymakers to track economic trends, assess the impact of economic policies, and understand the distribution of wealth and income within the nation. Changes in the poverty rate over time can signal economic downturns or successes.
- Public Awareness and Advocacy: A concrete poverty line provides a measurable benchmark that helps raise public awareness about economic hardship. It fuels public debate, advocacy efforts by non-governmental organizations, and calls for policy changes aimed at poverty reduction.
- International Comparisons: While national poverty lines vary, they contribute to broader international efforts to understand and address global poverty, allowing for comparisons of economic well-being across different countries.
In essence, the national poverty level is not just a number; it’s a foundational concept that underpins a nation’s understanding of economic equity and its commitment to ensuring a minimum standard of living for all its citizens.
How the U.S. Poverty Level is Calculated
In the United States, the primary method for determining who is considered “poor” has historically been the Official Poverty Measure (OPM). While widely used, it’s also been the subject of considerable debate due to its methodological origins and limitations in reflecting modern economic realities.
The Official Poverty Measure (OPM): History and Methodology
The OPM was developed in the early 1960s by Mollie Orshansky, an economist at the Social Security Administration. Her methodology was rooted in the finding that families spent approximately one-third of their income on food. Therefore, she calculated poverty thresholds by taking the cost of a minimum food diet (specifically, the U.S. Department of Agriculture’s “economy food plan” for families of various sizes and compositions) and multiplying it by three.
- Initial Calculation: Orshansky’s original thresholds, established in 1963-1964, were based on these food costs.
- Annual Updates: Since 1969, these original thresholds have been updated annually solely for inflation using the Consumer Price Index for All Urban Consumers (CPI-U). Crucially, the methodology itself has remained largely unchanged, meaning the ‘times three’ multiplier for food costs is still implicitly used, despite significant changes in household spending patterns over the past sixty years.
Key Components: Income Thresholds and Family Size
The OPM operates by comparing a household’s pre-tax cash income to a set of poverty thresholds.
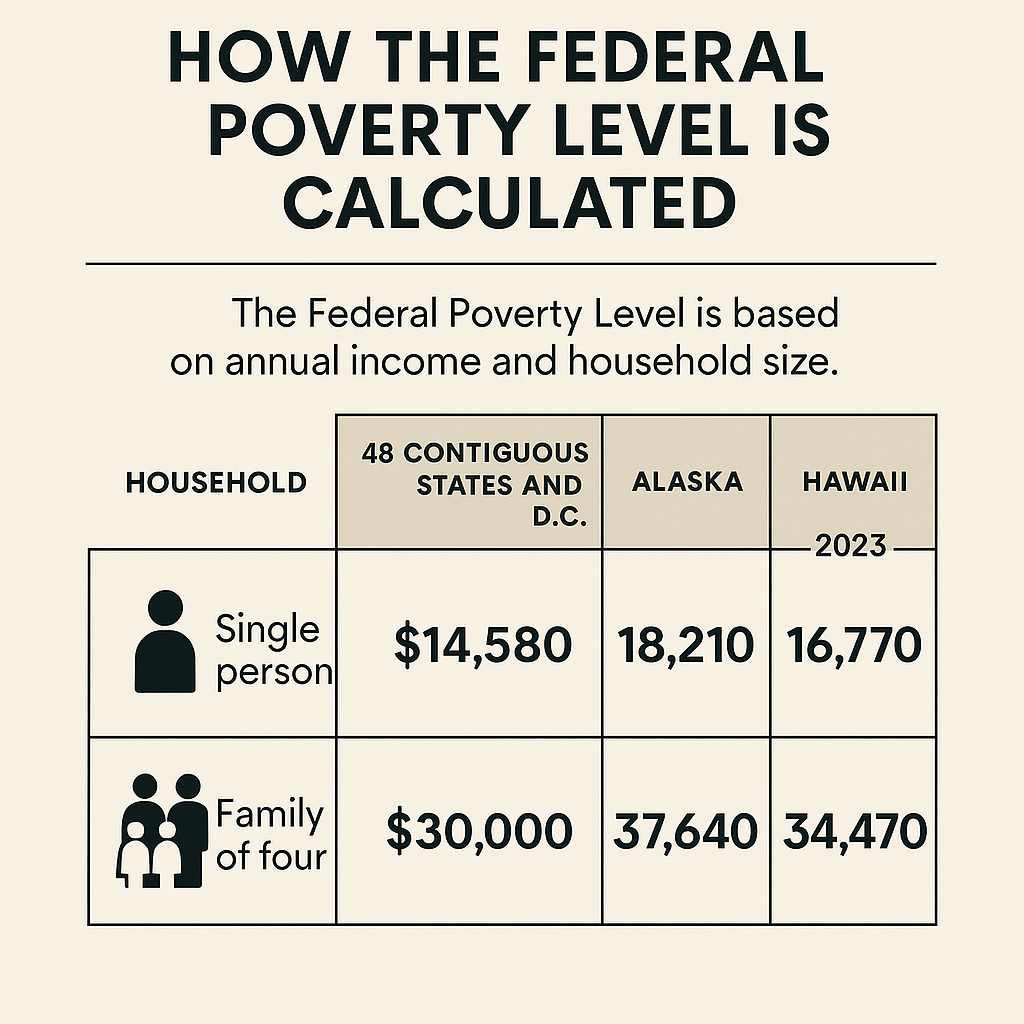
- Poverty Thresholds: These are dollar amounts that vary by family size and composition (e.g., number of adults, number of children). For instance, the threshold for a single individual is different from that for a two-parent household with two children. In 2023, for example, the poverty threshold for a single individual under 65 was $14,580, while for a family of four with two children, it was $29,950.
- Pre-Tax Cash Income: The OPM considers only gross cash income before taxes. This includes wages, salaries, self-employment income, Social Security benefits, public assistance, interest, dividends, and other regular cash income sources.
If a family’s total pre-tax cash income falls below their applicable poverty threshold, every individual in that family is counted as being in poverty.
Criticisms and Limitations of the OPM
Despite its long history and widespread use, the OPM faces substantial criticism for its inherent limitations in reflecting the true cost of living and the complexities of modern household economics:
- Outdated Consumption Patterns: The original “one-third of income on food” premise is no longer accurate. Today, housing, healthcare, childcare, and transportation consume a much larger share of household budgets than food. By only adjusting for inflation, the OPM fails to account for these shifts.
- Exclusion of Non-Cash Benefits: The OPM does not consider non-cash government benefits, such as SNAP (food stamps), housing subsidies, Medicaid, or the Earned Income Tax Credit (EITC). These programs provide significant support to low-income families, and their exclusion means the OPM potentially overestimates the number of people experiencing actual resource deprivation.
- Exclusion of Work Expenses and Taxes: Conversely, the OPM does not subtract necessary work expenses (like transportation or childcare) or taxes paid, which reduce a household’s disposable income. This omission can understate the financial strain on working poor families.
- No Geographic Variation: A significant flaw is the OPM’s single national threshold. The cost of living varies dramatically across different regions, states, and even cities within the United States. $30,000 might allow a modest lifestyle in a rural area but would be severely inadequate in a major metropolitan area like New York City or San Francisco. The OPM fails to account for these critical regional differences.
- Ignores Medical Out-of-Pocket Expenses: Healthcare costs are a major burden, especially for low-income households. The OPM does not factor in medical out-of-pocket expenses, which can push families into financial distress even if their income is technically above the poverty line.
These limitations highlight the need for more comprehensive measures to accurately capture the financial realities faced by American households, leading to the development of alternative metrics like the Supplemental Poverty Measure.
Beyond the Official Measure: Supplemental Poverty Measure (SPM)
Recognizing the significant shortcomings of the Official Poverty Measure (OPM), the U.S. government developed and began publishing the Supplemental Poverty Measure (SPM) in 2011. The SPM aims to provide a more nuanced and accurate picture of poverty by addressing many of the OPM’s criticisms.
Addressing the OPM’s Shortcomings
The SPM was designed specifically to overcome the most glaring deficiencies of the OPM:
- Modernizing Thresholds: Instead of relying on a food multiplier from the 1960s, the SPM calculates poverty thresholds based on a budget for food, clothing, shelter, and utilities (FCSU). It uses actual expenditure data from the Consumer Expenditure Survey, reflecting current spending patterns, and adds a small allowance for other basic needs.
- Accounting for Non-Cash Benefits: Unlike the OPM, the SPM includes the value of key government non-cash benefits designed to assist low-income households. This provides a more realistic view of the total resources available to a family.
- Incorporating Geographic Variation: A crucial improvement, the SPM adjusts its poverty thresholds for geographical differences in the cost of living. It sets different thresholds for different housing markets across the country, recognizing that a dollar goes further in some areas than others.
What the SPM Includes: Resources and Expenses
The SPM’s methodology is considerably more complex and comprehensive than the OPM’s, reflecting a more complete understanding of household finances:
- Resources: The SPM starts with a measure of cash income, similar to the OPM. However, it then adds the value of various non-cash government benefits that households receive. These include:
- Nutritional assistance (e.g., SNAP, school lunch programs)
- Housing subsidies
- Energy assistance
- Tax credits (e.g., Earned Income Tax Credit, Child Tax Credit)
- Expenses: From this adjusted income, the SPM then subtracts necessary expenses that reduce a household’s disposable income and financial capacity. These include:
- Taxes: Federal and state income taxes, as well as payroll taxes.
- Work Expenses: Costs associated with earning income, such as transportation to work, uniforms, and childcare.
- Medical Out-of-Pocket Expenses (MOOP): Deductibles, co-payments, and other healthcare costs not covered by insurance. This is a significant factor, as high MOOP can be a major driver of financial hardship.
- Child Support Paid: Payments made to ex-spouses or partners for child support.
By factoring in both additional resources and necessary expenses, the SPM paints a much more detailed and accurate picture of a household’s actual economic standing and its ability to meet basic needs.
Comparing OPM and SPM Results
Because of their differing methodologies, the OPM and SPM often yield different poverty rates and demographic profiles of the poor, providing distinct insights:
- Overall Poverty Rate: The national SPM poverty rate is generally higher than the OPM rate. For example, in 2022, the OPM poverty rate was 11.5%, while the SPM poverty rate was 12.4%. This difference often stems from the SPM’s inclusion of work and medical expenses, which push more people below the adjusted thresholds, even as non-cash benefits pull some people above.
- Demographic Differences: The SPM can change which demographic groups appear to be in poverty:
- Elderly: The SPM often shows higher poverty rates for the elderly. This is largely due to their higher medical out-of-pocket expenses, which are subtracted from their income in the SPM, and their relatively lower receipt of work-related benefits.
- Families with Children: The SPM often shows lower poverty rates for families with children, particularly those working, because it includes the value of tax credits like the EITC and Child Tax Credit, as well as nutrition and housing assistance.
- Geographic Variation: The SPM reveals higher poverty rates in high-cost-of-living areas (e.g., coastal cities) compared to the OPM, which uses a uniform national threshold. Conversely, it might show lower rates in lower-cost areas.
- Impact of Policy: The SPM is particularly useful for assessing the effectiveness of specific government programs in reducing poverty. By including the value of non-cash benefits and tax credits, analysts can see how much these programs lift people above the SPM poverty line. For instance, without Social Security, SNAP, or refundable tax credits, the SPM poverty rate would be substantially higher.
In essence, while the OPM remains the official statistical measure for certain program eligibility, the SPM is increasingly recognized as a more robust and policy-relevant indicator of economic well-being and hardship in the United States.
The Impact of Poverty Levels on Policy and Individuals
The national poverty level, whether measured by the OPM or the SPM, is not merely an academic exercise. It carries profound implications for government policy, economic strategy, and the daily financial lives of millions of Americans. It acts as a critical interface between economic statistics and tangible financial support.
Guiding Social Programs and Eligibility
Perhaps the most direct impact of the national poverty level is its role in determining eligibility for a vast array of federal and state social safety net programs. These programs are designed to provide financial assistance and essential services to low-income individuals and families, helping them meet basic needs.
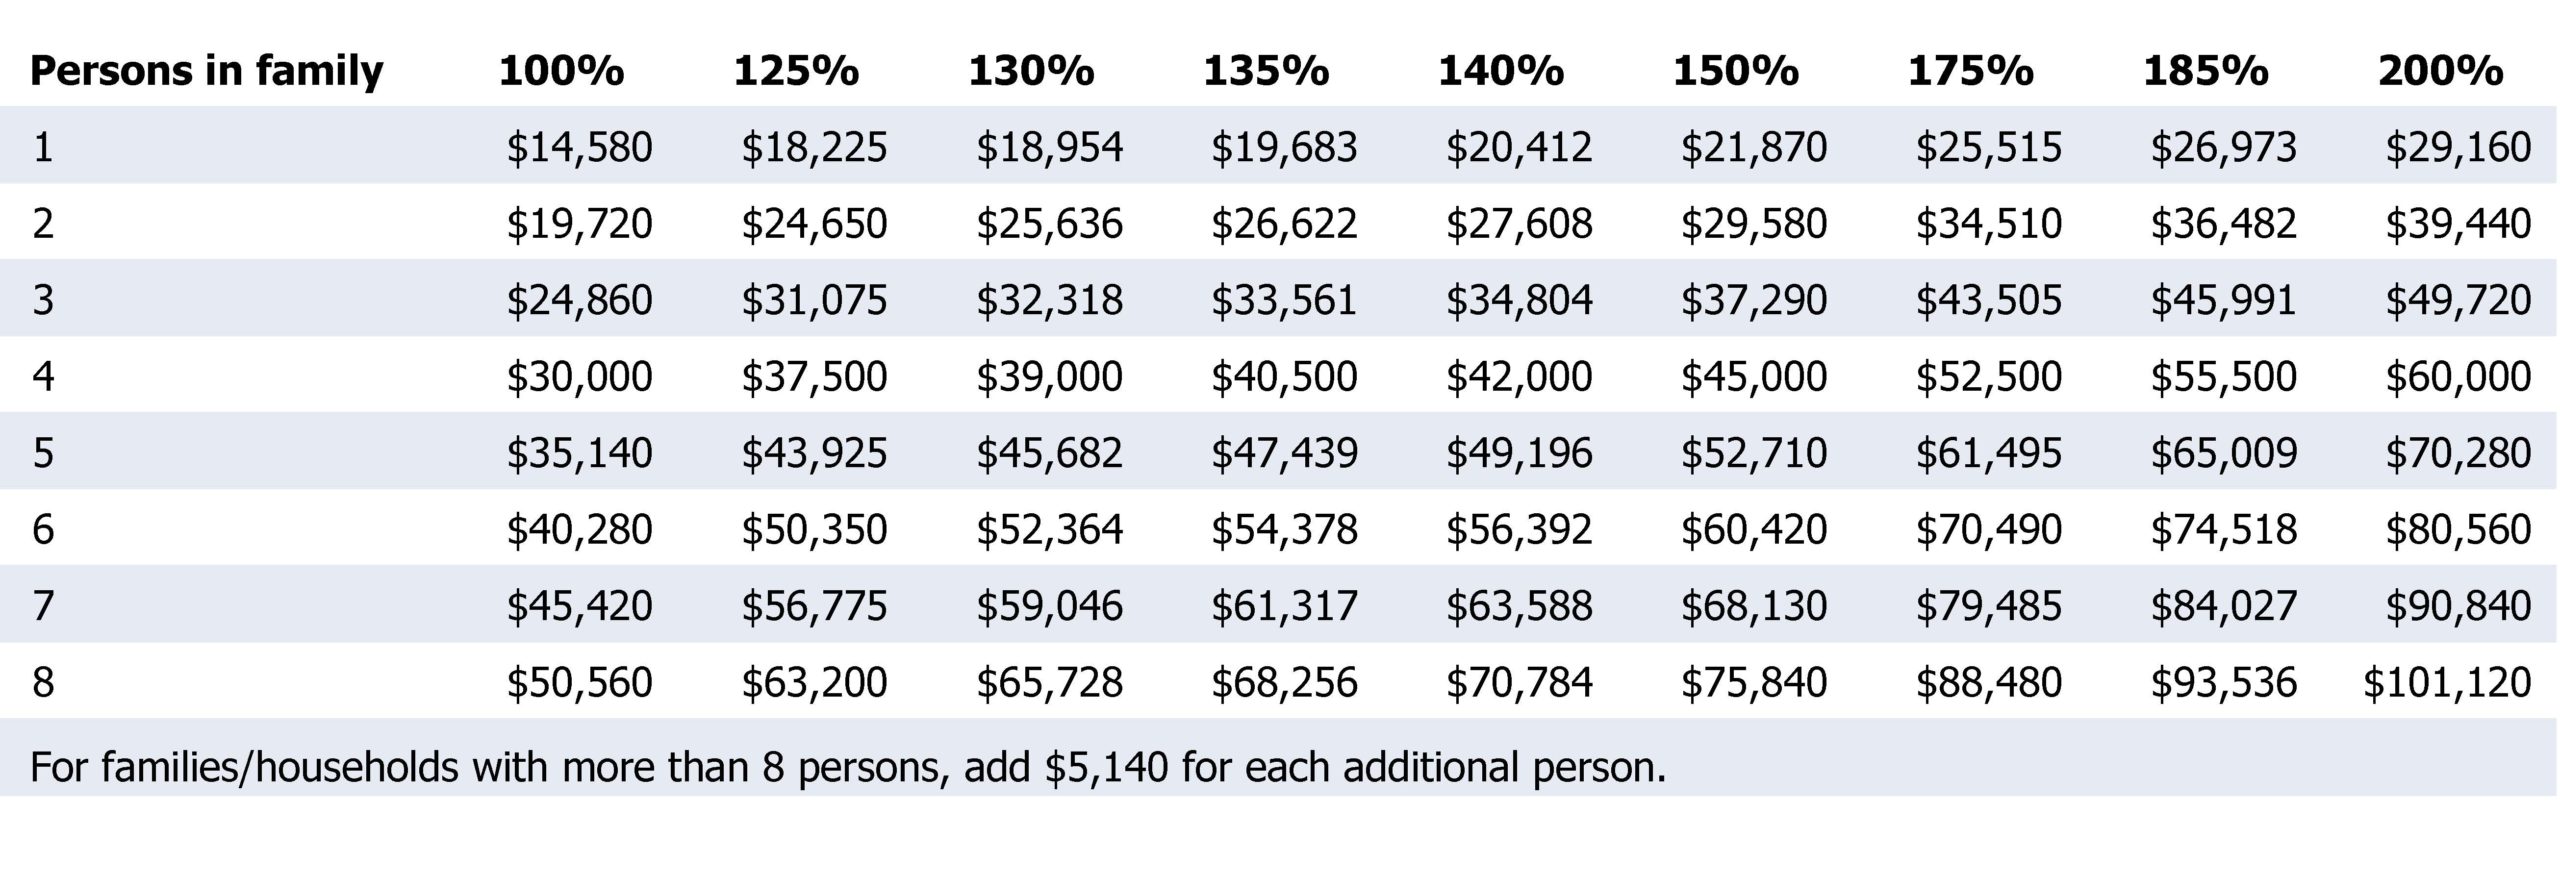
- Poverty Guidelines: The Department of Health and Human Services (HHS) issues annual “Poverty Guidelines,” which are a simplified version of the OPM thresholds. These guidelines are used by administrative agencies to determine financial eligibility for numerous federal programs. Examples include:
- Medicaid and CHIP: Health insurance for low-income individuals and children.
- SNAP (Supplemental Nutrition Assistance Program): Food assistance.
- Housing Assistance Programs: Such as Section 8 housing vouchers.
- Head Start: Early childhood education programs.
- Low-Income Home Energy Assistance Program (LIHEAP): Help with heating and cooling costs.
- Federal Pell Grants: Financial aid for higher education.
- Tiered Eligibility: Many programs use a tiered approach, with eligibility often set at percentages of the poverty level (e.g., 100%, 130%, 185%, or 200% of the federal poverty line). This creates a ladder of support, attempting to capture those who are poor but also those who are “near poor” and still struggling financially.
- State-Level Variation: While federal guidelines provide a baseline, individual states often have the flexibility to set their own income thresholds for state-funded programs, which can be more or less generous than the federal standards, reflecting regional costs of living and political priorities.
Without these clearly defined poverty levels, the administration of such programs would be chaotic, inefficient, and susceptible to arbitrary decision-making, undermining their very purpose of providing targeted financial relief.
Economic Indicators and Policy Making
Beyond direct program eligibility, poverty levels serve as vital economic indicators that inform broader macroeconomic policy and stimulate legislative action.
- Economic Health Assessment: The national poverty rate is a key metric in assessing the overall health and equity of the economy. A rising poverty rate can signal economic distress, increased unemployment, or widening income inequality, prompting policymakers to consider interventions such as stimulus packages, job creation initiatives, or minimum wage adjustments.
- Evaluating Policy Effectiveness: Policymakers use changes in poverty rates over time, particularly those derived from the SPM (which includes the effect of non-cash benefits), to evaluate the effectiveness of existing social programs and tax policies. If poverty rates remain stubbornly high despite significant spending, it can trigger calls for program reform or new approaches.
- Budgetary Decisions: Understanding the scope and demographics of poverty helps federal and state governments allocate significant portions of their budgets. Decisions about funding levels for education, healthcare, infrastructure, and social services are often directly influenced by poverty statistics and projections.
- Research and Analysis: Academics and think tanks rely on poverty data to conduct research on social mobility, the impact of various economic shocks, and the long-term consequences of poverty on health, education, and crime. This research, in turn, informs public debate and policy recommendations.
Financial Implications for Individuals and Families
For individuals and families living near or below the national poverty level, these numbers translate directly into their daily financial realities and opportunities.
- Access to Basic Needs: Being identified as living in poverty can be the gateway to obtaining critical financial assistance for food, shelter, healthcare, and utilities. This support can mean the difference between having a roof over one’s head or being homeless, between proper nutrition or hunger, and between accessing medical care or suffering untreated illness.
- Cycle of Poverty: For those just above the poverty line, the “cliff effect” can be a significant financial challenge. A small increase in income, even a raise that might seem beneficial, can result in a loss of critical benefits that are worth more than the income gain, effectively making them worse off. This discourages work and makes it difficult for families to achieve genuine financial independence.
- Limited Opportunities: Poverty often correlates with limited access to quality education, healthcare, and employment opportunities. This can perpetuate a cycle of poverty across generations, where financial constraints restrict access to the very tools needed for upward mobility.
- Financial Stress and Health: Living in persistent financial stress due to poverty has documented negative impacts on mental and physical health. The constant struggle to make ends meet, coupled with inadequate access to resources, can lead to chronic stress, anxiety, and poorer health outcomes, incurring long-term financial costs on both individuals and the healthcare system.
- Debt Accumulation: Families in poverty are often more susceptible to high-interest loans (e.g., payday loans, title loans) and predatory financial practices, leading to a spiral of debt that is incredibly difficult to escape, further eroding their financial stability.
In sum, the national poverty level is far more than a statistical figure; it is a powerful determinant of who gets help, what policies are pursued, and the financial trajectory of millions of lives.
Addressing Poverty: Strategies and Future Directions
Tackling poverty is one of the most enduring and complex challenges facing any nation, requiring a multi-faceted approach that integrates government intervention, economic development, and individual empowerment. Understanding the national poverty level is the first step; crafting effective strategies to reduce it is the ongoing imperative within the money and finance landscape.
Government Initiatives and Social Safety Nets
Government programs form the bedrock of poverty reduction efforts, creating a financial safety net designed to catch individuals and families experiencing hardship.
- Income Support Programs: These include direct cash assistance (though less prevalent than in the past), unemployment benefits, and refundable tax credits like the Earned Income Tax Credit (EITC) and the Child Tax Credit (CTC). The EITC, in particular, has been lauded for its effectiveness in lifting working families out of poverty and incentivizing work.
- In-Kind Benefits: Providing essential goods and services directly helps meet basic needs. SNAP, Medicaid, housing assistance vouchers, and school meal programs reduce financial strain on low-income households, freeing up resources for other necessities.
- Job Training and Education Programs: Recognizing that stable employment is key to long-term financial stability, governments invest in programs that provide vocational training, basic education, and job placement services to enhance employability and earning potential.
- Minimum Wage Policies: Debates around raising the federal minimum wage are directly tied to poverty reduction. Advocates argue that a higher minimum wage provides a living wage, reducing reliance on public assistance, while opponents raise concerns about potential job losses and inflationary pressures. This is a critical discussion within the realm of personal and business finance.
- Early Childhood Development: Investments in programs like Head Start and universal pre-kindergarten aim to break the cycle of poverty by providing disadvantaged children with a strong educational foundation, improving their long-term economic prospects.
The Role of Financial Literacy and Education
While systemic issues require systemic solutions, empowering individuals with financial knowledge and skills is a crucial complementary strategy in the fight against poverty.
- Budgeting and Saving: Financial education helps individuals develop crucial skills in budgeting, managing expenses, and building emergency savings. These skills are essential for navigating financial challenges and avoiding debt spirals, irrespective of income level.
- Debt Management: Understanding different types of debt, interest rates, and strategies for debt reduction (e.g., debt consolidation, credit counseling) can prevent financial ruin and help individuals regain control over their finances.
- Accessing Resources: Financial literacy also involves educating individuals about available government benefits, community resources, and responsible financial products, ensuring they can access support when needed and avoid predatory lenders.
- Investing for the Future: For those capable of saving, even small amounts, education on basic investing principles can help build wealth over time, fostering long-term financial security and breaking intergenerational poverty cycles.
- Entrepreneurship and Skill Development: Financial education can also foster an entrepreneurial mindset, equipping individuals with the knowledge to start small businesses or develop marketable skills that lead to higher incomes.
Integrating robust financial literacy programs into schools and community centers is increasingly seen as a vital investment in individual and national financial resilience.

Debates on Universal Basic Income and Wealth Redistribution
Looking to the future, more transformative ideas are being debated as potential solutions to poverty, particularly in an era of increasing automation and economic inequality.
- Universal Basic Income (UBI): UBI proposes a regular, unconditional cash payment to all citizens, regardless of their income, wealth, or employment status. Proponents argue it could eliminate absolute poverty, reduce administrative burdens of existing welfare programs, improve health outcomes, and provide a safety net for those displaced by automation. Critics raise concerns about its cost, potential disincentives to work, and inflationary effects. Pilots and discussions about UBI are increasingly gaining traction in economic policy circles.
- Wealth Redistribution Policies: These policies aim to reduce extreme wealth inequality and fund social programs by transferring wealth from the richest segments of society to others. This can involve progressive taxation (e.g., higher income tax rates for top earners), wealth taxes (taxes on accumulated assets), and inheritance taxes. The goal is to create a more equitable distribution of resources and opportunities, thereby alleviating poverty.
- Job Guarantees: Another proposed policy is a federal job guarantee, ensuring that anyone who wants a job can have one, often in public service or infrastructure roles, at a living wage. This aims to eliminate unemployment and provide a direct path out of poverty through stable employment.
While these strategies involve complex economic and political considerations, they represent the ongoing search for innovative and sustainable ways to address the persistent challenge of poverty, ensuring that a robust understanding of the national poverty level informs efforts to foster a more inclusive and prosperous society for all.
aViewFromTheCave is a participant in the Amazon Services LLC Associates Program, an affiliate advertising program designed to provide a means for sites to earn advertising fees by advertising and linking to Amazon.com. Amazon, the Amazon logo, AmazonSupply, and the AmazonSupply logo are trademarks of Amazon.com, Inc. or its affiliates. As an Amazon Associate we earn affiliate commissions from qualifying purchases.