
In the world of personal finance and sophisticated investing, we often search for the “signal” within the “noise.” Market volatility creates jagged, unpredictable lines on a chart, making it difficult for the average investor to discern where their wealth is truly heading. To solve this, professional analysts borrow a fundamental concept from geometry and calculus: the secant line.
While the term may sound like a relic from a high school trigonometry class, the secant line is one of the most powerful conceptual tools for understanding growth trajectories, calculating average returns, and making data-driven decisions about your financial future. In the context of money, a secant line is more than just a geometric segment; it is the visual representation of the average rate of change over a specific period.
The Geometry of Finance: Defining the Secant Line in a Monetary Context
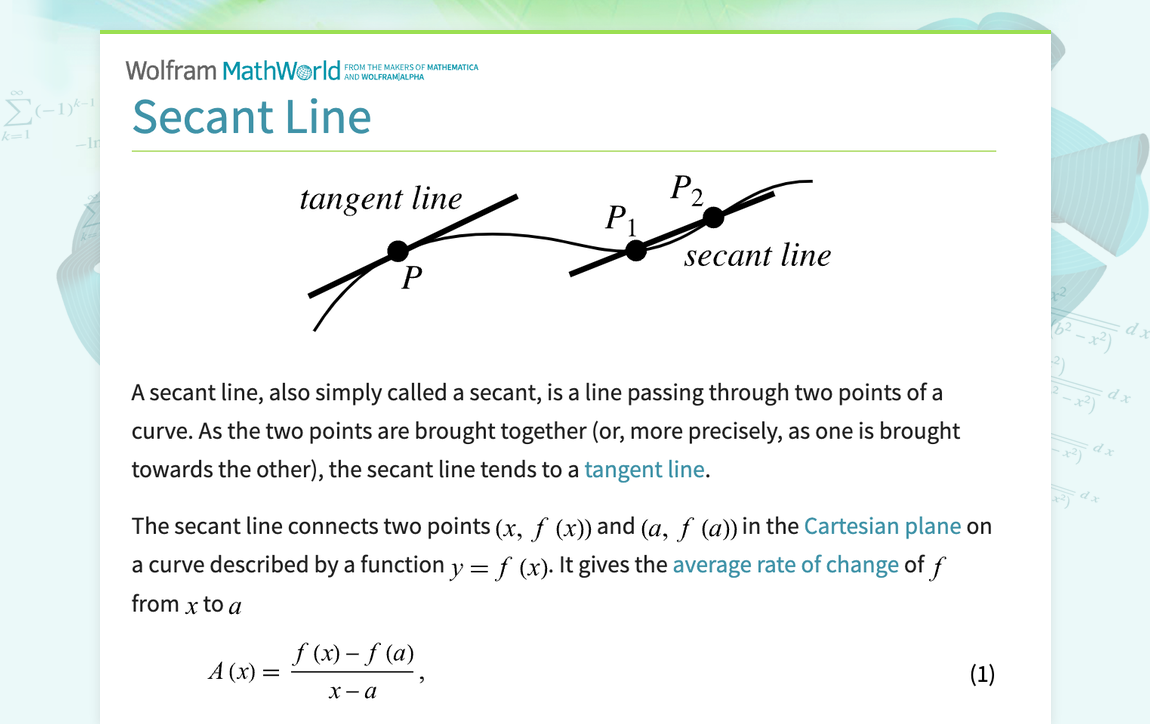
At its most basic level, a secant line is defined as a straight line that intersects a curve at two or more points. When we apply this to a financial chart—such as the price action of an index fund or the equity curve of a retirement portfolio—the “curve” represents the fluctuating value of the asset over time.
From Geometry to the Balance Sheet
In geometry, the slope of a secant line represents how fast a function is changing between two points. In finance, this slope is synonymous with your return on investment (ROI) or the yield of a particular asset class. If you plot your initial investment on January 1st (Point A) and your portfolio value on December 31st (Point B), the straight line connecting those two points is the secant line.
The beauty of the secant line in a financial context is its ability to simplify complexity. It ignores the “dips” and “peaks” that occurred in the intervening months, providing a clear, linearized view of whether your capital is appreciating or depreciating. It tells the story of the result rather than the journey, which is essential for long-term strategic planning.
The Difference Between Instantaneous and Average Change
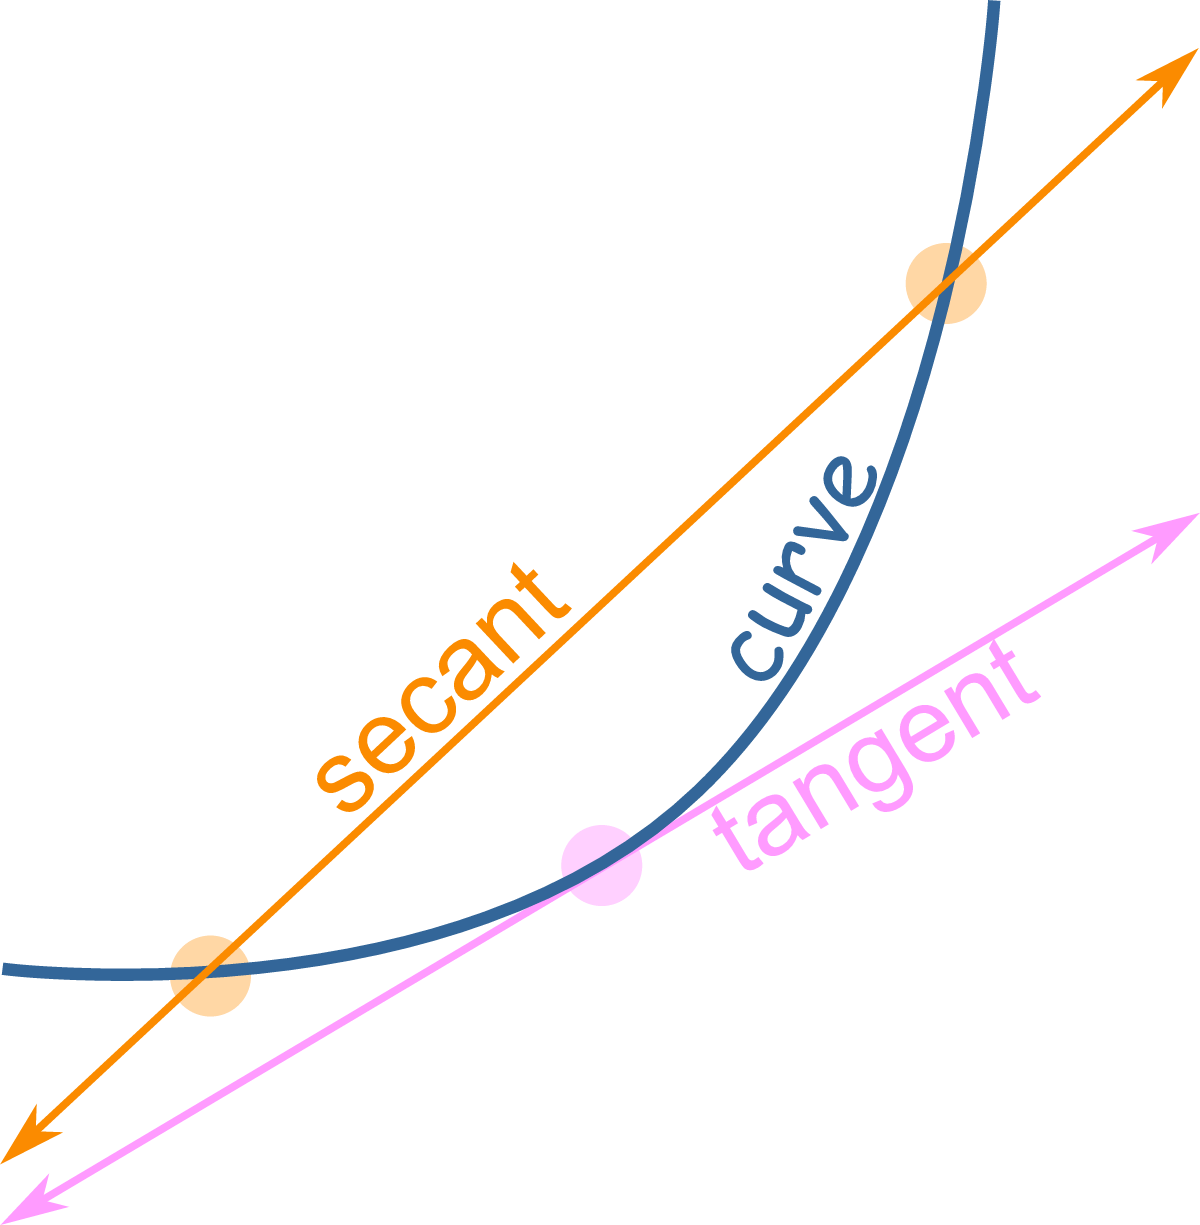
To understand why the secant line matters to your money, you must distinguish it from its cousin: the tangent line. In finance, a tangent line represents the “instantaneous” rate of change—the exact momentum of a stock at a specific second in time. This is the realm of day traders and high-frequency algorithms.
The secant line, however, represents the “average” rate of change. For the long-term investor, the secant line is far more relevant. It measures the sustainable velocity of wealth accumulation. While the tangent line might show a terrifying 10% drop on a Tuesday afternoon, the secant line spanning the decade might show a steady, reassuring 7% annual growth rate. Understanding this distinction is the first step toward emotional discipline in investing.
Applying the Secant Line to Portfolio Management
Managing a portfolio requires a constant assessment of performance against benchmarks. The secant line provides the mathematical framework for these comparisons, allowing investors to move beyond “gut feelings” and toward rigorous quantitative analysis.
Measuring Average Annual Growth Rates (AAGR)
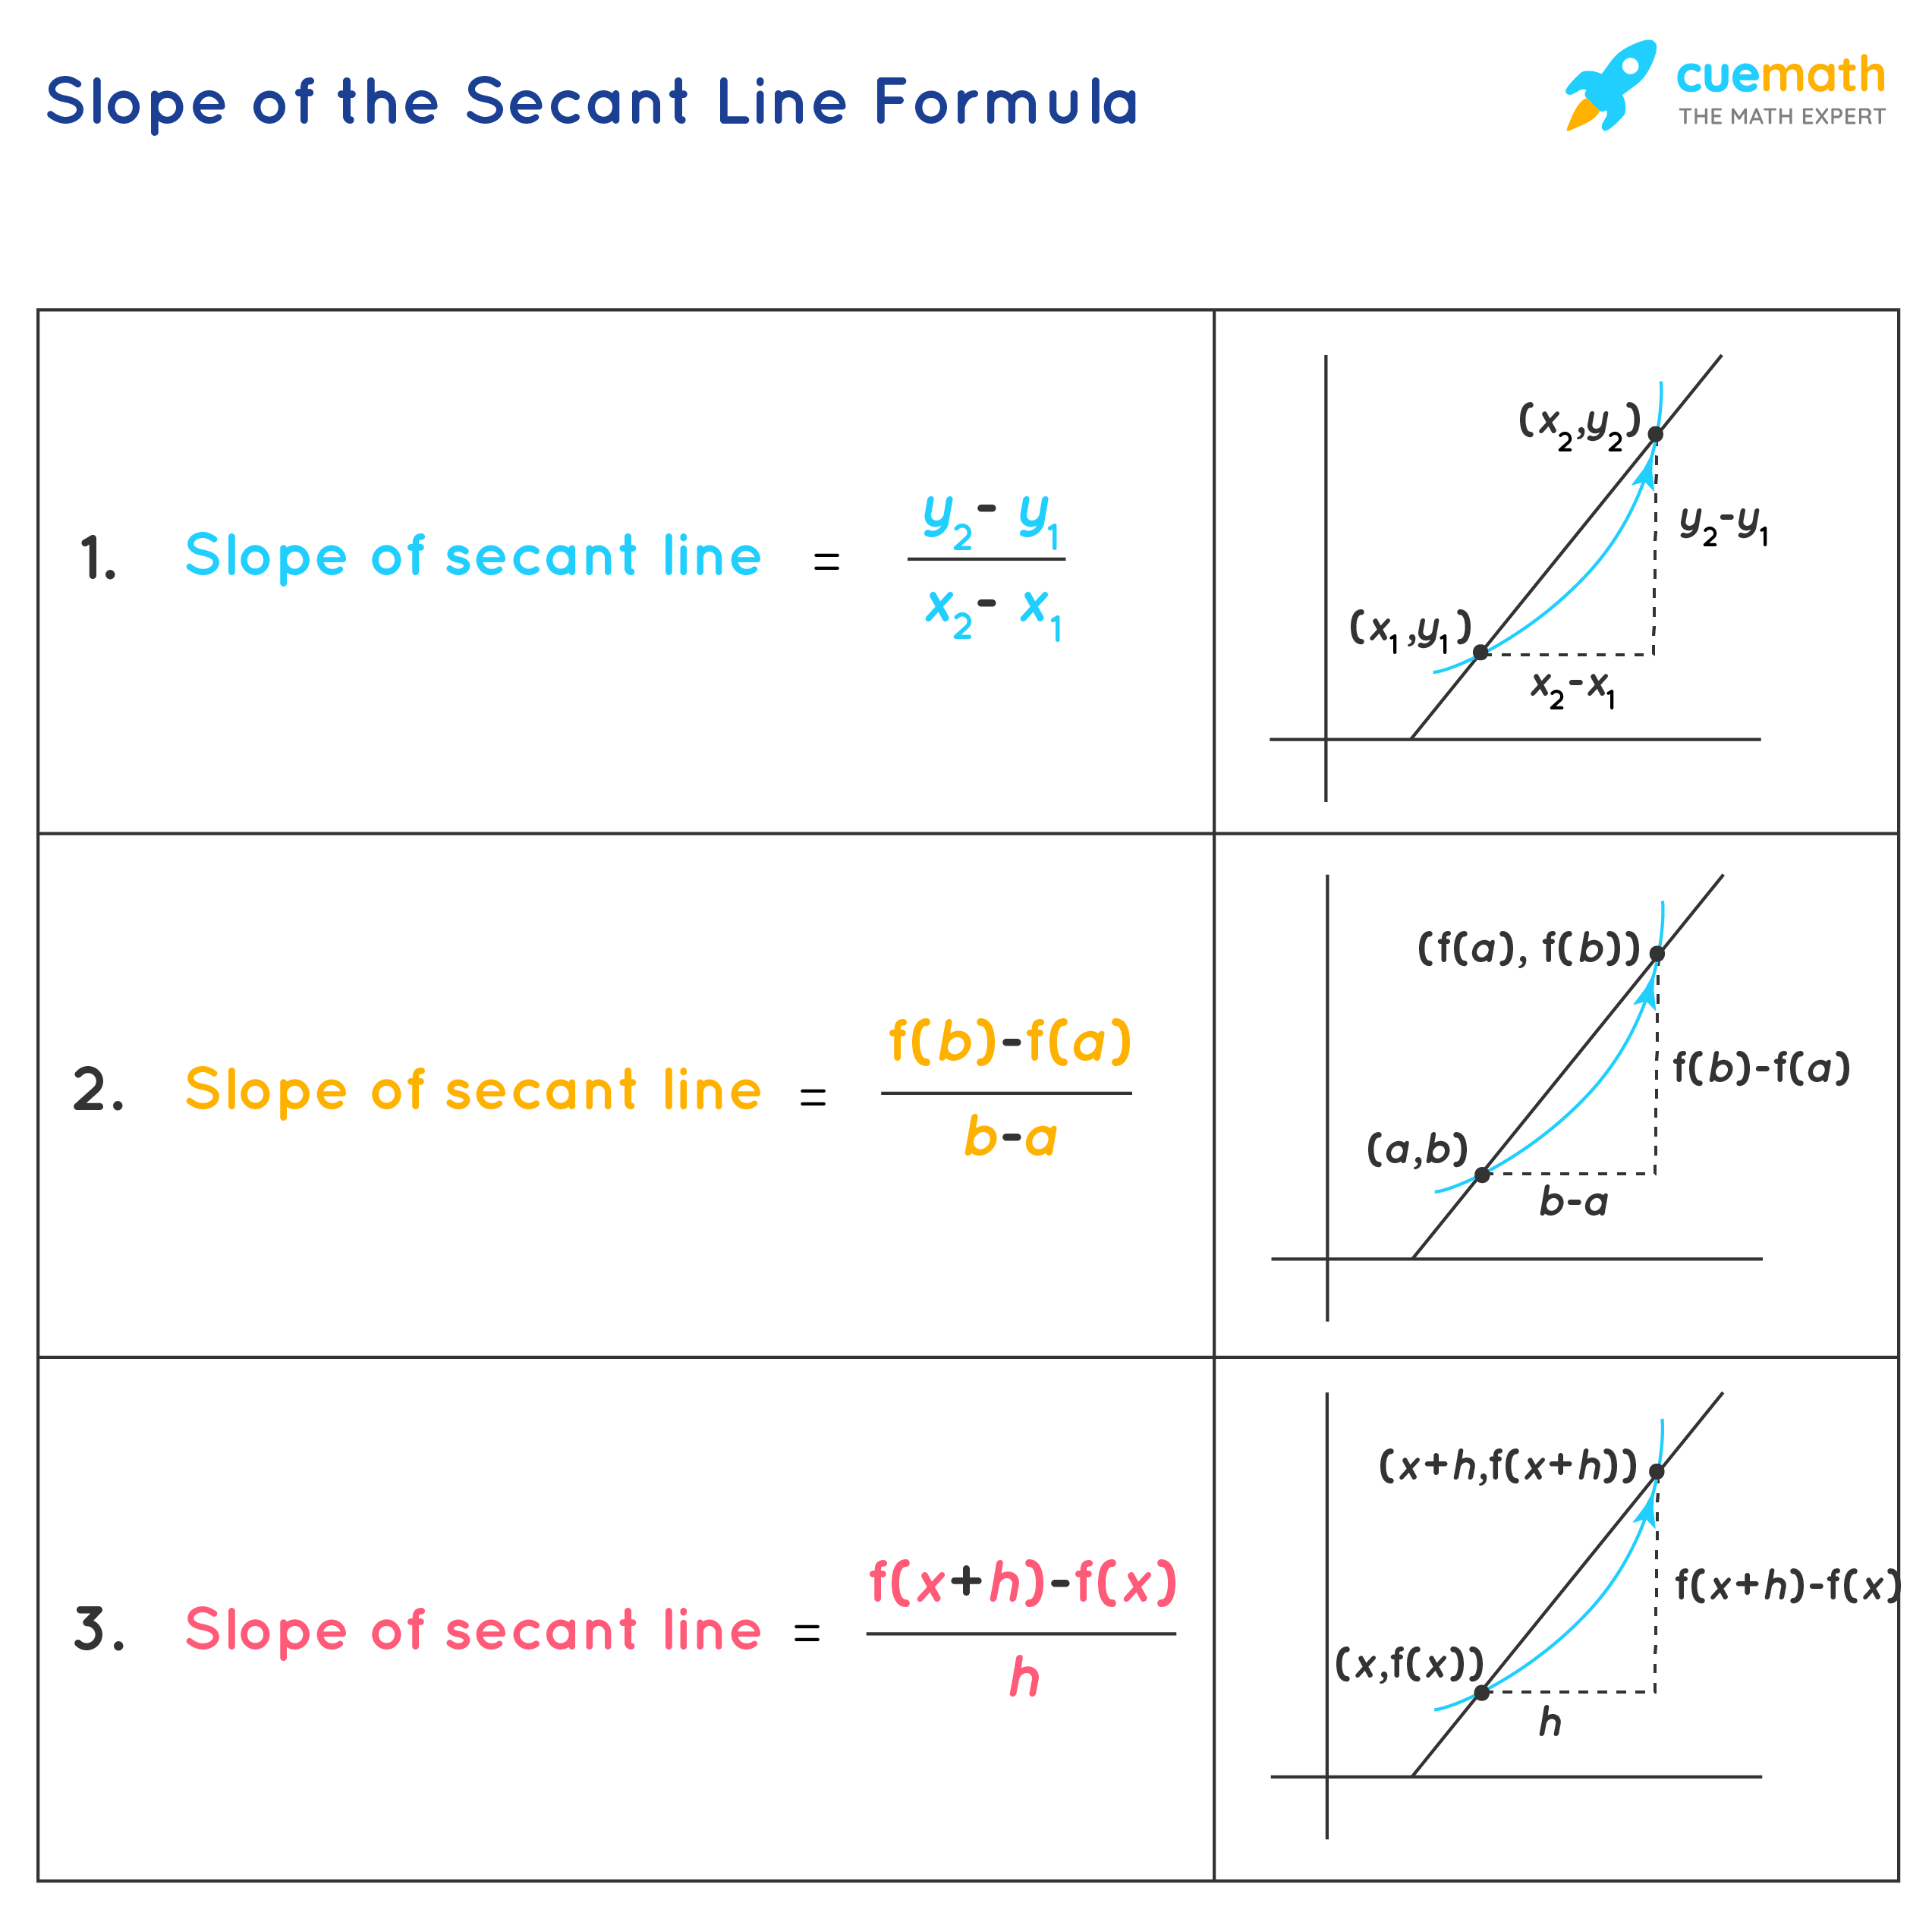
When an investor asks, “What was my average return over the last five years?”, they are effectively asking for the slope of a secant line. If your portfolio started at $100,000 and ended at $150,000 over five years, the secant line connects those two values across the time axis.
The slope of this line—the vertical change divided by the horizontal change—reveals the average annual growth. This is a critical metric for determining if you are on track to meet retirement goals. By calculating the secant slope across different time intervals (1-year, 5-year, 10-year), you can identify whether your wealth-building momentum is accelerating or stagnating.
Comparing Performance Intervals
One of the most effective ways to use secant lines in financial analysis is through “rolling period” evaluations. Instead of just looking at a single line from the start of your investment to the present, sophisticated investors look at multiple secant lines of equal duration (e.g., every 3-year period within a 15-year window).
This technique allows you to see how the average rate of change varies during different market cycles. If the slopes of your secant lines remain positive through various intervals, it indicates a robust and diversified strategy. If the slopes fluctuate wildly, it suggests your portfolio may be over-exposed to volatility, necessitating a rebalance into more stable, fixed-income assets.
Technical Analysis and Market Trends
In the niche of trading and active market participation, the secant line serves as a foundational element for several technical indicators. Traders use these linearized paths to cut through market “chatter” and identify the true direction of an asset’s price.
The Secant Line as a Trend Indicator
A common struggle for investors is determining when a “correction” has turned into a “bear market.” By drawing secant lines between significant price peaks and troughs, analysts can determine the “Trend Intensity.”
A secant line with a steep positive slope indicates a high-momentum bull market. If a new secant line drawn from more recent data points shows a flattening slope, it is a mathematical warning that the trend is losing steam. This “slope decay” is often a leading indicator that it may be time to harvest profits or tighten stop-loss orders.
Predictive Modeling in Volatile Markets
In financial modeling, the “Secant Method” is a specific root-finding algorithm used to estimate the future value of variables where the exact formula is unknown. While it sounds complex, the application is straightforward: it uses a succession of secant lines to home in on a target value, such as a “break-even” price or a “target strike” for an option.
For investors using financial tools to project future wealth, these tools are often running secant-based simulations in the background. By taking two historical data points and projecting that line into the future, the software provides a “linear extrapolation” of where your net worth might be in twenty years, assuming the average rate of change remains constant.
Financial Tools and Software for Secant Analysis
In the modern era, you don’t need a degree in calculus to utilize secant line logic. A variety of digital financial tools and software applications automate these calculations, giving you high-level insights into your money with the click of a button.
Leveraging Spreadsheet Functions for Growth Slopes
For those who manage their own finances, Microsoft Excel and Google Sheets offer built-in functions that are essentially secant line generators. The SLOPE function and the LOGEST function allow users to input a series of portfolio values and dates to immediately find the “Line of Best Fit.”
By using these tools, a personal investor can create a “Growth Dashboard.” Instead of being distracted by the daily price fluctuations shown in news headlines, the dashboard focuses on the slope of the secant line. If the slope is $500/month, the investor knows they are moving in the right direction, regardless of whether the market was “red” or “green” that specific morning.
Automated Algorithmic Trading and the Secant Method
In the world of Fintech, “Robo-advisors” use secant-based logic to perform automatic rebalancing. These platforms look at the secant line of various asset classes (Stocks, Bonds, REITs) over a set period. If one asset class’s secant line is significantly steeper than the others, it means that asset now represents a larger-than-intended portion of the portfolio. The software then automatically sells a portion of that “steep” asset to buy more of the “flat” asset, effectively “selling high and buying low” based on mathematical slopes.
Why the Secant Line Matters for Long-Term Wealth
Ultimately, the importance of the secant line lies in its psychological impact on the investor. The biggest threat to wealth is often not market performance, but human emotion—the tendency to panic during downturns or become over-exuberant during rallies.
Cutting Through Market Noise
The secant line is the ultimate “truth-teller” in finance. It filters out the noise of geopolitical events, quarterly earnings surprises, and social media hype. When you view your financial progress through the lens of a secant line, you are looking at the macro view. You are acknowledging that while the path of wealth is never a straight line, the average of that path is what determines your ultimate success.
For someone saving for a house or a child’s education, the “tangent” (today’s price) is almost irrelevant. What matters is the secant line connecting today to the date the funds are needed. If the slope of that line meets the required financial goal, the investor can remain calm during periods of temporary decline.
Optimizing Entry and Exit Points
Finally, understanding the secant line allows for better timing of large financial moves. By comparing the current price of an asset (a point on the curve) to its long-term secant line, an investor can determine if an asset is “overextended.”
If the current price is significantly higher than the long-term secant line, the asset is likely overvalued, suggesting a poor entry point. Conversely, if the price is well below the secant line, it may represent a “value” opportunity—a chance to buy into a long-term growth trend at a temporary discount. This “Mean Reversion” strategy is the cornerstone of many of the world’s most successful hedge funds.
In conclusion, “what is the secant line?” is not just a question for the classroom. In the world of money, the secant line is the bridge between chaotic data and actionable intelligence. By focusing on the average rate of change rather than the momentary flicker of the ticker tape, you can build a more resilient, predictable, and successful financial future. Whether you are using a simple spreadsheet or a complex trading algorithm, the slope of your secant line is the most important number in your financial life.
aViewFromTheCave is a participant in the Amazon Services LLC Associates Program, an affiliate advertising program designed to provide a means for sites to earn advertising fees by advertising and linking to Amazon.com. Amazon, the Amazon logo, AmazonSupply, and the AmazonSupply logo are trademarks of Amazon.com, Inc. or its affiliates. As an Amazon Associate we earn affiliate commissions from qualifying purchases.